


| Research Article | ||
Open Vet. J.. 2026; 16(2): 920-933 Open Veterinary Journal, (2026), Vol. 16(2): 920-933 Research Article Histochemical study of cingulin and CD34 in the skin of a stray DogShilan Salih Sofi and Snur M. A. Hassan*Department of Anatomy and Histopathology, College of Veterinary Medicine, University of Sulaimani, Sulaymaniyah, Iraq *Corresponding Author: Snur M. A. Hassan. Department of Anatomy and Histopathology, College of Veterinary Medicine, University of Sulaimani, Sulaymaniyah, Iraq. Email: snur.amin [at] univsul.edu.iq, hassan_snur [at] yahoo.com Submitted: 02/10/2025 Revised: 06/04/2025 Accepted: 15/01/2026 Published: XX/XX/XXXX © 2026 Open Veterinary Journal
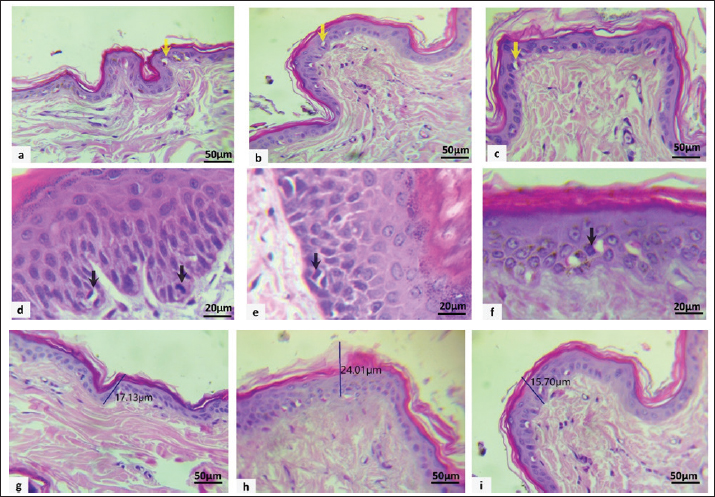
AbstractBackground: Cingulin (CGN) is a tight junction cytoplasmic plaque that regulates gene expression and signal transduction. CD34 is a stem cell that has the potential to achieve self-renewal, continuously producing functional cells to maintain the homeostasis of the epidermis. Aim: This study aimed to understand the distribution, expression, and composition of CGN and CD34 in the epidermal layer compartments of the skin of healthy stray dogs of various ages and to illustrate the relationships between CD34 and CGN. Methods: Twenty male and twenty female dogs were allocated into four groups. Group 1, aged between 6 months and 1 year. Group 2, dogs aged between 1 and 2 years; Group 3, dogs aged between 2 and 4 years; and Group 4, dogs aged between 4 and 6 years. Skin biopsy samples from healthy dogs were obtained from the face, back, and leg regions. Histomorphometric assessment, molecular analysis for detection and quantification, and immunohistochemistry to study CD34 and CGN expression were performed. Results: In male dogs, Groups 3 and 1 had the highest levels of apoptosis in the back region (p < 0.05) versus Groups 1 and 4 displayed peak apoptotic counts in the facial region, while the female group exhibited a significant peak in all regions. In Group 4, the mitotic count showed significant differences (p < 0.05) between all regions in both sexes. Peak epidermal thickness is considerably represented in all parts of the females in groups 2 and 4 (p < 0.05). Group 4 showed a significant increase in the back area of male dogs compared to other groups and regions (p < 0.05). The expression of both genes was negatively correlated in most male and female dogs within the same epidermal skin region. Regarding the immunostaining expression of CD34 stem cells and CGN, in groups one-three was highest in the leg, followed by the back and face. In both sexes, the aged group showed moderately less expression of CD34 and CGN in the leg than in the back and face. Conclusion: These findings propose a region-specific regenerative capacity, lowest in the facial skin, which could explain an increased risk for dermatitis on the face compared with other body locations. Keywords: Apoptotic body, CD34, Cingulin, Epidermis thickness, Stray dog. IntroductionStem cells, which are essential for skin regeneration and repair, interact with many junctions, such as desmosomes, adherens junctions, and tight junctions (TJs), that hold skin cells together and control their behavior. Since aging and damage affect both stem cell activity and junctional integrity, understanding these interactions is essential to prevent skin disorders and preserve skin homeostasis (Wong et al., 2025). Several cutaneous junctions exist between cells and skin compartments, which help to maintain the integrity of the skin against stress (Agner, 2016; Bäsler et al., 2016). TJs are essential for establishing and maintaining a barrier between various body compartments in vertebrate epithelia and endothelia. TJs comprise transmembrane proteins of different classes (Furuse, 2010) such as 4-pass-membrane proteins (occludin, claudins, tricellulin, and marvelD3), Ig-like junctional adhesion molecules, and others (Bves and angulins); cytoplasmic scaffolding proteins (Guillemot et al., 2008) including the zonula occludens (ZO) proteins (ZO-1, ZO-2, and ZO-3), cingulin (CGN), and paracingulin; signaling proteins, including Rho GTPases, their activators (guanine nucleotide exchange factors (GEFs) and inhibitors (GTPase activating proteins), as well as kinases and phosphatases (Citi et al., 2011; Matter and Balda, 2014). The typical TJ structure is found in the skin’s granular layer (Zhao et al., 2021). TJ strands regulate water and solute entry and exit, creating channels between adjacent keratinocytes (Egawa and Kabashima, 2016). A deficiency in TJs results in water and solute loss from the skin and permits allergen entry, leading to dryness and increased allergic reactions. Dry skin and an increased response to allergens are indicative of atopic dermatitis, believed to result from defects in TJs and decreased Claudin-1 levels (De Benedetto et al., 2011; Hadj-Rabia et al., 2018). CGN is an essential member of the cytoplasmic plaque protein of the TJ since its discovery several decades ago. However, its function and the mechanisms underlying its function still need to be fully understood. In addition to its structural function, sufficient evidence suggests that CGN also regulates gene expression (Islas et al., 2002; Betanzos et al., 2004). During adulthood, the skin undergoes continuous renewal, whereas hair follicles undergo growth and degeneration cycles. Stem cells in the epidermis and hair follicles are essential for maintaining adult skin homeostasis, facilitating hair regeneration, and contributing to epidermal recovery following injuries (Blanpain and Fuchs, 2006). Comprehending the protective and regenerative mechanisms that shield mammalian stem cell reservoirs from age and disease-related decline is necessary to counter tissue degeneration (Brunet et al., 2023). Stem cells reside in a specialized microenvironment within the skin known as the stem cell niche, which is composed of adjacent cells, molecular signals, and the extracellular matrix (Rompolas and Greco, 2014). These cells are multipotent, characterized to be “slow-cycling,” and remain relatively undifferentiated. They can utilize transient amplifying cells to exit quiescence and form new hair follicles (Hsu et al., 2014). The localization, marker expression, and functional roles of stem cells in mice have been extensively investigated (Rompolas and Greco, 2014). However, limited knowledge exists regarding humans, and even less is understood about dogs (Kobayashi et al., 2010; Purba et al., 2014). In dogs with hairy skin, the epidermis comprises four layers: stratum cylindricum (stratum basale), stratum spinosum (stratum malpighii or prickle cell layer), stratum granulosum, and stratum corneum. The stratum germinativum is the amalgamation of the stratum cylindricum and stratum spinosum layers. Mitotic activity in both layers contributes to epidermal cell proliferation (Terry et al., 2010; Theerawatanasirikul et al., 2012). Given the existing knowledge gaps, this study investigated the microscopic architecture and molecular profile of stray dog skin. Despite the recognized importance of TJs and stem cells in skin homeostasis, the spatial and temporal expression patterns of key proteins, such as CGN and CD34, in canine skin remain poorly characterized, particularly in stray populations of diverse ages. Therefore, this study aimed to investigate the distribution, expression, and correlation of CGN and CD34 in the epidermal layers of healthy stray dogs across different ages and body regions (face, back, and leg). Understanding these baseline patterns is crucial for elucidating their role in the maintenance of the skin barrier and could provide insights into the regional pathophysiology of common dermatological conditions in dogs. Materials and MethodsAnimal modelThis study included 40 male and female stray dogs of different ages. The participants were divided into four groups according to animals (n=10, 5 males and 5 females): Group 1 (6 months–1 year); Group 2 (1–2 years), Group 3 (2–4 years), and Group 4 (4–6 years). The age estimation of dogs is mainly based on an examination of the teeth. All dogs in this study exhibited clinically normal skin and had no history of skin-related disorders. This study excluded dogs with ectoparasite infestations, dermatological allergies, bacterial or fungal infections, or skin cancers. Collection of skin samplesThe skin samples, measuring (1 × 1 cm), were taken from the face, back, and leg of each dog. After a 24-hour immersion in 10% neutral buffer formalin, the paraffin-embedded skin tissue samples were subjected to standard histopathologic and immunohistochemical analysis. For molecular analysis, fresh skin samples were kept in a refrigerator at −80°C. Evaluation of histomorphometric measurementSkin samples were sectioned to a thickness of 4 µm, deparaffinized using xylene, rehydrated in graded ethanol, and stained with hematoxylin and eosin (H&E) for standard histopathological evaluation, which included histomorphometric measurement of average apoptotic cells, mitotic cells, and epidermis thickness using specific tools. Apoptotic indexApoptotic cells have retracted and highly eosinophilic cytoplasm in tissue sections stained with H&E (De Schepop et al., 1996). The nuclear DNA first condenses at the nuclear membrane. Later, it forms clumps and often breaks up into uniformly dark, spherical nuclear fragments. Figure 1a–c examples of apoptotic cells. A conventional light microscope (Hitop, China) was used to count apoptotic cells in accordance with a strict technique that had been previously invented (De Schepop et al., 1996). In 10 fields of vision, the total number of apoptotic cells was systematically distributed over a 0.5 × 0.5 cm area. Apoptotic counts were quantified per mm² and subsequently analyzed statistically using GraphPad Prism 10 for Windows.
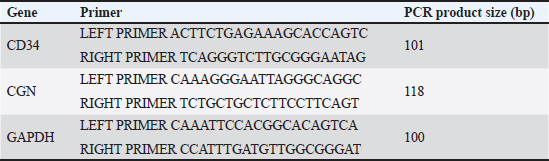
Fig. 1. Microscopic appearance of apoptotic cells (yellow arrows) within the epidermis of the back (a), face (b), and leg (c). MFs (black arrows): metaphase and telophase in the back (d), telophase in the face (e), and metaphase in the leg (f). Epidermal thickness measurements of the back (g), face (h), and leg (i) using H&E stain. Mitotic indexThe mitotic index is the ratio of the number of mitoses to the total number of interphase nuclei counted, usually assessed at 1,000× magnification. The mitotic index addresses the variability in cell size and High power field (HPF) (high power field) area (Fig. 1d–f).The mitotic cells or dividing cells were counted over 10 fields, or in 2.37 mm², which is the mitotic count/mitotic index, which was recommended to count both mitotic figure (MF) in an area of 2.37 mm². The total MF in 2.37 mm² is the Mitotic cell per HPF (Donovan et al., 2021). Then, statistical analysis was performed using GraphPad Prism. Figure 1 shows the different phases of MFs within the epidermis. Epidermal thickness assessmentEpidermal thickness (measured by µm) was assessed by measuring the total layers of the epidermis, nucleated epidermis, and stratum corneum thickness in individual healthy dogs. Epidermal thickness was measured in three variable-thickness randomly selected fields of each sample (AmscopeTM, Japan) to measure the epidermal thickness in all three different epidermal regions (Fig. 1g–i). The data were transformed to GraphPad Prism 10 for statistical analysis. Molecular analysisTotal RNA was extracted from the skin samples using the AddPrep Total RNA Extraction Kit (Daejeon, Republic of Korea) according to the manufacturer’s instructions (Addbio). Total RNA was extracted from tissue samples using a spin column extraction method based on a silica membrane. In brief, 25–100 mi of tissue was homogenized and lysed in lysis buffer supplemented with β-mercaptoethanol and proteinase K, followed by incubation at 56°C for 10 minutes. The clarified lysate was combined with binding buffer and absolute ethanol after centrifugation to promote RNA adsorption onto the silica membrane. The mixture was then transferred to spin columns and centrifuged to allow binding of RNA. The bound RNA was washed sequentially using two washing solutions to remove proteins and other contaminants. An on-column DNase I digestion step was performed at room temperature for 15 minutes to eliminate residual genomic DNA. Following additional washing steps and membrane drying, total RNA was eluted in 50–100 µl of RNase-free elution buffer. Purified RNA was immediately used or stored at −70°C until further analysis. Primer design and cDNA synthesisThe transcript sequences for CD34 and CGN were sourced from the canine genome transcript sequences available on NCBI (USA), specifically CD34 (accession no. NM_001003341.1), CGN (accession no. NM_001103217.1), and GAPDH (accession no. NM_001003142.2). Primers were designed using Primer3 software and subsequently verified through BLAST analysis for homologies. The primer sequences and anticipated product sizes are presented in Table 1. Table 1. Sequences and anticipated PCR product sizes of the qPCR primers.
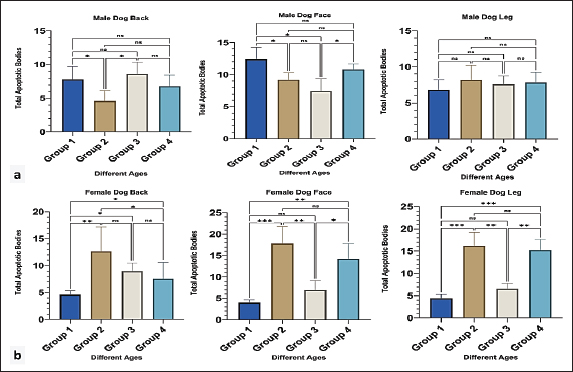
Quantitative polymerase chain reaction (qPCR)To detect mRNA expression, each sample for each gene was run in duplicate, and the average Ct value was calculated for all normal DNA samples. The 2^(-ΔΔCt) method was used to assess the relative fold change in gene expression. First, the ΔCt value was calculated for each sample by subtracting the Ct of the housekeeping gene from the Ct of the target gene. The data was normalised by averaging the ΔCt values from all normal samples to get a pooled ΔCt value. The ΔΔCt value was determined by subtracting the pooled normal ΔCt from the ΔCt of each sample. The relative fold change in gene expression was calculated using the formula 2^(-ΔΔCt), facilitating a comprehensive comparison of gene expression levels among all samples (Livak and Schmittgen, 2001). The Green RT-qPCR Master Mix was used for cDNA synthesis and PCR amplification. The protocol was as follows: 50°C for 20 minutes, 95°C for 5 minutes, followed by 40 cycles of 95°C for 20 seconds, 60°C for 40 seconds, and 72°C for 30 seconds. Immunohistochemistry interpretationTissue sections were subjected to immunohistochemical processing in a microwave oven with 10 ml of citrate buffer (pH 6.0) heated to 95°C–100°C for 20 minutes to retrieve antigens. A peroxidase block was applied for 15 minutes, followed by the blocking of non-specific bindings using 5% bovine serum and 0.1% Triton X-100 in Phosphate Buffered Saline (PBS). Subsequently, incubation was started with 1 hour of incubation with rabbit polyclonal antibodies against CGN (1:200, Biorbyt, USA) and CD34 (1:200, Biorbyt, USA) for 1 hour. After three washes in PBS, the sections were incubated with a biotinylated secondary antibody for 30 minutes and then treated with horseradish peroxidase-streptavidin (DAKO, Denmark) for 60 minutes. Following washing in PBS, the sections were exposed to a diaminobenzidine substrate-chromogen solution for 2–5 minutes at room temperature to visualize the reaction products (DAKO, Denmark). Finally, the sections were counterstained with hematoxylin, dehydrated as per the usual method, and mounted with the mounting medium before being coated with coverslips. Positive and negative control slides were prepared using normal human appendix and rat heart muscle, respectively. Positively stained cells in the epidermis of clinically normal skin were used to determine the location of proteins. Sections were examined, and the degree and intensity of positive immune cells (H score) were assessed using AHSQ image analysis software. The cytoplasm of immunopositive cells had brownish granules of CD34 and CGN, whereas the nuclei remained bluish and unstained. The intensity of CD34 and CGN staining was categorized as follows: weak (+1), weak-moderate (+2), moderate (+3), moderate-strong (+4), and strong (+5). Immunohistochemistry (IHC) staining of CD34 reveals the extent of positively stained keratinocytes in the epidermis and hair follicle bulges. CGN-stained keratinocytes of the epidermis were assessed using a grading scale: 0 for 0%–5% positive staining, 1 for 6%–20% positive staining, 2 for 21%–40% positive staining, 3 for 41%–65% positive staining, and 4 for >65% positive staining. A total staining score between 0 and 20 with an increased staining intensity was indicative of a positive reactivity extent (Hassan and Hassan, 2019). Statistical analysisData are presented as means ± standard errors (SE). Statistical significance between groups was determined using GraphPad Prism 10 (GraphPad Software, San Diego, CA). For normal distribution, the Shapiro test was used, the Pearson correlation was used for PCR data, and two-way MANOVA was employed for the apoptotic, mitotic counting, epidermal thickness, and immunohistochemical score. Gene expression data were obtained through correlation analyses of mRNA and protein levels using Pearson’s correlation test. p-values <0.05 are considered to be statistically significant. Ethical approvalAll animal procedures were conducted in accordance with the ethical guidelines established by Sulaimani University/College of Veterinary Medicine. Permission has been granted to the Animal Care and Use Committee (Kurdistan/Iraq) (VMUS.EC. 0305; December 2024). ResultsHistomorphometric analysis of apoptosis and mitosisIn male dogs, the apoptotic count in the back region significantly varied with age (p < 0.05), with the highest levels observed in Groups 3 and 1. In contrast, the facial region showed peak apoptotic counts in Groups 1 and 4. No significant age-related differences in apoptosis were detected in the leg region (Fig. 2a).
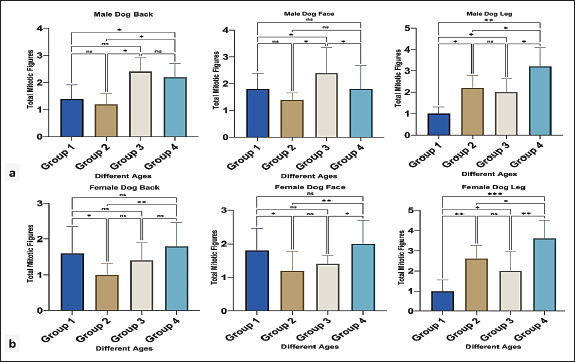
Fig. 2. Apoptotic body count in male (a) and female (b) dogs of different ages. Group 1 (6 month-1 year), Group 2 (1–2 years), Group 3 (2–4 years) and Group 4 (4–6 years). Data are mean ± SE; one-way ANOVA was used. Significance: (p ≤ 0.05), * (p ≤ 0.0332), ** (p ≤ 0.0021) and *** (p ≤ 0.0002). In all regions of female dogs, group 2 showed the highest number of apoptotic bodies with a clear significant difference (p < 0.05), followed by group 4 (Fig. 2b). MFs were observed in all different epidermal regions of both male and female dogs. For male groups generally in older ages (3 and 4), showing an increase in the number of MFs with a clear, significant difference (p < 0.05) particularly at back and leg regions compared with younger ages (Fig. 3a). Furthermore, in female dogs, the MF count increased in the youth and oldest groups in the back and face regions, with a significant difference (p < 0.05) among the other groups. However, in the leg region, a high number of mitotic counts was detected in groups 2 and 4 with a significant difference (p < 0.05), and the young one showed a high mitotic count (Fig. 3b).
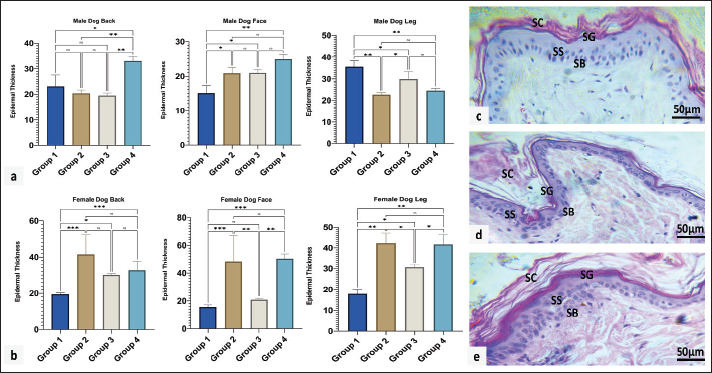
Fig. 3. Mitotic count in male (a) and female (b) dogs of different ages. Group 1 (6 month-1 year), Group 2 (1–2 years), Group 3 (2–4 years) and Group 4 (4–6 years). Data are mean ± SE; one-way ANOVA was used. Significance: (p ≤ 0.05), * (p ≤ 0.0332), ** (p ≤ 0.0021). Variations in epidermal thicknessSkin histologyThe skin of dogs showed a thin epidermis with few epidermal papillaes. The dermis is composed of papillary and reticular layers, where numerous compound hairs are found. A few sweat and sebaceous glands were found in association with hair follicles. The skin of all different regions (back, face, and leg) was composed of at least two to four well-defined nucleated epidermal layers. The canine skin was divided into four layers, including the stratum (s.) basale, s. spinosum, s. granulosum, and keratinized epidermis (SC). The dermis contained a matrix of connective tissue and epidermal appendages, such as hair follicles, sebaceous glands, apocrine glands, exocrine glands, and a few mononuclear cells (Fig. 4c–e)
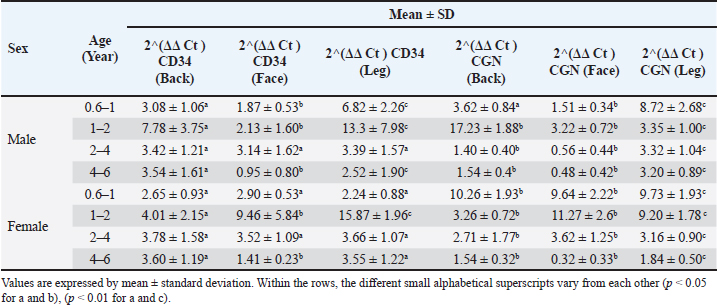
Fig. 4. Epidermal thickness in male (a) and female (b) dogs of different ages. Microscopic appearance of the skin and its four epidermal layers: stratum basale (SB), stratum spinosum (SS), stratum granulosum (SG), and stratum corneum (SC) in the back (c), face (d), and leg (e). H&E staining was performed. Group 1 (6 month-1 year), Group 2 (1–2 years), Group 3 (2–4 years) and Group 4 (4–6 years). Data are mean ± SE; one-way ANOVA was used. Significance: (p ≤ 0.05), * (p ≤ 0.0332), ** (p ≤ 0.0021) and *** (p ≤ 0.0002). In terms of epidermal thickness in the male dog, a significant increase in the thickness was detected in the oldest group compared to other groups (p < 0.05), and a non-gradual reduction was detected from the youth group toward advancing age (groups 2 and 3). In contrast, at the facial area, epidermis thickness was found to be at its peak in group 4, followed by groups 2 and 3, compared to the youth age, which revealed the least thickness. However, the highest thickness was observed in group 1. A significant decrease (p < 0.05) was observed in the thickness of the leg region, and group 2 showed the lowest thickness compared with the other groups (Fig. 4a). Epidermal thickness measurement in female dogs, in the back region group (1), represents the lowest thickness with a significant difference (p < 0.05), whereas group (2) showed the highest versus other groups with a significant difference. For the face region showing different levels of thickness among all ages, groups 2 and 4 showed the highest thickness with a significant difference (p < 0.05). Groups 2 and 4 demonstrated the thickest leg region compared with groups 1 and 3, with a significant difference (p < 0.05). In addition, group 1 showed the lowest thickness (Fig. 4b). Ct for qPCR gene expression in different locations among dogs of various ages in both sexesRegarding the male dogs in Table 2, in group one, the highest CD34 value was recorded in the leg (6.82 ± 2.26), significantly (p < 0.05), followed by the back and face. Also consider the CGN, the maximum ratio seen in the leg significantly versus the back and face. In group two, the highest CD34 value was found in the leg (13.3 ± 7.98), significantly (p < 0.05), while the lowest was seen in the face (2.13 ± 1.60). The CGN maximum degree was seen in the back, significantly versus from the face and leg. In group 3, the CD34 values were similar in different locations versus the CGN gene, which significantly (p < 0.05) increased in the leg (3.32 ± 1.04), followed by the back and face. In the aged group, the CD34 gene was raised (3.54 ± 1.61) in the back region significantly (p < 0.05) compared with that in the leg and face. The CGN value (3.20 ± 0.89) increased significantly (p < 0.05) in the leg, followed by the back and face. Table 2. The Mean ± SD of Ct for qPCR of CD34 and cingluin in different locations among various aged dogs of both sexes.
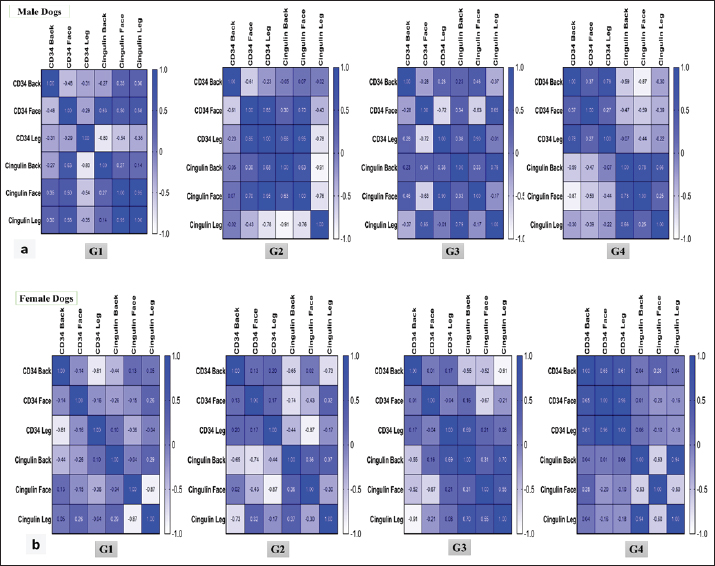
In Table 2, for the female group, the CD34 gene in group one was expressed at the same level, whereas the CGN gene was expressed at the maximum level in the back (10.26 ± 1.93), then in the face and leg significantly (p < 0.05). Regarding group two, CD34 was detected at a maximum level in the leg versus the face and back versus the CGN, with the highest ratio (11.27 ± 2.6) being seen in the face significantly (p < 0.05). The CD34 and CGN values in group three did not show any difference, except that the back region (2.71 ± 1.77) for CGN decreased significantly (p < 0.05). In the aged group, both genes decreased significantly (p < 0.05) in the face region (1.41 ± 0.23) for CD34 and for CGN (0.32 ± 0.33). Correlation between CD34 and CGN gene expression in the same skin regions in different sexesFor male dogs, the correlation between CD34 and CGN showed a weak negative correlation in the back and leg in group one versus the facial region, in which a weak positive correlation was observed. In group two, the back and leg expression correlation between both genes appeared to be negatively correlated, particularly a strong negative correlation in the leg region, whereas a strong positive correlation was observed in the face region. The correlation between both genes in group 3 was detected as poor positive in the back, strong negative in the face, and poor negative in the leg. In group 4, the expression correlation between CD34 and CGN was negative in all three skin regions (Fig. 5a).
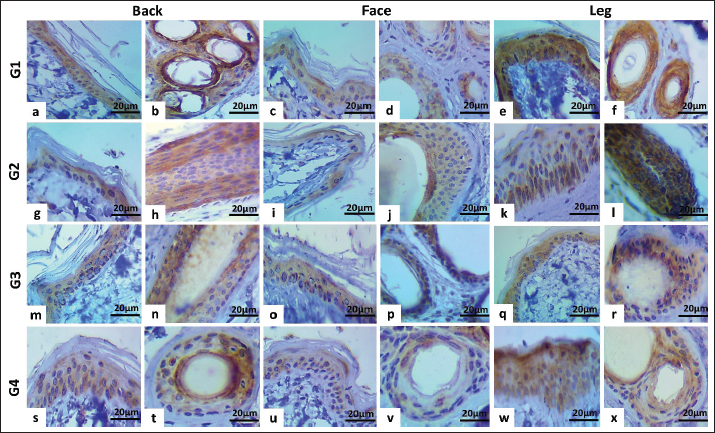
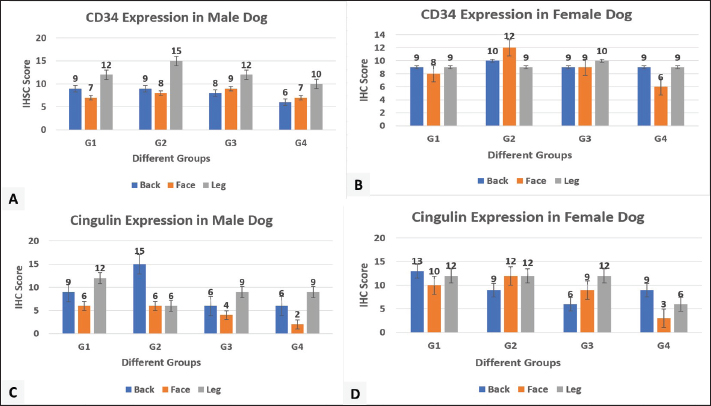
Fig. 5. Heat map Pearson’s correlation of mRNA expression levels of CD34 and CGN genes in three regions of different sexes and ages dogs. In female dogs, the correlation in groups 1 and 2 was negative in all regions for both CD34 and CGN genes. In group 3, a negative correlation was observed in the back and face regions, and a poor positive correlation was observed for the leg region. In group 4, the correlation between two genes was positive in the back and negative in the face and leg (Fig. 5b). Localization of proteins by immunohistochemistryImmunostaining of the skin for CD34 protein expression was localized in the keratinocytes of the epidermis and the hair follicle bulge. In male dogs, the immunoreactivity in group one showed an increase in the intensity and proportion of IHC-positive cells in the leg (Fig. 6e and f), followed by the back region (Fig. 6a and b), while weak expression was seen in the face region (Fig. 6c and d). Thus, the peak score was observed in the leg, followed by the back and face (Fig. 8a). Compared with group two, the immunoreactivity of this factor reached the peak score, particularly in the leg and then back regions (Figs. 6g–l and 8a), the expression at the face increased to weak-moderate expression (Fig. 6i and j) versus group three, and the same immunoreactivity level of this protein was observed to a moderate degree and scored as 9 (Fig. 6m–r). The aged group (group 4) exhibited a moderate expression of CD34 in the leg compared with the back and face regions (Fig. 6s–x).
Fig. 6. Immunohistochemical staining of CD34 cytoplasmic expression in the epidermis and hair follicles of different male’s aged dogs: a and b: Moderate positive staining (score 9, 65%). c and d: Weak-moderate positive staining (score 6, 60%). e and f: Moderate-strong positive staining (score 12, 65%). g and h: Moderate positivity (score 9, 65%). i and j: weak-to-moderate positive staining (score, 6%; 50%). k and l: strong positive staining (score, 15%; 60%). m–r: moderate positive staining (score 9, 65%). s and t: weak-to-moderate positive staining (score, 55%; score, 6%). u and v: Weak-moderate positive staining (score 6, 45%). w and x: Moderate positive staining (score 9, 45%). In the female group, the CD 34 expression in group one was moderately intense in all regions, with a different proportion versus group two, with the highest expression seen in the face region, followed by the back and leg regions (Fig. 8b). In group 3, similar immunohistochemical patterns were found. The aged group exhibited moderate expression of CD34 in the back and leg compared with the face, which showed weak-moderate expression (Fig. 8b).
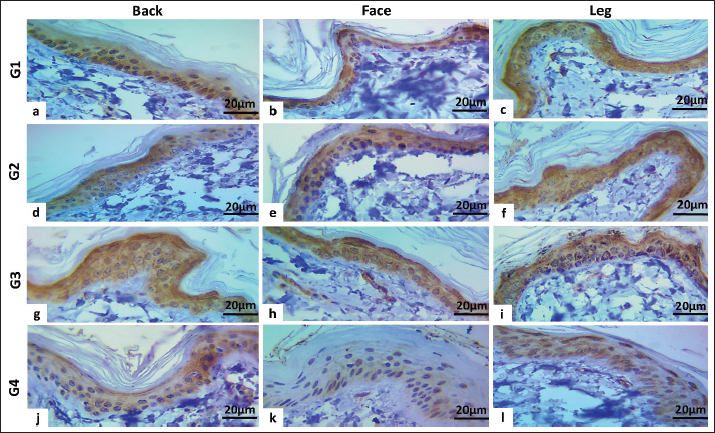
Fig. 8. Immunohistochemical scoring column charts. A and B: CD34 expression in male and female dogs. C and D: CGN expression in male and female dogs. CGN is expressed cytoplasmically in the keratinocytes of the epidermis and varies in degree according to sex and age. In male dogs, group one showed the highest score in the leg region, followed by the back, while the least expression was seen in the face region (Fig. 8c). In group two, the highest expression was seen in the back region (Fig. 8c). In group three, the CGN expression showed the maximum level in the leg and the lowest degree in the face region (Figs. 7g–i and 8c). Group four had the same pattern of CGN expression in the back (weak-moderate) and face (weak) as the leg region in which the expression level was high (Fig. 8c).
Fig. 7. Immunohistochemical staining of cytoplasmic expression of CGN in the epidermis of aged female dogs: a–c: Moderate-strong positive staining (score 12, 65%). d: Moderate positive staining (score 9, 60%). e and f: Moderate-strong positive staining (score 12, 65%). G–i: Moderate positive staining (score, 9; 60%). j: Weak-moderate positive staining (score=6, 55%). k: Weak positive staining (score 2, 40%). l: Weak-moderate positive staining (score=6.0, 50%). The CGN expression in female dogs was revealed; in group one, at a different locations high expression was seen (Figs. 7a–c and 8d). In group two, the peak expression level was observed in the face and legs (Figs. 7d–f and 8d) versus group three, the same pattern of expression was observed, which showed the maximum level in the leg and the lowest degree in the face region (Figs. 7g–i and 8d). The aged groups had the same pattern of CGN expression in the back (weak-moderate) and face (weak) as the leg region in which high level seen (Figs. 7j–l and 8c and d). DiscussionThe skin serves as the epithelial surface at the forefront of host defense due to its distinct anatomical position, protecting and minimizing damage from both routine and extreme environmental factors. Diseased skin typically exhibits diminished barrier function. Understanding the organization and barrier function of diseased skin requires an investigation of the histologic structure of TJs in healthy skin and the interactions between keratinocytes and existing stem cells. As the basis of the previous study, the current study was conducted using histomorphometric measurement to assess the average number of apoptotic cells, mitotic cells, and epidermal thickness of three skin regions among four different ages of male and female dogs, in addition to immunohistochemical localization and gene expression of the CGN as an epidermal TJ protein and CD34 as a stem cell. To the best of our knowledge, this is one of the first studies in veterinary medicine to be carried out in this field in our region and country (Iraq). The results obtained in this study are for all ages of male dogs; the total apoptotic body count generally showed significant differences in the young (under 1 year) and oldest group (4–6 years) in the back and face, but in the leg, the outcome was non-significant, while the MF count mostly revealed significant differences in each skin area, especially in older dogs, particularly in the back and leg regions. In the case of epidermal thickness, the noteworthy thickness was clear mainly among the youngest and oldest male dogs. The data is similar to the results that proved that the balance between the processes of cell division and programed cell death controls the number of cells and preserves proper epidermal thickness (Raj et al., 2006). In addition, Bowen et al. (2003) showed that apoptosis plays a vital role in skin homeostasis. Apoptotic cell death is essential for the development of the stratum corneum and for maintaining the natural balance of keratinocyte proliferation (Bowen et al., 2003). According to available evidence, apoptotic cell counts can dramatically increase throughout normal growth and aging, as well as during disease (Elmore, 2007). This is an explanation for why the number increased mostly in the young group, which is related to growing up, while in the oldest group, it is also a normal physiological mechanism that increases with advancing age. The comprehensive impact of apoptosis on disease pathophysiology makes therapeutic intervention possible at a variety of checkpoints. The present data, in all regions of female dogs, aged 1–2 years, showed the highest number of apoptotic bodies count with a clear, significant difference. Furthermore, the MF count showed a significant increase in the youth and oldest groups in the back and face regions. In line with previous data, the uptake of these apoptotic bodies can deliver mitogenic (proliferation-stimulating) signals, such as Wnt signaling, which encourages the proliferation of healthy stem cells to maintain tissue numbers (Brock et al., 2019). In addition, this process of apoptotic body engulfment provides a regulatory mechanism that links cell death and division, helping to maintain the overall population of stem cells and contributing to epithelial tissue homeostasis (Huang et al., 2011). Regarding epidermal thickness in female groups, at all regions, the groups of (1–2 and 4–6 years) represent the highest thickness significantly. This is in agreement with the young group that had the thinnest epidermis, while in disagreement with groups 2 and 4 that had the thickest epidermis. A study demonstrated that promoting apoptosis can lead to thinning of the epidermis in the developing epidermis, suggesting a direct link between cell death and the overall thickness of the tissue (Soffer et al., 2022). Variations in apoptotic, mitotic, and epidermal thickness in normal skin remain inadequately understood, with limited information available. Factors such as age, location, genetic predispositions, and environmental conditions significantly influence the balance between cell division and death, ultimately affecting epidermal thickness. The investigation of mRNA levels in canine skin supports earlier findings that CD34 is present in canine skin (Pascucci et al., 2006; Kobayashi et al., 2009; Brachelente et al., 2013). This study presents the first report on the mRNA levels of CGN in the epidermis of stray dogs. Real-time RT-PCR was used to assess and compare the transcription levels of the relevant genes. Our data concerning the gene expression of CD34 and CGN in all skin areas in different ages showed various achievements, which explained the change in gene expression levels with age, as demonstrated in a previous study, which was carried out on skin and other tissues of different-aged individuals (Glass et al., 2013) in which has showing that many genes exhibit age-related expression changes in skin. This variability is related to the finding that epidermal homeostasis relies on keratinocyte stem cells, which maintain the ability to divide asymmetrically and detach from the basement membrane for subsequent terminal differentiation (Ghadially, 2012). In addition to the anatomical and histological differences in skin structure across various regions, attributed to the varying thickness of the stratum corneum, research has indicated notable differences in gene expression and immune environments between areas such as the scalp and other skin regions. This highlights region-specific expression patterns of genes related to skin function and immunity (Béke et al., 2018). The correlation between the expression of both genes was negative in most groups of male and female dogs within the same epidermal skin region. This research strengthens the notion that TJ components possess a common capacity for preventing cell division (Capaldo et al., 2011; Nava et al., 2011). An increase in cellular CGN levels in differentiating cells is one of the various regulatory mechanisms that govern the biogenesis of epithelial tissue (Bordin et al., 2004; Guillemot et al., 2004), through a mechanism that demonstrated CGN’s involvement in cell proliferation and migration via its interaction with microtubule-associated small GTPase activators of RhoA, including the guanine nucleotide exchange factor H1 (GEF-H1) (Aijaz et al., 2005). CGN depletion leads to enhanced cell proliferation through a GEF-H1 and RhoA-dependent mechanism (Guillemot and Citi, 2006; González-Mariscal et al., 2014). In the context of CD34 localization and expression, immunohistochemical staining of canine skin sections with the santi-CD34 antibody demonstrated a cytoplasmic-to-membranous signal in the outer root sheath cells of both primary and secondary hair follicles, whereas the basal membrane of the outer root sheath keratinocytes was CD34-negative (Gerhards et al., 2016), which partly, in relation to our finding showed that CD34-positive expression was detected in hair follicles and basal cell layer of epidermis as well. Consistent with a previous study (Roussel et al., 2014), the authors established the most effective immunoenzymatic method for labeling TJ proteins in canine epidermis in addition to identifying the distribution of TJ proteins in the epidermis of healthy dogs with no skin problems. The finding of CGN in the dog epidermis in this study is consistent with that in endothelial cells by Schossleitner et al. (2016) and many different types of epithelial cells (Citi et al., 1988), where CGN localizes to the TJ. The immunostaining interpretation of CD34 stem cells and CGN in the current study revealed that the peak immunoreactivity scores in groups 1–3 were predominantly observed in the leg, followed by the back and face. This regional protein expression hierarchy (leg > back > face) may reflect differences in local biomechanical demands or regenerative needs. The skin of the distal limbs is subject to constant mechanical stress and potential injury, possibly necessitating a more robust stem cell reservoir and junctional integrity compared to the facial region. Similar to previous studies, increased signals from apoptotic bodies stimulate the proliferation of neighboring healthy stem cells, thereby contributing to the maintenance and repair of epithelial tissues. These cellular behaviors are conserved across various epithelial types; therefore, these studies are expected to yield significant insights into the mechanisms regulating stem cells, as demonstrated in zebrafish (Brock et al., 2019). Our explanation for this diversity between leg and back than face is that the skin of the leg is subject to constant irritation and potential injury, possibly necessitating a more healthy stem cell reservoir and junctional integrity compared to the facial region. Additionally, the leg and back have more epidermal thickness and hair follicle density compared to the face, which means more stem cell niche that increase the expression of CD34 in the mentioned locations. The aged group in both sexes exhibited moderate-weak expression of CD34 and CGN in the leg compared with the back and face regions. In accordance with a previous study, the proliferation capacity of stem cells declines with age (Margiana et al., 2022). According to our research, stem cells and intercellular junctions have a positive relationship, which has been supported by other studies. Cell junctions, particularly adherens junctions, regulate tissue maintenance and stem cell differentiation by securing stem cells to their niches, directing cell division orientation, and organizing the surrounding environment. These junctions combine signaling pathways with mechanical cues to maintain stem cell quiescence and establish a balance between self-renewal and differentiation in response to niche interactions (Trosko, 2003; Wuchter et al., 2006). Contrary to earlier findings that gap junction communication was limited or absent in the epidermis of mice with stem cells, the majority of the slowly cycling cells were label-retaining cells (Matic et al., 2002). The integrative hypothesis offers novel approaches for addressing skin diseases, especially atopic dermatitis, by emphasizing CD34 gene expression modulation and gap junctional intercellular communication. According to this theory, cell junctions control stem cell differentiation by anchoring stem cells to their niches and increasing the orientation of cell division, which is why the apoptotic count and MF with epidermal thickness increased in our study compared to the face that was associated with higher CGN and CD34 expression. ConclusionThe results confirmed that the increased number of apoptotic bodies correlated with epidermis thickness homeostasis in both sexes, particularly in the face and back region, especially in young aged dogs due to the significant impact of mitotic bodies. This research presents the maximum expression and negative correlation of CD34 and CGN proteins in the leg region, while the face had the least expression, which explained the low degree of regenerative medicine and increased the risk for dermatitis on the face than other locations. AcknowledgmentsThe University of Sulaimani’s College of Veterinary Medicine, Sulaymapaniyah, Iraq, supported this study. No agencies or organizations are involved in this study. Conflicts of interestThe authors have no conflicts of interest to declare. FundingNo funding is available for this project. Authors’ contributionsSSS with SMAH was used to design the study. SSS data analysis, SSS, and SMAH wrote the manuscript. The manuscript revision done by SSS and SMAH. All authors have read, corrected, and approved the final manuscript. Data availabilityThis article contains all the data created or examined in this investigation. ReferencesAgner, T. 2016. Skin barrier function. Curr. Problems. Dermatol. 49. Aijaz, S., D’Atri, F., Citi, S., Balda, M.S. and Matter, K. 2005. GEF-H1 binding to the tight junction-associated adaptor cingulin inhibits Rho signaling and G1/S phase transition. Develop. Cells. 8(5), 90–102; doi:10.1016/j.devcel.2005.03.003 Bäsler, K., Bergmann, S., Heisig, M., Naegel, A., Zorn-Kruppa, M. and Brandner, J.M. 2016. Role of tight junctions in skin barrier function and dermal absorption. J. Control. Release 242, 777–786; doi:10.1016/j.jconrel.2016.08.007 Béke, G., Dajnoki, Z., Kapitány, A., Gáspár, K., Medgyesi, B., Póliska, S., Hendrik, Z., Péter, Z., Törocsik, D., Bíró, T. and Szegedi, A. 2018. Immunotopographical differences in human skin. Front. Immunol. 9, 105–118; doi:10.3389/fimmu.2018.00424 Betanzos, A., Huerta, M., Lopez-Bayghen, E., Azuara, E., Amerena, J. and González-Mariscal, L. 2004. Tight junction protein ZO-2 associates with Jun, Fos, and C/EBP transcription factors in epithelial cells. Exp. Cell. Res. 292(1), 1-15; doi:10.1016/j.yexcr.2003.08.007 Blanpain, C. and Fuchs, E. 2006. Epidermal skin stem cells. Annu. Rev. Cell Develop. Biol. 22, 51–66; doi:10.1146/annurev.cellbio.22.010305.104357 Bordin, M., D’Atri, F., Guillemot, L. and Citi, S. 2004. Histone deacetylase inhibitors upregulate tight junction protein expression. Mol. Cancer Res. 2(12), 339–373; doi:10.1158/1541-7786.692.2.12 Bowen, A.R., Hanks, A.N., Allen, S.M., Alexander, A., Diedrich, M.J. and Grossman, D. 2003. Apoptosis regulators and responses in human melanocytic and keratinocytic cells. J. Invest. Dermatol. 120(1), 692–701; doi:10.1046/j.1523-1747.2003.12010.x Brachelente, C., Porcellato, I., Sforna, M., Lepri, E., Mechelli, L. and Bongiovanni, L. 2013. Contribution of stem cells to epidermal and hair follicle tumors in dogs. Vet. Dermatol. 24(1), 48–55; doi:10.1111/j.1365-3164.2012.01101.x Brock, C.K., Wallin, S.T., Ruiz, O.E., Samms, K.M., Mandal, A., Sumner, E.A. and Eisenhoffer, G.T. 2019. Stem cell proliferation is induced by apoptotic bodies from dying cells during the maintenance of epithelial tissue. Nature. Commun. 10(1), 188–e41; doi:10.1038/s41467-019-09010-6 Brunet, A., Goodell, M.A. and Rando, T.A. 2023. Aging and rejuvenation of tissue stem cells and their niches. Nature. Rev. Mol. Cell. Biol. 24(1), 1–11; doi:10.1038/s41580-022-00510-w Capaldo, C.T., Koch, S., Kwon, M., Laur, O., Parkos, C.A. and Nusrat, A. 2011. Zonula occludens-3 regulates cyclin D1-dependent cell proliferation. Mol. Biol. Cell 22(10), 45–62. Citi, S., Sabanay, H., Jakes, R., Geiger, B. and Kendrick-Jones, J. 1988. Cingulin, a new peripheral component of tight junctions. Nature 6170(6170), 333; doi:10.1038/333272a0 Citi, S., Sabanay, H., Kendrick-Jones, J. and Geiger, B. 1989. Cingulin: characterization and localization. J. Cell Sci. 93(1), 272–276; doi:10.1242/jcs.93.1.107 Citi, S., Spadaro, D., Schneider, Y., Stutz, J. and Pulimeno, P. 2011. Regulation of small GTPases at epithelial cell-cell junctions. Mol. Membrane Biol. 28(7–8), 272–276; doi:10.3109/09687688.2011.603101 De Benedetto, A., Rafaels, N.M., McGirt, L.Y., Ivanov, A.I., Georas, S.N., Cheadle, C., Berger, A.E., Zhang, K., Vidyasagar, S., Yoshida, T., Boguniewicz, M., Hata, T., Schneider, L.C., Hanifin, J.M., Gallo, R.L., Novak, N., Weidinger, S., Beaty, T.H., Leung, D.Y.M. and Beck, L.A. 2011. Tight junction defects in atopic dermatitis patients. J. Allergy Clin. Immunol. 127(3), 427–444; doi:10.1016/j.jaci.2010.10.018 De Schepop, H., De Jong, J.S., Van Diest, P.J. and Baak, J.P.A. 1996. Apoptotic cell counting: a methodological study in invasive breast cancer. J. Clin. Pathol-Clin. Mol. Pathol. 49(4), 773–786.e7; doi:10.1136/mp.49.4.m214 Donovan, T.A., Moore, F.M., Bertram, C.A., Luong, R., Bolfa, P., Klopfleisch, R., Tvedten, H., Salas, E.N., Whitley, D.B., Aubreville, M. and Meuten, D.J. 2021. Mitotic figures—normal, atypical, and imposters: identification guide in veterinary pathology. J. Physiol. Med. 58(2), 214–217; doi: 10.1177/0300985820980049 Egawa, G. and Kabashima, K. 2016. Multifactorial skin barrier deficiency and atopic dermatitis: essential topics to prevent atopic dermatitis. J. Allergy Clin. Immunol. 138(2), 243–257; doi:10.1016/j.jaci.2016.06.002 Elmore, S. 2007. Apoptosis: a review of programed cell death. Toxicol. Pathol. 35(4), 350–358; doi:10.1080/01926230701320337 Furuse, M. 2010. Molecular basis of the tight junction core structure. Cold. Spring. Harbor. Perspect. Biol. 2(1), 495–516 doi:10.1101/cshperspect.a002907 Gerhards, N.M., Sayar, B.S., Origgi, F.C., Galichet, A., Müller, E.J., Welle, M.M. and Wiener, D.J. 2016. Expression of stem cell-associated markers in canine hair follicles. J. Histochem. Cytochem. 64(3), 1–14; doi:10.1369/0022155415627679 Ghadially, R. 2012. Twenty five years of epidermal stem cell research. J. Invest. Dermatol. 132(3 PART 2), 190–204; doi:10.1038/jid.2011.434 Glass, D., Viñuela, A., Davies, M.N., Ramasamy, A., Parts, L., Knowles, D., Brown, A.A., Hedman., Small, K.S., Buil, A., Grundberg, E., Nica, A.C., Meglio P Di., Nestle, F.O., Ryten, M., Durbin, R., McCarthy, M.I., Deloukas, P., Dermitzakis, E.T. and Spector, T.D. 2013. Gene expression changes with age in the skin, adipose tissue, blood, and brain. Genome Biol. 14(7), doi:10.1186/gb-2013-14-7-r75 González-Mariscal, L., Domínguez-Calderón A, Raya-Sandino A, Ortega-Olvera JM, Vargas-Sierra, O. and Martínez-Revollar G. 2014. Tight junctions and gene expression regulation. In Seminars in cell and developmental biology. vol. 36 213–223; doi: 10.1016/j.semcdb.2014.08.009 Guillemot, L. and Citi, S. 2006. Cingulin regulates claudin-2 expression and cell proliferation through RhoA, a small GTPase. Mol. Biol. Cell. 17(8) , 3569–3577;. Guillemot, L., Hammar, E., Kaister, C., Ritz, J., Caille, D., Jond, L., Bauer, C., Meda, P. and Citi, S. 2004. Cingulin gene disruption does not prevent tight junction formation but alters gene expression. J. Cell. Sci. 117(22), 5245–5256; doi:10.1242/jcs.01399 Guillemot, L., Paschoud, S., Pulimeno, P., Foglia, A. and Citi, S. 2008. Cytoplasmic plaque of tight junctions: a scaffolding and signaling center. Biochim. Biophys. Acta-Biomembranes. 1778(3), 601–613; doi:10.1016/j.bbamem.2007.09.032 Hadj-Rabia, S., Brideau, G., Al-Sarraj, Y., Maroun, R.C., Figueres, M.L., Leclerc-Mercier, S., Olinger, E., Baron, S., Chaussain, C., Nochy, D., Taha, R.Z., Knebelmann, B., Joshi, V., Curmi, P.A., Kambouris, M., Vargas-Poussou, R., Bodemer, C., Devuyst, O., Houillier, P. and El-Shanti, H. 2018. Multiplex epithelium dysfunction due to CLDN10 mutation: hELIX syndrome. Genet. Med. 20(2), doi:10.1038/gim.2017.71 Hassan, S.M.A. and Hassan, A.H. 2019. Effect of Shogaol on the expression of intestinal stem cell markers in BALB/c mice with experimentally induced colitis. Anal. Cell. Pathol. 2019 , 190–201; doi:10.1155/2019/5134156 Hsu, Y.C., Li, L. and Fuchs, E. 2014. Transit-amplifying cells orchestrate stem cell activity and tissue regeneration. Cell 157(4), 1–10; doi:10.1016/j.cell.2014.02.057 Huang, Q., Li, F., Liu, X., Li, W., Shi, W., Liu, F.F., O’Sullivan, B., He, Z., Peng, Y., Tan, A.C., Zhou, L., Shen, J., Han, G., Wang, X.J., Thorburn, J., Thorburn, A., Jimeno, A., Raben, D., Bedford, J.S. and Li, C.Y. 2011. Caspase 3-mediated stimulation of tumor cell repopulation during radiotherapy for cancer. Nature Med. 17(7), 935–949.; doi:10.1038/nm.2385 Islas, S., Vega, J., Ponce, L. and González-Mariscal, L. 2002. Tight junction protein ZO-2 localization in epithelial cells. Exp. Cell. Res. 274(1), 860–866; doi:10.1006/excr.2001.5457 Kobayashi, T., Iwasaki, T., Amagai, M. and Ohyama, M. 2010. Candidate canine follicle stem cells reside in the bulge and share characteristic features with human bulge cells. J. Invest. Dermatol. 130(8), 797–810; doi:10.1038/jid.2010.68 Kobayashi, T., Shimizu, A., Nishifuji, K., Amagai, M., Iwasaki, T. and Ohyama, M. 2009. Canine hair-follicle keratinocytes enriched with bulge cells have the highly proliferative stem cell characteristic. Vet. Dermatol. 20(5–6), 1988–1995; doi:10.1111/j.1365-3164.2009.00815.x Livak, K.J. and Schmittgen, T.D. 2001. Analysis of relative gene expression data using real-time quantitative polymerase chain reaction and the 2(-Delta Delta C(T)) method. Methods 25(4), 338–346. Margiana, R., Markov, A., Zekiy, A.O., Hamza, M.U., Al-Dabbagh, K.A., Al-Zubaidi, S.H., Hameed, N.M., Ahmad, I., Sivaraman, R., Kzar, H.H., Al-Gazally, M.E., Mustafa, Y.F. and Siahmansouri, H. 2022. Clinical application of mesenchymal stem cells in regenerative medicine: a narrative review. Stem Cell Res. Therapy 13(1), 402–408; doi:10.1186/s13287-022-03054-0 Matic, M., Howard Evans, W., Brink, P.R. and Simon, M. 2002. Epidermal stem cells do not communicate via gap junctions. J. Invest. Dermatol. 118(1), 1–22; doi:10.1046/j.0022-202x.2001.01623.x Matter, K. and Balda, M.S. 2014. SnapShot image: epithelial tight junctions. Cell 157(4), 992.e1; doi:10.1016/j.cell.2014.04.027 Nava, P., Capaldo, C.T., Koch, S., Kolegraff, K., Rankin, C.R., Farkas, A.E., Feasel, M.E., Li, L., Addis, C., Parkos, C.A. and Nusrat, A. 2011. JAM-A regulates epithelial proliferation through Akt/β-catenin signaling. EMBO. Rep. 12(4), 1–110; doi:10.1038/embor.2011.16 Pascucci, L., Mercati, F., Gargiulo, A.M., Pedini, V., Sorbolini, S. and Ceccarelli, P. 2006. CD34 glycoprotein identifies putative stem cells located in the isthmic region of canine hair follicles. Vet. Dermatol. 17(4), 314–320; doi:10.1111/j.1365-3164.2006.00527.x Purba, T.S., Haslam, I.S., Poblet, E., Jiménez, F., Gandarillas, A., Izeta, A. and Paus, R. 2014. Human epithelial hair follicle stem cells and their progeny: current state of knowledge, the widening gap in translational research and future challenges. BioEssays 36(5), 244–251; doi:10.1002/bies.201300166 Raj, D., Brash, D.E. and Grossman, D. 2006. Keratinocyte apoptosis during epidermal development and disease. J. Invest. Dermatol. 126(2), 243–257; doi:10.1038/sj.jid.5700008 Rompolas, P. and Greco. 2014. Stem cell dynamics in the HFN. Seminars. Cell. Develop. Biol. 25–26, 25; doi:10.1016/j.semcdb.2013.12.005 Roussel, A.J., Knol, A.C., Bourdeau, P.J. and Bruet, V. 2014. Optimization of an immunohistochemical method to assess tight junction protein distribution in canine epidermis and adnexae. J. Comparative Pathol. 150(1), 35–46; doi:10.1016/j.jcpa.2013.06.008 Schossleitner, K., Rauscher, S., Gröger, M., Friedl, H.P., Finsterwalder, R., Habertheuer, A., Sibilia, M., Brostjan, C., Födinger, D., Citi, S. and Petzelbauer, P. 2016. Evidence that cingulin regulates endothelial barrier function in vitro and in vivo. Arterioscler. Thromb. Vasc. Biol. 36(4), 307–332; doi:10.1161/ATVBAHA.115.307032 Soffer, A., Mahly, A., Padmanabhan, K., Cohen, J., Adir, O., Loushi, E., Fuchs, Y., Williams, S.E. and Luxenburg, C. 2022. Apoptosis and tissue thinning contribute to symmetric cell division in the developing mouse epidermis in a nonautonomous manner. PLos Biol. 20(8), 20; doi:10.1371/journal.pbio.3001756 Terry, S., Nie, M., Matter, K. and Balda, M.S. 2010. Rho signaling and tight junction function. Physiology 25(1), doi:10.1152/physiol.00034.2009 Theerawatanasirikul, S., Suriyaphol, G., Thanawongnuwech, R. and Sailasuta, A.. 2012. Histologic morphology and expression of involucrin, filaggrin, and keratin in normal canine skin from dogs of different breeds and coat types. J. Vet. Sci. 13(2), 16–24; doi:10.4142/jvs.2012.13.2.163 Trosko, J.E. 2003. Role of stem cells and gap junctional intercellular communication in carcinogenesis. J. Biochem. Mol. Biol. 36(1), 163–170; doi:10.5483/bmbrep.2003.36.1.043 Wong, R.S., -Y.., Ng, S. and Brianna , B. H. Goh. 2025. The role of mesenchymal stem cells in skin aging and damage: insights from recent preclinical and clinical studies. Curr. Stem Cell Rep. 11(1), 43–48; Wuchter, P., Saffrich, R., Straub, B., Boda-Heggemann, J., Miesala, K., Diehlmann, A., Wagner, W., Seckinger, A., Krause, U., Franke, W.W. and Ho, A.D. 2006. Characterization of intercellular junctional complexes between human hematopoietic and mesenchymal stem cells. Blood 108(11), 1390–1396; doi:10.1182/blood.v108.11.1396.1396 Zhao, X., Zeng, H., Lei, L., Tong, X., Yang, L., Yang, Y., Li, S., Zhou, Y., Luo, L., Huang, J., Xiao, R., Chen, J. and Zeng, Q. 2021. Tight junctions and their regulation by non-coding RNAs (NCRNAs). Int. J. Biol. Sci. 17(3), 712–727; doi:10.7150/ijbs.45885 | ||
| How to Cite this Article |
| Pubmed Style Shilan Salih Sofi and Snur M. A. Hassan. Histochemical study of cingulin and CD34 in the skin of a stray Dog. Open Vet. J.. 2026; 16(2): 920-933. doi:10.5455/OVJ.2026.v16.i2.14 Web Style Shilan Salih Sofi and Snur M. A. Hassan. Histochemical study of cingulin and CD34 in the skin of a stray Dog. https://www.openveterinaryjournal.com/?mno=287915 [Access: February 27, 2026]. doi:10.5455/OVJ.2026.v16.i2.14 AMA (American Medical Association) Style Shilan Salih Sofi and Snur M. A. Hassan. Histochemical study of cingulin and CD34 in the skin of a stray Dog. Open Vet. J.. 2026; 16(2): 920-933. doi:10.5455/OVJ.2026.v16.i2.14 Vancouver/ICMJE Style Shilan Salih Sofi and Snur M. A. Hassan. Histochemical study of cingulin and CD34 in the skin of a stray Dog. Open Vet. J.. (2026), [cited February 27, 2026]; 16(2): 920-933. doi:10.5455/OVJ.2026.v16.i2.14 Harvard Style Shilan Salih Sofi and Snur M. A. Hassan (2026) Histochemical study of cingulin and CD34 in the skin of a stray Dog. Open Vet. J., 16 (2), 920-933. doi:10.5455/OVJ.2026.v16.i2.14 Turabian Style Shilan Salih Sofi and Snur M. A. Hassan. 2026. Histochemical study of cingulin and CD34 in the skin of a stray Dog. Open Veterinary Journal, 16 (2), 920-933. doi:10.5455/OVJ.2026.v16.i2.14 Chicago Style Shilan Salih Sofi and Snur M. A. Hassan. "Histochemical study of cingulin and CD34 in the skin of a stray Dog." Open Veterinary Journal 16 (2026), 920-933. doi:10.5455/OVJ.2026.v16.i2.14 MLA (The Modern Language Association) Style Shilan Salih Sofi and Snur M. A. Hassan. "Histochemical study of cingulin and CD34 in the skin of a stray Dog." Open Veterinary Journal 16.2 (2026), 920-933. Print. doi:10.5455/OVJ.2026.v16.i2.14 APA (American Psychological Association) Style Shilan Salih Sofi and Snur M. A. Hassan (2026) Histochemical study of cingulin and CD34 in the skin of a stray Dog. Open Veterinary Journal, 16 (2), 920-933. doi:10.5455/OVJ.2026.v16.i2.14 |

