


| Research Article | ||
Open Vet. J.. 2025; 15(12): 6660-6669 Open Veterinary Journal, (2025), Vol. 15(12): 6660-6669 Research Article Comparative ex vivo 7T MRI study of renal microstructural changes in cats with and without chronic kidney diseaseTakumi Matsuura1†, Hiroshi Satoh2 and Masaaki Katayama3*1Toray Industries, Inc., Tokyo, Japan 2Division of Veterinary Pharmacology and Toxicology, Cooperative Department of Veterinary Medicine, School of Veterinary Medicine, Iwate University, Morioka, Japan 3Division of Small Animal Surgery, Cooperative Department of Veterinary Medicine, School of Veterinary Medicine, Iwate University, Morioka, Japan †Present address: Zpeer Inc., Tokyo, Japan. *Corresponding Author: Masaaki Katayama. Division of Small Animal Surgery, Cooperative Department of Veterinary Medicine, School of Veterinary Medicine, Iwate University, Morioka, Japan. Email: masaaki [at] iwate-u.ac.jp Submitted: 17/06/2025 Revised: 15/11/2025 Accepted: 30/11/2025 Published: 31/12/2025 © 2025 Open Veterinary Journal
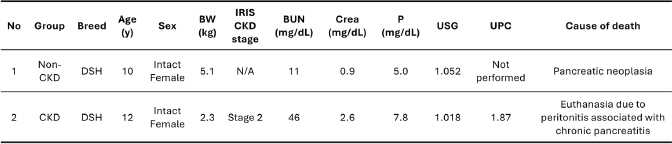
AbstractBackground: Seven-tesla magnetic resonance imaging (7T MRI) noninvasively detects microstructural changes associated with chronic kidney disease (CKD). Using animal-specific coils is often necessary to obtain high resolution and to minimize artifacts from breathing and heartbeat, even under anesthesia. However, in feline medicine, this ultra-high-field imaging has not been investigated either in vivo or even ex vivo using explanted organs. Aim: This study aimed to use a high-resolution ex vivo imaging approach to characterize microstructural changes in a kidney from a cat with CKD compared to a background-matched control, and to correlate the magnetic resonance imaging (MRI) findings with histopathology, focusing on the relationship between the apparent diffusion coefficient (ADC) and interstitial fibrosis. Methods: We imaged the postmortem kidneys of a cat with the International Renal Interest Society Stage 2 CKD and a background-matched control using a 7T MRI system. High-resolution T2-weighted imaging and diffusion-weighted imaging (DWI) sequences were acquired to generate ADC maps. We measured mean ADC values in the cortex and medulla and correlated these values with the degree of interstitial fibrosis, assessed by Masson’s trichrome staining. Results: On T2-weighted images, the CKD kidney showed a loss of corticomedullary differentiation, whereas the control kidney maintained a clear definition. The mean ADC value in the renal cortex of the CKD cat (432 ± 8 μm²/sec) was lower than that in the non-chronic kidney disease cat (609 ± 15 μm²/sec). A lower ADC value was also found in the outer medulla of the CKD kidney. In contrast, the ADC value in the inner medulla was higher in the CKD kidney (1,088 ± 19 μm²/sec) compared to the control (962 ± 26 μm²/sec). Histopathology confirmed extensive interstitial fibrosis in the CKD kidney, but only minimal fibrosis in the control kidney. Conclusion: High-resolution ex vivo MRI can detect microstructural changes in the feline CKD kidney. In particular, we found that a decreased cortical ADC value is strongly associated with interstitial fibrosis. These findings suggest that DWI could be a promising noninvasive tool for assessing the pathology of feline CKD and provide a basis for future studies in living animals. Keywords: Feline chronic kidney disease (CKD), Magnetic resonance imaging (MRI), Apparent diffusion coefficient (ADC), Interstitial fibrosis, Ex vivo. IntroductionChronic kidney disease (CKD) is a significant challenge in veterinary medicine, especially in cats, where it becomes more common with age (O'Neill et al., 2013; Finch et al., 2016). Feline CKD is defined by kidney abnormalities that last for more than 3 months and is known for its "silent progression" (Bartges, 2012). Clinical signs such as increased urination and thirst (polyuria, polydipsia) and weight loss usually appear only after more than 75% of kidney function is already lost (Brown et al. 1997). This delay in diagnosis is a major limitation of the current methods. Standard markers, such as serum creatinine and symmetric dimethylarginine (SDMA), often fail to detect the disease in its early stages or provide details about the underlying tissue damage (Reynolds and Lefebvre, 2013; Hall et al., 2014). The disease process in CKD leads to a common pathway of tubulointerstitial inflammation, tubular atrophy, glomerulosclerosis, and particularly fibrosis, which is a strong indicator of declining kidney function (Brown et al., 2016). Although interstitial fibrosis is a known hallmark of CKD, the mechanisms that initiate and drive this process in cats are not fully understood. In human CKD, progressive loss of microvessels and endothelial injury are thought to be key events that create a cycle of chronic hypoxia, inflammation, and fibrosis, leading to end-stage renal disease (Nangaku, 2006). A similar pathway may exist in cats. For instance, reduced renal blood flow is linked to the progression of kidney disease (Bieri, 1976), and experimentally induced ischemia-reperfusion causes fibrosis (Schmiedt et al., 2016). Additionally, markers of tubular hypoxia are higher in cats with advanced CKD (Katayama et al., 2020). To address this knowledge gap, there is a clear need for noninvasive methods that can quantitatively assess the kidney’s microstructure, particularly its microvasculature. Magnetic resonance imaging (MRI) is a powerful tool for this purpose, offering excellent soft-tissue contrast to evaluate kidney structure and function without the use of ionizing radiation (Zhang et al., 2013; Mendichovszky et al., 2020; Céré et al., 2024). Advanced MRI techniques can investigate tissue architecture, perfusion, and fibrosis (Zhang and Zhang, 2020). Among these, diffusion-weighted imaging (DWI) is particularly promising. DWI measures the random motion of water molecules, which is expressed as the apparent diffusion coefficient (ADC). Changes such as fibrosis and cellular infiltration restrict water movement in diseased tissues, causing a drop in ADC values (Caroli et al., 2018; Serai et al., 2023; Stabinska et al., 2024). A lower renal ADC is strongly correlated with a decline in glomerular filtration rate and the severity of tubulointerstitial damage in human CKD, suggesting it could be a useful marker for kidney health (Inoue et al., 2011; Inoue et al., 2021). In addition, T2-weighted imaging (T2WI) and T2 relaxation time mapping provide detailed anatomical information and are sensitive to tissue changes such as edema, inflammation, and fibrosis (Schley et al., 2018). In particular, ultra-high-field imaging, such as 7-Tesla (7T), shows great promise for noninvasively studying the microstructural changes associated with CKD (Baldelomar et al., 2016; Wang et al., 2022). The high signal-to-noise ratio (SNR) at 7T makes it possible to capture images at a much higher spatial resolution. However, to achieve this resolution in living subjects, it is necessary to use special radiofrequency coils designed for animals, along with advanced motion correction techniques. These tools are needed to reduce image distortions caused by respiration and cardiac motion, a challenge that remains even in anesthetized subjects (Heijman et al., 2007; Hiba et al., 2007; Herrmann et al., 2012). Despite its immense potential to noninvasively assess renal microstructure, ultra-high-field imaging has, to our knowledge, never been applied to feline kidney disease. This represents a significant knowledge gap in veterinary nephrology. Its clinical application in live feline patients faces significant practical challenges. For instance, the small size of the feline kidney (3.0–4.5 cm long) requires very high spatial resolution to see fine details (Chew SP DiBartola and Schenck, 2010). Furthermore, the lack of commercially available MRI coils and standardized imaging protocols specifically designed for cats makes it difficult to obtain high-quality, reproducible data in a clinical setting. Although developing these tools usually requires clinical studies in feline patients, it is ethically necessary to first conduct basic research on explanted kidneys. To overcome these in vivo challenges and obtain the resolution needed for microstructural analysis, this study used an ex vivo approach with formalin-fixed kidney samples and an ultra-high-field 7T MRI. This method eliminates the risks of anesthesia and motion artifacts, allowing for long scan times to achieve a high SNR and ultra-high spatial resolution (Park et al., 2023). Chemical fixation changes tissue properties. Formalin causes protein cross-linking, which reduces free water and typically leads to lower T1, T2, and ADC values (Schmierer et al., 2010; Birkl et al., 2016; Medina, 2023). The consequence of this fixation can be seen when comparing our ex vivo non-chronic kidney disease (non-CKD) cortical ADC (approx. 0.609 × 10⁻³ mm²/s) with published in vivo values for healthy cats (median 1.65 × 10⁻³ mm²/s) (Del Chicca et al., 2019). However, while the absolute quantitative values are different, many studies have shown that ex vivo MRI is a valuable tool because the relative signal contrast between healthy and diseased tissues is often maintained (Jordan et al. 2018). This makes it a useful method for understanding the structural basis of disease, as long as properly prepared ex vivo control tissues are used for comparison. Therefore, this study represents the first proof-of-concept investigation to utilize high-resolution 7T ex vivo MRI to describe detailed structural and microstructural changes in the kidneys of a cat with naturally occurring CKD and compare them to a non-CKD cat. The main goal of this study was to carefully correlate MRI-detected microstructural changes with histopathological findings, particularly interstitial fibrosis. We hypothesized that the ADC value in the renal cortex would be lower in the CKD kidney, reflecting the severity of fibrosis and microstructural disruption. Through this direct correlation, we aimed to provide foundational evidence that quantitative DWI can serve as a noninvasive surrogate marker for key pathological features of feline CKD, paving the way for future in vivo applications. Materials and MethodsClinical and biochemical analysisPrior to necropsy, clinical data, including body weight, were recorded. For biochemical analysis, blood samples were collected from the jugular vein into lithium heparin tubes. Plasma was separated by centrifugation, and blood urea nitrogen (BUN) and creatinine concentrations were measured using an automated chemistry analyzer (Catalyst One Chemistry Analyzer, IDEXX Laboratories, Inc., Westbrook, ME). Tissue preparationKidneys were collected immediately after necropsy. An incision was made to ensure proper fixative penetration where needed. The tissues were then fixed in 4% paraformaldehyde (PFA) in phosphate-buffered saline (PBS) overnight at 4°C. For MRI analysis, the PFA-fixed kidneys were extensively washed in 0.1 M PBS (pH 7.4). Magnetic resonance imagingFor imaging, each kidney was placed in a 0.1 M PBS solution containing 0.2 mM gadolinium chelate (Bayer Yakuhin, Osaka, Japan) to shorten the T2 relaxation time of the surrounding solution. The specimen was then placed in an acrylic tube filled with Fluorinert™ FC-40 (Sumitomo 3M, Tokyo, Japan), a susceptibility-matched fluid, to reduce magnetic field distortions and suppress signals from the surrounding medium (Yano et al., 2018). All MRI experiments were performed using a 7.0-Tesla, 16-cm horizontal bore MRI system (BioSpec 70/16; Bruker BioSpin, Ettlingen, Germany) with a gradient system capable of a maximum strength of 700 mT/m. A volume coil with an inner diameter of 38 mm was used for both radiofrequency transmission and reception. High-resolution T2WIs were obtained using a rapid acquisition with relaxation enhancement (RARE) sequence with the following settings: echo time (TE)=30 ms; repetition time (TR)=250 ms; RARE factor=4; number of averages=3; spatial resolution=50 µm isotropic; and a total scan time of 15 hours and 30 minutes. DWI was performed using a DW echo-planar imaging sequence to create ADC maps. The imaging parameters were as follows: TE=17 ms; TR=1,000 ms; number of averages=1; b-value=1,000 s/mm²; spatial resolution=281 × 281 × 1,000 µm; and scan time=3 minutes and 44 seconds. Image analysisThe ADC values were quantified using ImageJ software (NIH). Regions of interest were manually drawn over the renal cortex, outer medulla, and inner medulla on three central slices of the ADC maps for each kidney. The mean ADC values (μm²/sec) for each renal region were calculated from the signal intensities within these regions of interest. HistopathologyThe kidney tissues were processed for histological analysis after MRI. Tissues were dehydrated in a graded ethanol series and embedded in paraffin. Paraffin-embedded tissues were cut into 5-µm-thick sections. For assessing general morphology, sections were stained with hematoxylin and eosin (H&E) to evaluate features such as interstitial fibrosis, cellular infiltration, glomerulosclerosis, and thickening of basement membranes and vascular walls. For the specific evaluation of fibrosis, adjacent sections were stained with Masson’s trichrome to identify collagen fibers, which appear blue. Statistical analysisOwing to the exploratory nature of this proof-of-concept study, which involved a detailed comparison of one CKD and one non-CKD case, no formal statistical significance testing was performed. Data for ADC values are presented as the mean ± standard error (SE) from three central renal sections for descriptive and comparative purposes. Ethical approvalAll animal procedures were performed in accordance with the guidelines of, and approved by, the Institutional Animal Care and Use Committee of Iwate University (Approval No. A201825). Kidneys were obtained from two domestic shorthair cats at necropsy. The cats had been euthanized or had died from diseases not related to primary renal failure at Iwate University. Table 1 summarizes the clinical data and renal function parameters for each cat. One cat was diagnosed with International Renal Interest Society (IRIS) Stage 2 CKD, and the other, showing no clinical signs of renal disease (non-CKD), served as the control for this study. Table 1. Comparison of patient characteristics, renal function parameters, and causes of death in non-CKD and CKD cats.
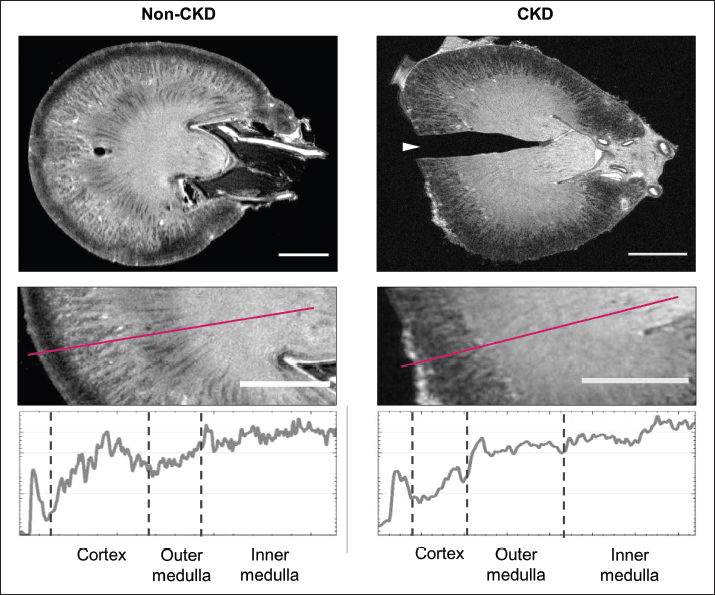
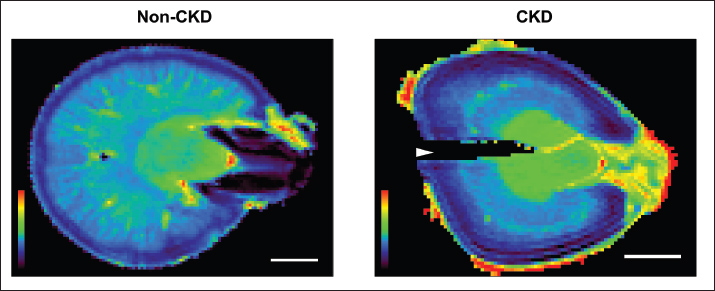
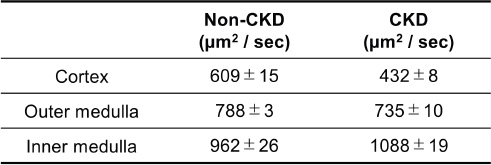
ResultsPatient characteristicsThe clinical characteristics of the non-CKD and CKD cats are summarized in Table 1. The cat with CKD was 12 years old, classified as Stage 2 by the IRIS, and had a lower body weight (2.3 kg), elevated (BUN; 46 mg/dl) and creatinine (Crea; 2.6 mg/dl), and a low urine specific gravity (USG; 1.018). In contrast, the 10-year-old non-CKD cat had renal function parameters that were within normal limits. Abbreviations used: BW, body weight; BUN, blood urea nitrogen; CKD, chronic kidney disease; Crea, creatinine; DSH, domestic shorthair; IRIS, International Renal Interest Society; N/A, not applicable; P, phosphorus; UPC, urine protein-to-creatinine ratio; USG, urine specific gravity. MRI findingsHigh-resolution 7T T2-weighted MRI revealed clear morphological differences between the non-CKD and CKD kidneys (Fig. 1). The non-CKD kidney showed well-preserved corticomedullary differentiation (CMD), with a clear, stepwise decrease in signal intensity from the cortex to the inner medulla. In contrast, the CKD kidney showed a severe loss of CMD and a flattened, irregular signal intensity profile across the renal parenchyma. Analysis of ADC maps further showed tissue-level changes (Fig. 2). Quantitative analysis revealed significant differences in ADC values between the two groups in all examined regions (Table 2). Specifically, the mean ADC value in the renal cortex of the CKD cat (432 ± 8 μm²/sec) was markedly lower than that of the non-CKD cat (609 ± 15 μm²/sec). A lower ADC value was also observed in the outer medulla of the CKD cat. In contrast, the ADC value in the inner medulla was higher in the CKD cat (1088 ± 19 μm²/sec) compared to the non-CKD cat (962 ± 26 μm²/sec).
Fig. 1. High-resolution 7T T2WI of non-CKD and CKD feline kidneys. Representative T2WI of fixed whole kidneys from a non-CKD cat (left) and a cat with CKD (right). The top row displays sagittal images of the entire kidneys. The middle row provides magnified views of the renal parenchyma, highlighting the cortex, outer medulla, and inner medulla. The bottom row shows the corresponding signal intensity profiles measured along the lines indicated in the middle panels, extending from the cortex (left) to the inner medulla (right). Scale bar=5 mm.
Fig. 2. ADC maps of non-CKD and CKD feline kidneys. Representative ADC maps of fixed whole kidneys from a non-CKD cat (left) and a cat with CKD (right). Images were acquired using a 7T MRI. Scale bar=5 mm. Table 2. Quantitative analysis of renal ADC values in non-CKD and CKD cats.
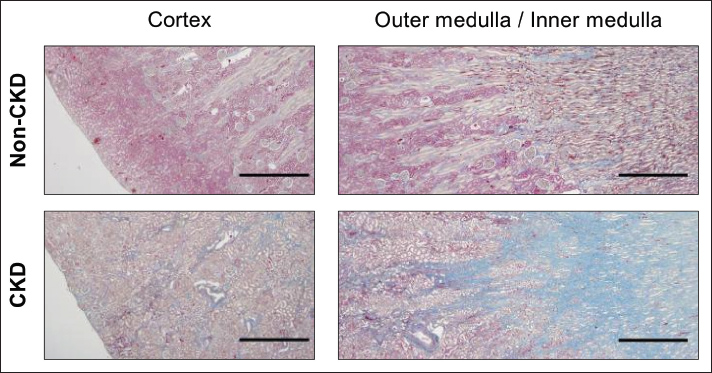
Data represent the mean ± SE of ADC values (μm²/sec) from three central renal sections. Histopathological findingsHistopathological examination with H&E staining of the CKD kidney revealed pathological changes consistent with advanced CKD. The key findings included diffuse lymphocytic infiltration in the interstitium and scattered glomerulosclerosis. There was also marked thickening of the basement membranes of the glomeruli, glomerular capsules, and tubules, as well as thickening of the vascular walls. Widespread interstitial fibrosis was also observed, particularly in the corticomedullary region. These changes were largely absent in the non-CKD kidney (Fig. 3). To assess the degree of renal fibrosis, we performed a histological examination using Masson's trichrome staining (Fig. 4). In this staining method, collagen fibers, which represent fibrosis, are stained blue. The kidney from the CKD cat showed extensive collagen deposition, representing severe interstitial fibrosis, throughout both the cortex and the medulla. In contrast, we observed only minimal fibrous tissue in the kidney of the non-CKD cat.
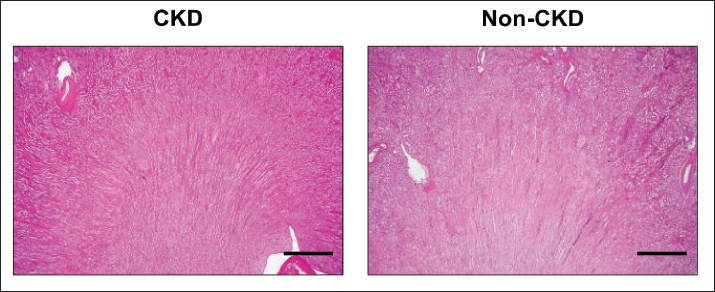
Fig. 3. Histological evaluation of renal morphology by H&E staining. Representative photomicrographs of the corticomedullary junction of the kidney from a non-CKD cat (Top) and a cat with CKD (Bottom). Sections were stained with H&E, which highlights general architectural changes. The CKD section displays prominent pathological features, including extensive interstitial fibrosis, glomerulosclerosis, and diffuse cellular infiltration. Scale bar=1 mm. Images were acquired using a 4× objective lens.
Fig. 4. Histological evaluation of renal fibrosis by Masson's trichrome staining. Representative photomicrographs of kidney sections from a non-CKD cat (Top) and a cat with CKD (Bottom). Sections were stained with Masson’s trichrome, in which blue staining indicates collagen fibers (fibrosis). Each image shows the corticomedullary junction, with the cortex to the left and the medulla to the right. Scale bar=200 µm. Images were acquired using a 10× objective lens. DiscussionIn this study, we used high-resolution 7T ex vivo MRI, including T2WI and quantitative ADC mapping, to examine the detailed microstructural changes in a feline kidney with naturally occurring IRIS stage 2 CKD and compare it to a non-CKD control. This ex vivo approach was chosen to address the major challenges of in vivo feline imaging. These include technical limitations, such as the lack of cat-specific coils and standardized methods, and the ethical need to conduct foundational research for future clinical investigations. Furthermore, it was essential for achieving the high spatial resolution needed to directly correlate MRI findings with histopathology on the same tissue slice. Despite the known effects of formalin fixation, this was deemed necessary. Our study revealed significant structural and functional differences between the CKD and non-CKD kidneys. High-resolution T2WI of the CKD kidneys demonstrated a pronounced loss of CMD, a well-established marker of chronic renal injury. This structural disruption is attributed to pathological processes such as inflammation and fibrosis, which break down the organized architecture of the kidney and lead to a more uniform signal intensity. Furthermore, quantitative analysis of the ADC highlighted key tissue alterations. ADC values in the cortex (432 ± 8 μm²/sec) and outer medulla of the CKD kidney were markedly lower than those in the non-CKD counterparts (cortex: 609 ± 15 μm²/sec), indicating restricted water diffusion. In contrast, the inner medullary ADC was higher in the CKD kidney (1,088 ± 19 μm²/sec) compared to the non-CKD kidney (962 ± 26 μm²/sec). Histopathology strongly corroborated these imaging findings. The analysis confirmed widespread interstitial fibrosis throughout the CKD kidneys, whereas the non-CKD kidneys exhibited only minimal fibrotic changes. Therefore, the lower ADC values observed in the cortex and outer medulla are consistent with the presence of dense collagen from fibrosis, which restricts the movement of water molecules (Langkammer et al. 2016; Schneider et al. 2018). Crucially, our ex vivo design enabled the establishment of a direct correlation, providing strong evidence that a lower cortical ADC is a reliable indicator of renal fibrosis in naturally occurring feline CKD. The lower cortical ADC observed in feline CKD kidneys is consistent with findings across species. For instance, in human patients, a lower renal ADC strongly correlates with a decline in eGFR and the severity of tubulointerstitial fibrosis (Kozawa et al. 2011; Schneider et al. 2018). Similar negative correlations between ADC and interstitial fibrosis have also been reported in canine CKD (Salesov et al. 2019). This consistency suggests that the effect of fibrosis on water diffusion is a fundamental and shared mechanism. Therefore, ADC can serve as a translatable imaging biomarker for this key pathological feature. Similarly, the loss of CMD on T2WI is a known feature of chronic renal damage in humans, reflecting significant structural disarray from advanced fibrosis (Mao et al., 2023). Our study confirms that T2WI is valuable for qualitatively assessing these major structural changes in feline CKD, complementing the quantitative data from ADC mapping. In contrast to the cortical findings, the increased inner medullary ADC in the CKD cat presents a more complex picture. While many human CKD studies have reported a general decrease in ADC throughout the kidney, some have noted variable or even increased medullary ADC (Yalcin-Safak et al., 2016). Furthermore, ex vivo studies in animal models, such as those with unilateral ureteral obstruction, have shown that ADC values can be higher despite fibrosis (Boor et al., 2015). This effect is attributed to other pathological changes, such as tubular dilation, which expands the extracellular space and enhances free water diffusion (Langkammer et al. 2016; Schneider et al. 2018). Therefore, the increased ADC in the inner medulla likely reflects a complex situation where the diffusion-enhancing effects of tubular damage and dilation—a consequence of poor urine concentrating ability—had a greater impact on the diffusion-restricting effects of fibrosis in that specific region. This interpretation is consistent with the clinical finding of a low urine specific gravity (USG=1.018) in the CKD cat, which indicates impaired urine concentrating ability, a hallmark of tubular dysfunction. As outlined in the introduction, this study was designed to test the hypothesis that microvascular injury is a key initiating event in feline CKD, potentially preceding the development of severe interstitial fibrosis. In our ex vivo model, the absence of blood flow ensures that the observed changes in ADC are purely reflective of tissue microstructure—such as cellularity, inflammation, and the composition of the extracellular space. Chronic hypoxia, a direct consequence of microvascular damage, leads to renal fibrosis (Nangaku, 2006). We therefore propose that the initial stages of this process alter water diffusion. These early stages, including cell death, inflammation, and matrix remodeling, are consequently detectable as ADC changes, even before dense fibrosis becomes prominent on histology. Based on the observed diffuse ADC alterations, particularly in the cortex, we argue that microstructural changes resulting from vascular compromise are a key component of feline CKD. This perspective offers a potential explanation for the discrepancy with some histology-based feline studies that suggested capillary networks were preserved (Yabuki et al. 2018). Thus, our results, derived from a functional imaging parameter, suggest that MRI can reveal the downstream consequences of microvascular dysfunction—effects that histology-based vessel counting alone may miss. There is a clear need for noninvasive biomarkers to overcome the limitations of serum creatinine and SDMA for the early diagnosis and detailed assessment of feline CKD (Yerramilli et al. 2014). This study demonstrates the potential of advanced MRI to noninvasively assess renal parenchymal health. If translated to in vivo settings, quantitative cortical ADC could serve as a surrogate marker for renal fibrosis. This could help in diagnosis, staging, and monitoring responses to therapy, potentially reducing the need for invasive biopsies. Significant technical challenges remain for in vivo application in cats: their small kidney size, available coils, and standardized protocols specifically designed for cats. However, the foundational ex vivo data presented here are valuable for guiding the development of better in vivo protocols. By identifying key sensitive parameters, such as cortical ADC, this study provides a clear direction for creating robust, motion-corrected DWI sequences tailored for feline imaging. Therefore, future research should aim for longitudinal in vivo studies to track MRI changes with disease progression and treatment. A multiparametric MRI approach could be particularly valuable in this regard. This would involve combining DWI with other techniques, such as T1 mapping (for fibrosis), BOLD MRI (for hypoxia), and MR elastography (for stiffness). Together, these methods could provide a comprehensive "renal health score," paving the way for more personalized and effective management of feline CKD. Furthermore, future validation studies could benefit from correlating these advanced imaging findings with more detailed histological analyses, such as periodic acid-Schiff staining, to better investigate changes in glomerular and tubular basement membrane integrity. The main limitations of this study are its ex vivo design and the nature of it being a single-case comparison (one CKD and one non-CKD cat). While formalin fixation alters absolute ADC values, we contend that relative differences between identically processed tissues remain valid for interpreting disease-related changes (Jordan et al. 2018). Nevertheless, as a proof-of-concept study, our findings must be interpreted as exploratory. Their generalizability needs to be confirmed in future studies with larger cohorts to account for biological variability. Furthermore, the presence of comorbidities, such as pancreatitis in both animals, could represent a confounding factor that may have influenced their renal microstructure. In conclusion, this high-resolution ex vivo study shows that T2WI and ADC mapping can detect distinct structural and microstructural changes in a feline CKD kidney that correlate strongly with histopathologically confirmed interstitial fibrosis. These findings support the potential of advanced MRI to noninvasively assess the key pathological features of feline CKD. Most importantly, this work provides a foundational rationale for future research focusing on translating these techniques into a clinical, in vivo setting. Validating these imaging markers in larger, longitudinal studies is the next critical step toward improving the diagnosis, monitoring, and management of this devastating disease in cats. AcknowledgmentsWe are grateful to Dr. Yuji Komaki of the Live Imaging Center, Central Institute for Experimental Animals, for technical support in acquiring the MRI data and for valuable discussions regarding their analysis. Conflict of interestT.M. works for Toray Industries Inc. (Tokyo, Japan). None of the authors have any personal or financial relationships that could have inappropriately influenced or biased the content of the paper. FundingThis study received no external funding. Author contributionsConceptualization, T.M.; methodology, T.M., H.S.; statistical analysis, T.M.; resources, M.K.; data curation, H.S., M.K.; writing–original draft preparation, T.M.; review and editing, T.M., H.S., M.K.; supervision, M.K.; project administration, T.M., M.K. Availability of dataThe datasets analyzed during the current study are available upon reasonable request from the corresponding author. ReferencesBaldelomar, E.J., Charlton, J.R., Beeman, S.C., Hann, B.D., Cullen-Mcewen, L., Pearl, V.M., Bertram, J.F., Wu, T., Zhang, M. and Bennett, K.M. 2016. Phenotyping by magnetic resonance imaging nondestructively measures glomerular number and volume distribution in mice with and without nephron reduction. Kidney. Int. 89(2), 498–505. Bartges, J.W. 2012. Chronic kidney disease in dogs and cats. Vet. Clin. North Am. Small Anim. Pract. 42(4), 669–692. Bieri, P. 1976. Laboratory diagnosis of kidney diseases in the cat with special reference to para-amino-hippuric acid (PAH)-clearance. Birkl, C., Langkammer N Golob., -Schwarzl M Leoni., Haybaeck W Goessler. and Fazekas , S. Ropele. 2016. Effects of formalin fixation and temperature on MR relaxation times in the human brain. NMR. Biomed. 29(4), 458–465. Boor, P., Perkuhn, M., Weibrecht, M., Zok, S., Martin, I.V., Gieseke, J., Schoth, F., Ostendorf, T., Kuhl, C. and Floege, J. 2015. Diffusion-weighted MRI does not reflect kidney fibrosis in a rat model of fibrosis. J. Magn. Reson. Imag. 42(4), 990–998. Brown, C.A., Elliott, J., Schmiedt, C.W. and Brown, S.A. 2016. Chronic kidney disease in aged cats: clinical features, morphology, and proposed pathogeneses. Vet. Pathol. 53(2), 309–326. Brown, S.A., Crowell CA Brown. and Barsanti , D. R. Finco. 1997. Pathophysiology and management of progressive renal disease. Vet. J. 154(2), 93–109. Caroli, A., Schneider, M., Friedli, I., Ljimani, A., De Seigneux, S., Boor, P., Gullapudi, L., Kazmi, I., Mendichovszky, I.A., Notohamiprodjo, M., Selby, N.M., Thoeny, H.C., Grenier, N. and Vallée, J.P. 2018. Diffusion-weighted magnetic resonance imaging to assess diffuse renal pathology: a systematic review and statement paper. Nephrol. Dial. Transplant. 33(suppl_2), ii29–ii40. Céré, C., Curcio, V., Dorez, H., Debreuque, M., Franconi, F. and Rousseau, D. 2024. Quantitative MRI for brain lesion diagnosis in dogs and cats: a comprehensive overview. Vet. Radiol. Ultrasound. 65(6), 849–864. Chew SP DiBartola. and Schenck. 2010. Canine and feline nephrology and urology, Elsevier Health Sciences. Elsevier Health Sciences. Del Chicca, F., Salesov, E., Joerger, F., Richter, H., Reusch, C.E. and Kircher, P.R. 2019. Perfusion-weighted and diffusion-weighted magnetic resonance imaging of the liver, spleen, and kidneys of healthy adult male cats. Am. J. Vet. Res. 80(2), 159–167. Elliott, J. 2023. Therapeutics of managing reduced red cell mass associated with chronic kidney disease - Is there a case for earlier intervention? J. Vet. Pharmacol. Ther. 46(3), 145–157. Finch, N.C., Syme, H.M. and Elliott, J. 2016. Risk factors for development of chronic kidney disease in cats. J. Vet. Intern. Med. 30(2), 602–610. Gaviria, M., Bonny H Haton., Jean M Teigell. and Renou , A. Privat. 2006. Time course of acute phase in mouse spinal cord injury monitored by ex vivo quantitative MRI. Neurobiol. Dis. 22(3), 694–701. Hall, J.A., Yerramilli, M., Obare, E., Yerramilli, M. and Jewell, D.E. 2014. Comparison of serum concentrations of symmetric dimethylarginine and creatinine as kidney function biomarkers in cats with chronic kidney disease. J. Vet. Intern. Med. 28(6), 1676–1683. Heijman, E., de Graaf, P. Niessen., Nauerth G van., Eys L de., Graaf K Nicolay. and Strijkers. 2007. Comparison between prospective and retrospective triggering for mouse cardiac MRI. NMR. Biomed. 20(4), 439–447. Herrmann, K.H., Schmidt A Kretz., Haenold I Krumbein., Metzler C Gaser. and Witte , J. R. Reichenbach. 2012. Possibilities and limitations for high resolution small animal MRI on a clinical whole-body 3T scanner. MAGMA 25(3), 233–244. Hiba, B., Richard H Thibault. and Janier. 2007. Cardiac and respiratory self-gated cine MRI in the mouse: comparison between radial and rectilinear techniques at 7T. Magn. Reson. Med. 58(4), 745–753. Inoue, T., Kozawa H Okada., Inukai S Watanabe., Kikuta Y Watanabe., Takenaka S Katayama. and Tanaka , H. Suzuki. 2011. Noninvasive evaluation of kidney hypoxia and fibrosis using magnetic resonance imaging. J. Am. Soc. Nephrol. 22(8), 1429–1434. Inoue, T., Kozawa, E., Ishikawa, M., Fukaya, D., Amano, H., Watanabe, Y., Tomori, K., Kobayashi, N., Niitsu, M. and Okada, H. 2021. Comparison of multiparametric magnetic resonance imaging sequences with laboratory parameters for prognosticating renal function in chronic kidney disease. Sci. Rep. 11(1), 22129. Katayama, M., Ohata, K., Miyazaki, T., Katayama, R., Wakamatsu, N., Ohno, M., Yamashita, T., Oikawa, T., Sugaya, T. and Miyazaki, M. 2020. Renal expression and urinary excretion of liver-type fatty acid-binding protein in cats with renal disease. J. Vet. Intern. Med. 34(2), 761–769. Mao, W., Ding, X., Ding, Y., Cao, B., Fu, C., Kuehn, B., Benkert, T., Grimm, R., Nickel, D., Zhou, J. and Zeng, M. 2023. Evaluation of interstitial fibrosis in chronic kidney disease by multiparametric functional MRI and histopathologic analysis. Eur. Radiol. 33(6), 4138–4147. Maxie, G. 2015. Jubb, Kennedy & Palmer's pathology of domestic animals: volume 2, Elsevier health sciences, 2. Medina, M. C. 2023. Impact of formalin fixation on multi-compartment T2 relaxation and its tissue orientation dependence in excised pig spinal cord white matter, University of British Columbia. Mendichovszky, I., Pullens I Dekkers., Nery O Bane., Pohlmann A de., Boer A Ljimani., Odudu C Buchanan., Sharma C Laustsen., Harteveld X Golay., Pedrosa D Alsop., Fain A Caroli., Prasad S Francis., Sigmund M Fernandez. and -Seara , S. Sourbron. 2020. Technical recommendations for clinical translation of renal MRI: a consensus project of the Cooperation in Science and Technology Action PARENCHIMA. MAGMA 33(1), 131–140. Nakamura, R., Yabuki O Ichii., Mizukawa N Yokoyama. and Yamato. 2018. Changes in Renal Peritubular Capillaries in Canine and Fetal Chronic Kidney Disease. J. Comp. Pathol. 160, 79–83. Nangaku, M. 2006. Chronic hypoxia and tubulointerstitial injury: a final common pathway to end-stage renal failure. J. Am. Soc. Nephrology 17(1), 17–25. O'Neill, D.G., Elliott, J., Church, D.B., Mcgreevy, P.D., Thomson, P.C. and Brodbelt, D.C. 2013. Chronic kidney disease in dogs in UK veterinary practices: prevalence, risk factors, and survival. J. Vet. Intern. Med. 27(4), 814–821. Park, S.E., Jeon, Y.J. and Baek, H.M. 2023. Benefits of high-dielectric pad for neuroimaging study in 7-Tesla MRI. J. Anal. Sci. Technol. 14(1), 17. Paschall, R.E., Quimby, J.M., Cianciolo, R.E., Mcleland, S.M., Lunn, K.F. and Elliott, J. 2023. Assessment of peritubular capillary rarefaction in kidneys of cats with chronic kidney disease. J. Vet. Intern. Med. 37(2), 556–566. Reynolds, B.S. and Lefebvre. 2013. Feline CKD: pathophysiology and risk factors--what do we know?. J. Feline. Med. Surg. 15 Suppl 1(1), 3–14. Schley, G., Jordan, J., Ellmann, S., Rosen, S., Eckardt, K.U., Uder, M., Willam, C. and Bäuerle, T. 2018. Multiparametric magnetic resonance imaging of experimental chronic kidney disease: a quantitative correlation study with histology. PLos One. 13(7), 200259. Schmiedt, C.W., Brainard, B.M., Hinson, W., Brown, S.A. and Brown, C.A. 2016. Unilateral Renal Ischemia as a Model of Acute Kidney Injury and Renal Fibrosis in Cats. Vet. Pathol. 53(1), 87–101. Schmierer, K., Parkes, H.G., So, P.W., An, S.F., Brandner, S., Ordidge, R.J., Yousry, T.A. and Miller, D.H. 2010. High field (9.4 Tesla) magnetic resonance imaging of cortical grey matter lesions in multiple sclerosis. Brain 133(Pt 3), 858–867. Serai, S.D., Kurugol P Pullens. and Wang , E. Sigmund. 2023. Microstructural Features and Functional Assessment of the Kidney Using Diffusion MRI. In Sigmund, E.E. and Leiner, T. (eds), Advanced Clinical MRI of the Kidney: methods and Protocols. New York, NY: Springer, pp: 271–97. Stabinska, J., Wittsack, H.J., Lerman, L.O., Ljimani, A. and Sigmund, E.E. 2024. Probing Renal Microstructure and Function with Advanced Diffusion MRI: concepts, Applications, Challenges, and Future Directions. J. Magn. Reson. Imag. 60(4), 1259–1277. Tisdall, M.D., Ohm, D.T., Lobrovich, R., Das, S.R., Mizsei, G., Prabhakaran, K., Ittyerah, R., Lim, S., Mcmillan, C.T., Wolk, D.A., Gee, J., Trojanowski, J.Q., Lee, E.B., Detre, J.A., Yushkevich, P., Grossman, M. and Irwin, D.J. 2022. Ex vivo MRI and histopathology detect novel iron-rich cortical inflammation in frontotemporal lobar degeneration with tau versus TDP-43 pathology. NeuroImage. Clin. 33, 102913. Wang, F., Otsuka F Adelnia., Takahashi R Delgado., Harkins Z Zu., de Caestecker, R. C. Harris. and Gore , T. Takahashi. 2022. Multiparametric magnetic resonance imaging in diagnosis of long-term renal atrophy and fibrosis after ischemia reperfusion induced acute kidney injury in mice. NMR. Biomed. 35(10), 4786. Yalçin-Şafak, K., Ayyildiz, M., Ünel, S.Y., Umarusman-Tanju, N., Akça, A. and Baysal, T. 2016. The relationship of ADC values of renal parenchyma with CKD stage and serum creatinine levels. Eur. J. Radiol. Open. 3, 8–11. Yano, R., Hata, J., Abe, Y., Seki, F., Yoshida, K., Komaki, Y., Okano, H. and Tanaka, K.F. 2018. Quantitative temporal changes in DTI values coupled with histological properties in cuprizone-induced demyelination and remyelination. Neurochem. Int. 119, 151–158. Zhang, J. and Zhang, L.J. 2020. Functional MRI as a Tool for Evaluating Interstitial Fibrosis and Prognosis in Kidney Disease. Kidney Dis. (Basel) 6(1), 7–12. Zhang, J.L., Rusinek, H., Chandarana, H. and Lee, V.S. 2013. Functional MRI of the kidneys. J. Magn. Reson. Imag. 37(2), 282–293. | ||
| How to Cite this Article |
| Pubmed Style Matsuura T, Satoh H, Katayama M. Comparative ex vivo 7T MRI study of renal microstructural changes in cats with and without chronic kidney disease. Open Vet. J.. 2025; 15(12): 6660-6669. doi:10.5455/OVJ.2025.v15.i12.47 Web Style Matsuura T, Satoh H, Katayama M. Comparative ex vivo 7T MRI study of renal microstructural changes in cats with and without chronic kidney disease. https://www.openveterinaryjournal.com/?mno=265035 [Access: January 25, 2026]. doi:10.5455/OVJ.2025.v15.i12.47 AMA (American Medical Association) Style Matsuura T, Satoh H, Katayama M. Comparative ex vivo 7T MRI study of renal microstructural changes in cats with and without chronic kidney disease. Open Vet. J.. 2025; 15(12): 6660-6669. doi:10.5455/OVJ.2025.v15.i12.47 Vancouver/ICMJE Style Matsuura T, Satoh H, Katayama M. Comparative ex vivo 7T MRI study of renal microstructural changes in cats with and without chronic kidney disease. Open Vet. J.. (2025), [cited January 25, 2026]; 15(12): 6660-6669. doi:10.5455/OVJ.2025.v15.i12.47 Harvard Style Matsuura, T., Satoh, . H. & Katayama, . M. (2025) Comparative ex vivo 7T MRI study of renal microstructural changes in cats with and without chronic kidney disease. Open Vet. J., 15 (12), 6660-6669. doi:10.5455/OVJ.2025.v15.i12.47 Turabian Style Matsuura, Takumi, Hiroshi Satoh, and Masaaki Katayama. 2025. Comparative ex vivo 7T MRI study of renal microstructural changes in cats with and without chronic kidney disease. Open Veterinary Journal, 15 (12), 6660-6669. doi:10.5455/OVJ.2025.v15.i12.47 Chicago Style Matsuura, Takumi, Hiroshi Satoh, and Masaaki Katayama. "Comparative ex vivo 7T MRI study of renal microstructural changes in cats with and without chronic kidney disease." Open Veterinary Journal 15 (2025), 6660-6669. doi:10.5455/OVJ.2025.v15.i12.47 MLA (The Modern Language Association) Style Matsuura, Takumi, Hiroshi Satoh, and Masaaki Katayama. "Comparative ex vivo 7T MRI study of renal microstructural changes in cats with and without chronic kidney disease." Open Veterinary Journal 15.12 (2025), 6660-6669. Print. doi:10.5455/OVJ.2025.v15.i12.47 APA (American Psychological Association) Style Matsuura, T., Satoh, . H. & Katayama, . M. (2025) Comparative ex vivo 7T MRI study of renal microstructural changes in cats with and without chronic kidney disease. Open Veterinary Journal, 15 (12), 6660-6669. doi:10.5455/OVJ.2025.v15.i12.47 |

