


| Research Article | ||
Open Vet. J.. 2025; 15(12): 6552-6559 Open Veterinary Journal, (2025), Vol. 15(12): 6552-6559 Research Article Gait and posture analysis in rats with Parkinson’s disease using DeepLabCut during beam testYoichi Ohno* and Yusuke ChigiraDepartment of Physical Therapy, Faculty of Health Care, Takasaki University of Health and Welfare,Takasaki, Japan *Corresponding Author: Yoichi Ohno. Department of Physical Therapy, Faculty of Health Care, Takasaki University Health and Welfare, Takasaki City, Japan. Email: ohno [at] takasaki-u.ac.jp Submitted: 08/05/2025 Revised: 22/10/2025 Accepted: 06/11/2025 Published: 31/12/2025 © 2025 Open Veterinary Journal
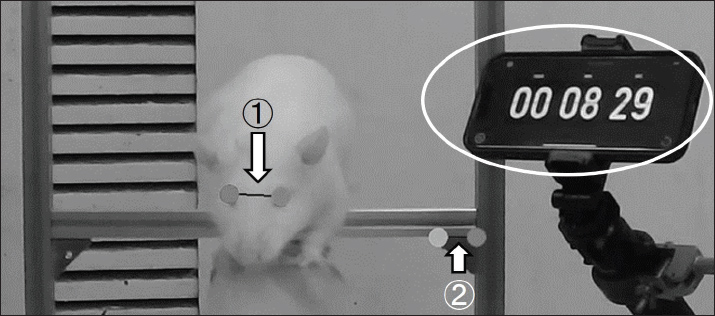
AbstractBackground: Gait and postural impairments in patients with Parkinson’s disease (PD) severely affect daily activities and are important targets for treatment. Aim: This study aimed to analyze gait and posture in PD-model rats during the beam test using DeepLabCut (DLC), a deep neural network for motion tracking. Methods: Ten rats with unilateral 6-hydroxydopamine (6-OHDA) lesions and five sham-operated rats were tested. The beam test was used to evaluate foot slips, execution time, head and trunk inclination, and stride length using images captured from frontal, lateral, and top views. Results: The 6-OHDA group exhibited significantly longer task times. Frontal-view images revealed a greater head tilt in the PD group than in the SHAM group. Lateral-view images showed a shorter stride length, and top-view images indicated larger mean and maximum trunk inclination angles in the PD group than in the SHAM group. Conclusion: DLC successfully detected these gait and posture abnormalities, indicating that it is an effective method for evaluating motor function in PD-model rats. This approach may serve as a reliable tool for assessing the therapeutic effects of PD. Keywords: Beam test, DeepLabCut, Gait analysis, Image analysis, Parkinson's disease. IntroductionParkinson’s disease (PD) is a progressive disorder with no established curative treatment, making it challenging to manage. Moreover, the global prevalence of PD is increasing, leading to an increase in associated health care costs, which has become a considerable societal concern (GBD 2016; Parkinson’s Disease Collaborators, 2018). PD is caused by dopaminergic neuron degeneration and is characterized by distinct motor symptoms. Gait and balance impairments resulting from these motor symptoms have a substantial impact on daily activities and quality of life (Morris, 2000; Del Olmo and Cudeiro, 2005). Furthermore, these impairments result in a higher incidence of falls among patients with PD, which is reportedly a major cause of hospitalization and admission to nursing care facilities (Wood et al., 2002; Balash et al., 2005). Therefore, improving motor symptoms, such as gait and balance, is of great importance (Grondona et al., 2013). Rat models of PD are frequently used to investigate therapeutic interventions targeting gait impairment. Unilateral PD model rats, created by injecting 6-hydroxydopamine (6-OHDA) into the medial forebrain bundle (MFB), exhibit reduced walking speed and shortened stride length (Xiao et al., 2017; Boix et al., 2018). Despite being a unilateral brain lesion model, these rats display bilateral gait abnormalities (Metz et al., 2005). In addition, characteristic PD symptoms, such as bradykinesia and shuffling gait, have been observed. The prolonged initiation time of movement indicates the presence of freezing phenomena (Kucinski et al., 2015; Xiao et al., 2017). These findings indicate that PD model rats exhibit symptoms similar to those of PD patients. Various methods, including specialized animal gait analysis devices (Xiao et al., 2017; Boix et al., 2018), footprint analysis (Metz et al., 2005), and the Michigan Complex Motor Control Test (Kucinski et al., 2015), have been employed to analyze gait in PD model rats. However, these methods present some challenges, such as the need for expensive measurement equipment and a controlled environment. Recently, DeepLabCut (DLC), a freely available deep neural network capable of tracking specific body parts from recorded videos, has emerged as a promising tool for motion analysis (Kirkpatrick et al., 2022). This technique has been used to assess motor functions in various rodent disease models (Aljovic et al., 2022; Weber et al., 2022; Piotrowski et al., 2024). In PD animal models, beam tests using model mice have shown that DLC can accurately detect subtle motor and balance deficits that are difficult to observe using Rotarod or other conventional motor tests. DLC-based analysis achieves accuracies comparable to manual measurements (Bidgood et al., 2024). However, recent studies that employed DLC for gait analysis focused on analyzing stride length, cadence, and joint angles from lateral views. Few studies have investigated gait and posture characteristics using images captured from the frontal or top views. In our previous study, we used image analysis to analyze the motor characteristics of PD model rats during the reaching test and found that head inclination occurred during the task (Ohno et al., 2022). This observation indicates impaired postural reflexes in PD, which are closely related to falls in patients with PD and are therefore considered a critical element for observation (Madete et al., 2011; Ferraris et al., 2024). Therefore, our study aimed to establish a method for analyzing gait and posture characteristics during beam test performance in unilateral PD model rats using DLC to analyze images captured from multiple directions. Materials and MethodsAnimalsThis study involved 15 male rats aged 15 weeks, including 10 unilateral PD (MFB) model rats (6-OHDA group) and five control rats (SHAM group). The animals were housed individually in standard cages under a 12:12 hours light-dark cycle. Water was provided ad libitum, while food intake was restricted to maintain 90%–95% of the participants’ initial body weight to encourage learning and task performance in behavioral experiments. Surgical proceduresRats in the 6-OHDA and SHAM groups were purchased from Japan SLC Inc. To create the lesion group, 12-week-old Wistar rats were administered desipramine, a norepinephrine reuptake inhibitor, at a dose of 25 mg/kg intraperitoneally (i.p.), followed by 4 µl of 6-OHDA at a concentration of 2.25 mg/ml. The injection coordinates were 4.4 mm posterior to the bregma, 1.5 mm lateral to the midline, and 7.8 mm ventral to the skull surface. For the SHAM group, 12-week-old Wistar rats were injected with saline instead of 6-OHDA. The right brains of all rats were designated as the lesioned side. Rats in the lesion group underwent an apomorphine-induced rotation test at 15 weeks of age to confirm the presence of a lesion in the MFB. Only rats with confirmed lesions were included in the study. Motor tasksMeasurement methodThe beam test was conducted using a stainless steel beam measuring 1,200 mm in length and 20 mm in width, with the central 500 mm designated as the measurement section. Gait analysis was initiated when the tail base entered the measurement section and ended when the snout reached the end of the section. Animals underwent 10-minute practice sessions in the same environment for seven consecutive days before the test to acclimate to the task. This ensured that all animals had mastered the task and were capable of performing it. Measurement items• Number of foot slips: The number of slips made by the forelimbs and hindlimbs on both sides within the measurement section was visually counted from videos recorded from the lateral side. • Task completion time: The time taken to traverse the 500-mm measurement section was recorded from lateral view images. • Image analysis: Web cameras were used to capture task performance from four directions: front, left lateral, right lateral, and top. The cameras were set to 720p resolution and 60 fps. For the lateral and top views, the measurement section was centered in the image, and the frame included the 500-mm measurement section, along with 100 mm at each end (700 mm total). Marks placed at both ends of the 500-mm section were positioned at the frame edges. Preliminary verification confirmed that the lens distortion at the ends of the 500-mm section was within 5 mm. For the front view, the camera was set to ensure that the entire 1,200-mm walking path of the animal was always captured in the frame at a maximum wide angle. Image analysis using DLCDLC was used to analyze images captured from various perspectives (Mathis et al., 2018). The following analyses were performed: Frontal images (Fig. 1)The observation points included the eyes and two points on the beam visible in the horizontal plane. The angle of head inclination was estimated from the line connecting the eyes (Fig. 1-①) and the line connecting the two points on the beam (Fig. 1-②). The mean and maximum head inclination angles within the measurement section were analyzed.
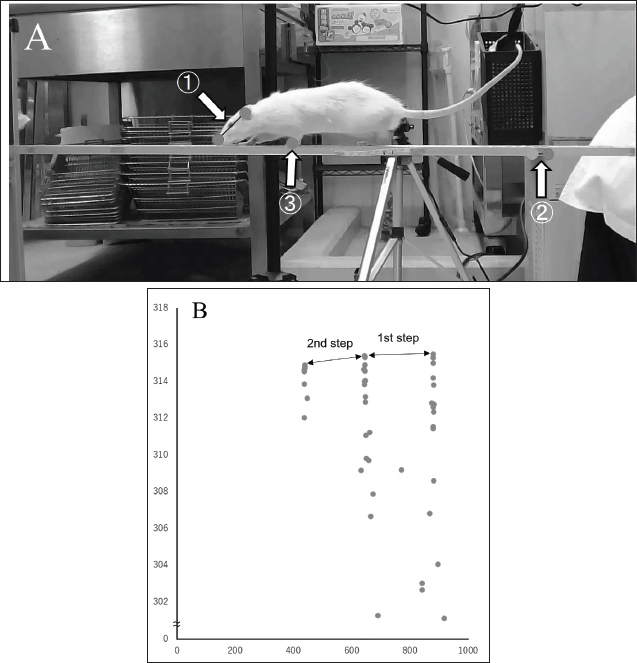
Fig. 1. Frontal image. The head inclination angle was estimated from the line connecting both eyes (①) and the line connecting two points on the beam visible in the horizontal plane of the screen (②). The travel time within the measurement section in the front image was identified by capturing the same clock in the front image as that in the right-side image. Lateral images (Fig. 2A)From the left lateral view, the observation points included the nose, ear canal, forelimb heel, and the two ends of a 190-mm tape affixed to the beam. The head inclination angle was estimated from the line connecting the nose and ear canal (Fig. 2A①) and the line connecting the two points on the tape (Fig. 2A②). In addition, the stride length was calculated using the position of the forelimb heel (Fig. 2B③). The coordinates obtained from the DLC were calibrated based on the 190-mm tape to convert them into millimeters (Fig. 2B). The mean, maximum, and minimum head inclination angles and the average stride length over two steps were analyzed.
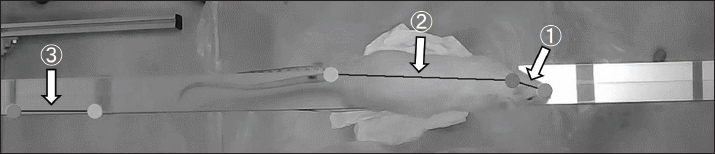
Fig. 2. Lateral image. A: The head inclination angle was estimated from the line connecting the nose and ear canal (A①) and the line connecting two points on the tape (A②). The stride length was calculated from the forelimb heel (A③). B: The stride length was estimated from the coordinates of the observation points obtained using the DLC. The right lateral view was recorded with the same settings as the left lateral view; however, it was used to assess the number of foot slips and task completion time. A clock was included in the right lateral images and was also captured in the frontal images, allowing the identification of the time it took the animal to traverse the measurement section in the frontal view. Top images (Fig. 3)The observation points were set at approximately the midpoint of the line connecting the tips of the nose and both ears and at the base of the tail. The head inclination angle was estimated using the line connecting the midpoint between the nose and both ears (Fig. 3-①) and the line connecting the two observation points on the beam projected horizontally on the screen (Fig. 3-③). Similarly, the trunk inclination angle was estimated using the line connecting the midpoint between both ears and the base of the tail (Fig. 3-②), along with the line connecting the two points on the beam (Fig. 3-③).
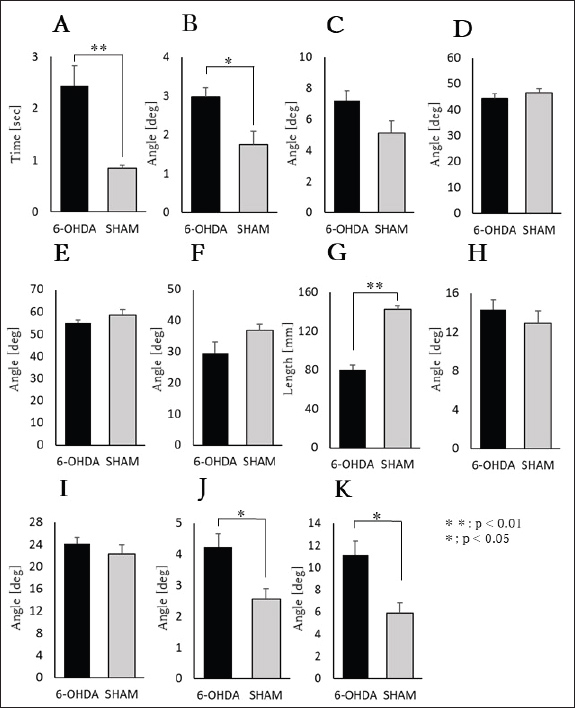
Fig. 3. Top image. The head inclination angle was estimated using the line connecting the midpoint between the nose and both ears (①) and the line connecting the two observation points on the beam projected horizontally on the screen (③). Similarly, the trunk inclination angle was estimated using the line connecting the midpoint between both ears and the base of the tail (②), along with the line connecting the two points on the beam (③). The mean and maximum values of the head and trunk inclination angles within the measurement range were used for analysis. Statistical analysisStatistical analyses were performed using IBM SPSS Statistics 25.0 (IBM Corp., Armonk, NY). We assessed the normality and homogeneity of variance for each parameter to compare the results between the 6-OHDA and SHAM groups. An unpaired t-test was used, where both normality and homogeneity of variance were confirmed. Welch’s t-test was used, where normality was confirmed but homogeneity of variance was not. In cases where normality was not confirmed, the Mann–Whitney U test was applied. The significance level for all tests was set at p < 0.05. Data are presented as mean ± SEM. Ethical approvalAll experimental procedures were conducted in accordance with the National Institutes of Health guidelines for the care and use of laboratory animals and were approved by the Animal Experiment Committee of Takasaki University of Health and Welfare (protocol number 2401). ResultsNumber of foot slipsNo foot slips were observed in the 6-OHDA and SHAM groups. Task completion timeThe task completion time was significantly longer in the 6-OHDA group (2.44 ± 0.39 s) than in the SHAM group (0.85 ± 0.05 s) (p < 0.01: Welch's test) (Fig. 4A).
Fig. 4. Summary of the Results. A: Time to task completion. B: Mean front image head inclination angle value. C: Maximum front image head inclination angle value. D: Mean lateral image head inclination angle value. E: Maximum lateral image head inclination angle value. F: Minimum lateral image head inclination angle value. G: Stride length. H: Mean top image head inclination angle value. I: Maximum inclination angle of the top image head. J: Mean top image trunk inclination angle value. K: Maximum top image trunk inclination angle value. Data are expressed as mean ± SEM. Deg: degree. Image analysis(1) Frontal image (head inclination angle) • Mean angle: The mean head inclination angle was significantly greater in the 6-OHDA group (2.97° ± 0.24°) than in the SHAM group (1.75° ± 0.35°) (p < 0.05: unpaired t-test) (Fig. 4B). • Maximum angle: The maximum head inclination angle was 7.21° ± 0.64° in the 6-OHDA group and 5.13° ± 0.76° in the SHAM group, with no significant difference between the groups (unpaired t-test) (Fig. 4C). (2) Lateral image • Head inclination angle: The mean head inclination angle was 44.26° ± 1.77° in the 6-OHDA group and 46.47° ± 1.73° in the SHAM group, with no significant difference between the groups (unpaired t-test) (Fig. 4D). The maximum head inclination angle was 54.95° ± 1.41° in the 6-OHDA group and 58.47° ± 2.56° in the SHAM group, with no significant difference between the groups (unpaired t-test) (Fig. 4E). The minimum head inclination angle was 29.52° ± 3.71° in the 6-OHDA group and 36.93° ± 1.84° in the SHAM group, with no significant difference observed (Welch’s test) (Fig. 4F). • Stride length: The stride length was significantly shorter in the 6-OHDA group (79.90 ± 5.01 mm) than in the SHAM group (142.23 ± 4.13 mm) (p < 0.01: unpaired t-test; Fig. 4G). (3) Top image • Head inclination angle: The mean head inclination angle was 14.26° ± 1.03° in the 6-OHDA group and 12.90° ± 1.28° in the SHAM group, with no significant difference between the groups (unpaired t-test) (Fig. 4H). The maximum head inclination angle was 24.11° ± 1.13° in the 6-OHDA group and 22.97° ± 1.58° in the SHAM group, with no significant difference between the groups (unpaired t-test) (Fig. 4I). • Trunk inclination angle: The mean trunk inclination angle was significantly greater in the 6-OHDA group (4.22° ± 0.44°) than in the SHAM group (2.55° ± 0.34°) (p < 0.05: unpaired t-test) (Fig. 4J). The maximum trunk inclination angle was significantly greater in the 6-OHDA group (11.12° ± 1.30°) than in the SHAM group (5.90° ± 0.94°) (p < 0.05: unpaired t-test) (Fig. 4K). DiscussionThis study aimed to analyze the movement characteristics of unilateral PD model rats during the beam test using DLC applied to multi-directional images. Our results revealed significant differences in head inclination angle in the frontal view, stride length in the lateral view, and trunk inclination angle in the top view between the 6-OHDA and SHAM groups. One of the characteristic features of muscle activity in PD is a reduction in extensor activity and an increase in flexor activity (Horak et al., 1996). This trend has also been observed in PD model animals, where postural observations from the posterior side showed reduced extensor support of the lower limbs, leading to a lower pelvic position and increased spacing between the hind limbs compared with normal rats (Kalinina et al., 2023). In addition, changes in muscle activity duration during movement have been reported (Metz et al., 2005), and the disharmony between extensor and flexor activity, along with abnormal activity timing, is considered one of the factors impairing automatic PD control (Rinalduzzi et al., 2015). Based on frontal image analysis, our previous study on reaching movements also demonstrated similar trends in postural impairments (Ohno et al., 2022). Furthermore, Miklyaeva et al. (1997) reported that postural adjustments using the impaired limbs during reaching movements were particularly challenging (Miklyaeva et al., 1997). Our study showed a significant increase in the head inclination angle in the frontal images, supporting the validity of this measurement method for capturing the characteristic symptoms of PD model rats. A previous study on PD model rats with 6-OHDA injections into the unilateral striatum reported that both limbs exhibited reduced toe clearance, resulting in shorter stride lengths, as measured through footprint analysis (Metz et al., 2005). Investigations using small-animal gait analysis systems have shown that walking speed, cadence, and stride length are reduced in MFB models (Boix et al., 2018). The same study also reported coordination deficits, with significant differences observed in the movement patterns of diagonally paired limbs (left forelimb and right hindlimb, right forelimb and left hindlimb). These characteristic symptoms in PD model rats reflect bradykinesia and short-stepped gait in patients with PD (Jankovic, 2008; Pistacchi et al., 2017), suggesting that various findings from PD model rats could be useful in studies related to PD in humans. Given that stride length and gait speed are crucial indicators in assessing patients with PD (Pistacchi et al., 2017), the ability of lateral image analysis to capture stride length reduction in this study indicates the validity of this measurement method. To the best of our knowledge, no prior studies have examined head and trunk inclination angles using top-view images in the beam test for PD rats. The significant increase in the trunk inclination angle observed in the 6-OHDA group compared with the SHAM group may be attributed to inadequate postural control on the beam owing to the impaired lower limb support on the affected side, similar to the changes observed in the head inclination angle in the frontal view. This postural instability potentially increased trunk inclination. These findings indicate that top-view imaging may serve as a novel indicator for assessing rat PD symptoms. The image-based analysis employed in this study, using frontal, lateral, and top views, captured gait impairments in PD model rats and identified previously under-reported postural changes. Evaluating posture in patients with PD is crucial because impairments in postural reflexes are strongly associated with an increased risk of falls and injuries in daily life (Pistacchi et al., 2017). Moreover, monitoring postural changes in response to therapeutic interventions is essential for assessing their impact on patients with PD. Another important outcome of this study is the versatility of the imaging method used. Although the beam test images were analyzed, the approach does not require specialized equipment, making it highly adaptable for applications in standard gait pathways and ladder tests commonly used for rodent gait analysis. LimitationsOne limitation of this study is the lack of in-house capability to create PD model rats, necessitating the purchase of pre-established PD model rats from commercial suppliers. Consequently, an adaptation period before beam test training could not be provided before model induction; instead, a 1-week familiarization period was given to all subjects immediately before testing. This indicates that motor learning related to the beam test may have occurred during this period, potentially influencing the results. Furthermore, 6-OHDA, which was used to create the PD model rats, reportedly induces dopaminergic neuronal damage lasting over 5 weeks after injection (Sarre et al., 2004). Measurements were conducted within a fixed period to standardize the testing timeframe, and all results were derived from a single successful trial per subject. Therefore, the data were not averaged across multiple trials, which may have affected the reliability of the findings. Future studies should aim to minimize the impact of task learning by collaborating with facilities capable of generating PD model rats, allowing pretraining before model induction. This allows for the collection of more precise and reliable measurement data. ConclusionThe beam test results in PD model rats were analyzed using DLC with multi-directional imaging and compared with those in SHAM model rats. The results showed that the PD model rats exhibited significantly greater head and trunk inclination angles and reduced stride length. These findings indicate that the DLC-based analysis of the beam test performance effectively captures the motor characteristics of PD model rats. Therefore, the measurement method employed in our study is valid and may serve as a valuable tool for evaluating therapeutic interventions in rats with PD. AcknowledgmentsWe are grateful to Yuwa Izawa, Minami Obinata, Miki Kawakubo, Moeka Kobayashi, and Ibuki Karasawa for their technical support. We would also like to thank Yusuke Chigira for his valuable contribution and collaboration throughout this study. FundingThe Japan Society for the Promotion of Science (JSPS) supported this study through the Grant-in-Aid for Scientific Research (23K16550) for fiscal year 2023. Conflicts of interestThe authors report no competing interests to declare. Authors' contributionsYoichi Ohno conceived and designed the study, collected and analyzed the data, and drafted the manuscript. Yusuke Chigira contributed to the data analysis. All authors critically reviewed and approved the final version of the manuscript. Data availabilityAll data supporting this study’s findings are available within the manuscript. ReferencesAljovic, A., Zhao, S., Chahin, M., de la Rosa, C., Van Steenbergen, V., Kerschensteiner, M. and Bareyre, F.M. 2022. A deep learning-based toolbox for Automated Limb Motion Analysis (ALMA) in murine models of neurological disorders. Commun. Biol. 5, 131. Balash, Y., Peretz, C., Leibovich, G., Herman, T., Hausdorff, J.M. and Giladi, N. 2005. Falls in outpatients with Parkinson’s disease: frequency, impact, and identifying factors. J. Neurol. 252, 1310–1315. Bidgood, R., Zubelzu, M., Ruiz-Ortega, J.A. and Morera-Herreras, T. 2024. Automated procedure to detect subtle motor alterations in the balance beam test in a mouse model of early Parkinson’s disease. Sci. Rep. 14, 862. Boix, J., von Hieber, D. and Connor, B. 2018. Gait analysis for early detection of motor symptoms in the 6-OHDA rat model of Parkinson’s disease. Front. Behav. Neurosci. 12, 39. Del Olmo, M.F. and Cudeiro, J. 2005. Temporal variability of gait in Parkinson disease: effects of a rehabilitation programme based on rhythmic sound cues. Parkinsonism Relat. Disord. 11, 25–33. Ferraris, C., Votta, V., Nerino, R., Chimienti, A., Priano, L. and Mauro, A. 2024. At-home assessment of postural stability in Parkinson’s disease: a vision-based approach. J. Ambient Intell. Hum. Comput. 15, 2765–2778. GBD 2016 Parkinson's Disease Collaborators. 2018. Global, regional, and national burden of Parkinson’s disease, 1990–2016: a systematic analysis for the Global Burden of Disease Study 2016. Lancet Neurol. 17, 939–953. Grondona, J.M., Granados-Durán, P., Fernández-Llebrez, P. and López-Ávalos, M.D. 2013. A simple method to obtain pure cultures of multiciliated ependymal cells from adult rodents. Histochem. Cell Biol. 139, 205–220. Horak, F.B., Frank, J. and Nutt, J. 1996. Effects of dopamine on postural control in parkinsonian subjects: scaling, set, and tone. J. Neurophysiol. 75, 2380–2396. Jankovic, J. 2008. Parkinson’s disease: clinical features and diagnosis. J. Neurol. Neurosurg. Psychiatry. 79, 368–376. Kalinina, D.S., Lyakhovetskii, V.A., Gorskii, O.V., Shkorbatova, P.Y., Pavlova, N.V., Bazhenova, E.Y., Sysoev, Y.I., Gainetdinov, R.R. and Musienko, P.E. 2023. Alteration of postural reactions in rats with different levels of dopamine depletion. Biomedicines. 11, 1958. Kirkpatrick, N.J., Butera, R.J. and Chang, Y.H. 2022. DeepLabCut increases markerless tracking efficiency in X-ray video analysis of rodent locomotion. J. Exp. Biol. 225, jeb244540. Kucinski, A., Albin, R.L., Lustig, C. and Sarter, M. 2015. Modeling falls in Parkinson’s disease: slow gait, freezing episodes and falls in rats with extensive striatal dopamine loss. Behav. Brain Res. 282, 155–164. Madete, J.K., Klein, A., Dunnett, S.B. and Holt, C.A. 2011. Three-dimensional motion analysis of postural adjustments during over-ground locomotion in a rat model of Parkinson’s disease. Behav. Brain Res. 220, 119–125. Mathis, A., Mamidanna, P., Cury, K.M., Abe, T., Murthy, V.N., Mathis, M.W. and Bethge, M. 2018. DeepLabCut: markerless pose estimation of user-defined body parts with deep learning. Nat. Neurosci. 21, 1281–1289. Metz, G.A., Tse, A., Ballermann, M., Smith, L.K. and Fouad, K. 2005. The unilateral 6-OHDA rat model of Parkinson’s disease revisited: an electromyographic and behavioural analysis. Eur. J. Neurosci. 22, 735–744. Miklyaeva, E.I., Woodward, N.C., Nikiforov, E.G., Tompkins, G.J., Klassen, F., Ioffe, M.E. and Whishaw, I.Q. 1997. The ground reaction forces of postural adjustments during skilled reaching in unilateral dopamine-depleted hemiParkinson rats. Behav. Brain Res. 88, 143–152. Morris, M.E. 2000. Movement disorders in people with Parkinson disease: a model for physical therapy. Phys. Ther. 80, 578–597. Ohno, Y., Horikoshi, A. and Imamura, K. 2022. Reaching task in rats: quantitative evaluation and effects of 6-OHDA into the striatum. J. Mot. Behav. 54, 648–655. Piotrowski, D., Clemensson, E.K.H., Nguyen, H.P. and Mark, M.D. 2024. Phenotypic analysis of ataxia in spinocerebellar ataxia type 6 mice using DeepLabCut. Sci. Rep. 14, 8571. Pistacchi, M., Gioulis, M., Sanson, F., De Giovannini, E., Filippi, G., Rossetto, F. and Zambito Marsala, S. 2017. Gait analysis and clinical correlations in early Parkinson’s disease. Funct. Neurol. 32, 28–34. Rinalduzzi, S., Trompetto, C., Marinelli, L., Alibardi, A., Missori, P., Fattapposta, F., Pierelli, F. and Currà, A. 2015. Balance dysfunction in Parkinson’s disease. BioMed Res. Int. 2015, 434683. Sarre, S., Yuan, H., Jonkers, N., Van Hemelrijck, A., Ebinger, G. and Michotte, Y. 2004. In vivo characterization of somatodendritic dopamine release in the substantia nigra of 6-hydroxydopamine-lesioned rats. J. Neurochem. 90, 29–39. Weber, R.Z., Mulders, G., Kaiser, J., Tackenberg, C. and Rust, R. 2022. Deep learning-based behavioral profiling of rodent stroke recovery. BMC Biol. 20, 232. Wood, B.H., Bilclough, J.A., Bowron, A. and Walker, R.W. 2002. Incidence and prediction of falls in Parkinson’s disease: a prospective multidisciplinary study. J. Neurol. Neurosurg. Psychiatry 72, 721–725. Xiao, H., Li, M., Cai, J., Li, N., Zhou, M., Wen, P., Xie, Z., Wang, Q., Chang, J. and Zhang, W. 2017. Selective cholinergic depletion of pedunculopontine tegmental nucleus aggravates freezing of gait in parkinsonian rats. Neurosci. Lett. 659, 92–98. | ||
| How to Cite this Article |
| Pubmed Style Ohno Y, Chigira Y. Gait and posture analysis in rats with Parkinson’s disease using DeepLabCut during beam test. Open Vet. J.. 2025; 15(12): 6552-6559. doi:10.5455/OVJ.2025.v15.i12.39 Web Style Ohno Y, Chigira Y. Gait and posture analysis in rats with Parkinson’s disease using DeepLabCut during beam test. https://www.openveterinaryjournal.com/?mno=256893 [Access: June 26, 2026]. doi:10.5455/OVJ.2025.v15.i12.39 AMA (American Medical Association) Style Ohno Y, Chigira Y. Gait and posture analysis in rats with Parkinson’s disease using DeepLabCut during beam test. Open Vet. J.. 2025; 15(12): 6552-6559. doi:10.5455/OVJ.2025.v15.i12.39 Vancouver/ICMJE Style Ohno Y, Chigira Y. Gait and posture analysis in rats with Parkinson’s disease using DeepLabCut during beam test. Open Vet. J.. (2025), [cited June 26, 2026]; 15(12): 6552-6559. doi:10.5455/OVJ.2025.v15.i12.39 Harvard Style Ohno, Y. & Chigira, . Y. (2025) Gait and posture analysis in rats with Parkinson’s disease using DeepLabCut during beam test. Open Vet. J., 15 (12), 6552-6559. doi:10.5455/OVJ.2025.v15.i12.39 Turabian Style Ohno, Yoichi, and Yusuke Chigira. 2025. Gait and posture analysis in rats with Parkinson’s disease using DeepLabCut during beam test. Open Veterinary Journal, 15 (12), 6552-6559. doi:10.5455/OVJ.2025.v15.i12.39 Chicago Style Ohno, Yoichi, and Yusuke Chigira. "Gait and posture analysis in rats with Parkinson’s disease using DeepLabCut during beam test." Open Veterinary Journal 15 (2025), 6552-6559. doi:10.5455/OVJ.2025.v15.i12.39 MLA (The Modern Language Association) Style Ohno, Yoichi, and Yusuke Chigira. "Gait and posture analysis in rats with Parkinson’s disease using DeepLabCut during beam test." Open Veterinary Journal 15.12 (2025), 6552-6559. Print. doi:10.5455/OVJ.2025.v15.i12.39 APA (American Psychological Association) Style Ohno, Y. & Chigira, . Y. (2025) Gait and posture analysis in rats with Parkinson’s disease using DeepLabCut during beam test. Open Veterinary Journal, 15 (12), 6552-6559. doi:10.5455/OVJ.2025.v15.i12.39 |

