


| Research Article | ||
Open Vet. J.. 2025; 15(8): 3798-3808 Open Veterinary Journal, (2025), Vol. 15(8): 3798-3808 Research Article Correlation between the ultrasonographic measurement of intestinal thickening and laboratory parameters in asymptomatic dogsIago Martins Oliveira1*, Sara Sueli Ferreira de Almeida1, Carolle Vieira Muterlle Sprícigo1, Wanessa Patrícia Rodrigues da Silva1, Marco Augusto Machado Silva2, Ana Flávia Machado Botelho2, Danieli Brolo Martins2 and Naida Cristina Borges21Programa de Pós-graduação em Ciência Animal, Escola de Veterinária e Zootecnia, Universidade Federal de Goiás, Goiânia, Brazil 2Departamento de Medicina Veterinária, Escola de Veterinária e Zootecnia, Universidade Federal de Goiás, Goiânia, Brazil *Corresponding Author: Iago Martins Oliveira. Programa de Pós-graduação em Ciência Animal, Escola de Veterinária e Zootecnia, Universidade Federal de Goiás, Goiânia, Brazil. Email: iago.vetufg [at] gmail.com Submitted: 25/02/2025 Revised: 21/06/2025 Accepted: 13/07/2025 Published: 31/08/2025 © 2025 Open Veterinary Journal
ABSTRACTBackground: Intestinal ultrasound (USG) is a valuable diagnostic tool for gastrointestinal diseases in dogs. Despite its usefulness, the clinical significance of intestinal thickening in asymptomatic animals remains unclear. Aim: This study aimed to correlate the thickness of the intestinal layers with hematological and biochemical parameters in asymptomatic dogs. Methods: Thirty healthy dogs were assessed and divided into two groups: G1 (n=15), with no USG alterations, and G2 (n=15), with different intestinal thicknesses. Pearson’s correlation test was used to assess possible associations between laboratory data and intestinal thickening. Results: The results showed no statistically significant correlation between intestinal thickness and keratometric parameters, leukometry, proteinogram, and serum biochemistry (r ranging from −0.004 to 0.29 in hematology and from 0.008 to 0.2 in biochemistry, with p > 0.05). Conclusion: Therefore, identifying early markers for the diagnosis of enteropathies in asymptomatic dogs was not possible. The lack of associations limits the clinical usefulness of intestinal USG as a predictor of laboratory alterations or as a tool for diagnosing enteropathies in the early stages. Expanding the sample, using additional biomarkers, conducting prospective studies, and correlating USG findings with intestinal histology are recommended. These steps could help explore new clinical and laboratory markers to better understand the clinical significance of gastrointestinal tract thickening in dogs. Keywords: Blood count, Serum biochemistry, Intestine, Ultrasonography. IntroductionUltrasound (USG) of the gastrointestinal tract (GIT) provides information on the functionality and anatomy of the evaluated structures (Mattoon and Nyland, 2014; Malancus and Malancus, 2017), as well as the integrity of the intestinal wall (Rafael et al., 2024). Understanding normal and abnormal sonographic features is invaluable for diagnosing GI diseases (Pennick 2008; Larson and Biller, 2009). Consequently, USG is recommended for animals displaying symptoms of gastroenteropathy (Agut, 2009; Alves et al., 2007; Fitzgerald et al., 2017). However, limitations in image interpretation can arise due to lumen content and composition (Baker and Soo, 2002; Silva et al., 2013). The gastrointestinal USG evaluates several characteristics, such as parietal stratification, echogenicity, and echotexture. This allows the description and classification of changes (Baker and Soo, 2002; Alves et al., 2007). Previous studies have established reference values for intestinal layer wall thickness in dogs (Penninck et al., 1989; Delaney et al., 2003; Gladwin et al., 2014). Despite this foundation, there is a dearth of information regarding variations in intestinal wall layer thickness concerning breed, body weight, and age (Banzato et al., 2017). Nevertheless, other studies have reported some partial insights (Stander et al., 2010a, b). Investigations have aimed to correlate these measurements by hypothesizing that there are differences between the mucosa and other layers (Malancus and Malancus, 2017). Furthermore, there remains a gap in understanding how thickening of an intestinal layer contributes to the overall thickness of the visualized and measured segment in imaging examinations (Gladwin et al., 2014). Several studies have explored the correlation between intestinal ultrasonographic thickening and clinical parameters in dogs with chronic enteropathies (Le Roux, 2015) and canine cadavers (Le Roux et al., 2016). Additionally, one study investigated the relationship between ultrasonographic and histopathological measurements of small intestine wall layers in feline cadavers immediately post-mortem (Martinez et al., 2018). Intestinal USG thickening, especially of the muscular layer, was not associated with chronic inflammatory enteropathy in dogs. For this reason, a recent retrospective study evaluated the intestinal USG reports of dogs with muscular layer thickening. Most of the animals did not show any changes in the stratification of the intestinal wall; there were no changes in echogenicity, and some animals showed thickening of the muscular layer as the only finding. The importance of USG for intestinal assessment in dogs was reinforced (Collins-Webb et al., 2023). Furthermore, a recent case report of intestinal smooth muscle hyperplasia in a French Bulldog showed diffuse thickening of the intestinal wall, increased muscle layer, and adjacent hyperechogenicity on USG imaging of the ileum. Thus, the authors emphasize the importance of considering idiopathic hyperplastic processes when evaluating USG findings of intestinal wall changes in dogs (Jang et al., 2025). In a recent review of B-mode USG and microbubble contrast for intestinal evaluation in dogs, the authors emphasized that if the cause of the disease is not related to the GIT, USG results may not be specific. Owing to the nonspecific nature of gastrointestinal clinical signs, this imaging test should be performed based on the overall clinical context, medical history, and other complementary tests (Oliveira et al., 2025). To the best of the authors’ knowledge, there is a gap in the current literature on the relationship between increased intestinal thickness and laboratory parameters in dogs, which could indicate an early stage of gastrointestinal diseases or episodic changes in these tests in the absence of underlying enteropathies. Therefore, it would be advantageous to conduct a more detailed analysis of the clinical relevance of intestinal thickness and its relationship with diseases. In view of this, this study aimed to correlate momentary intestinal thickening in a single assessment with hematological and biochemical values in asymptomatic dogs with echographic alterations without determining the etiology of the intestinal condition with histopathological analysis. Materials and MethodsAnimalsThe experiment was conducted at the Veterinary Hospital of the School of Veterinary Medicine and Zootechnics of the Federal University of Goiás. The animals came from the routine clinical care of the Veterinary Hospital/School of Veterinary Medicine and Zootechnics (VH/SVMZ) on a voluntary basis. All the animals underwent anamnesis to collect epidemiological data, general and specific clinical examination, and laboratory tests with a hematological and biochemical evaluation to monitor the kidneys and liver. These assessments were carried out to confirm the health of the animals. The animals underwent abdominal USG. The evaluations were performed on dogs of different sexes, ages, and weights. The selected dogs exhibited no clinical signs and had normal hematological and biochemical test results and general physical examination findings. Because this was a single cross-sectional assessment, inferences about the actual health status or future development of diseases are limited. Clinical evaluationAnamnesis and physical examination were performed to assess the state of consciousness, degree of hydration, mucous membrane coloration, capillary refill time, rectal temperature, pulse rate, presence of palpable lymph nodes, blood glucose measurement using a portable glucometer, and cardiopulmonary auscultation. To measure SBP, a Doppler (DV 610® Veterinary Portable Vascular Doppler), sphygmomanometer, and cuffs with widths of 40% of the circumference of the thoracic limb, below the humerus-radius-ulnar joint, were used. Systolic blood pressure (SBP) was measured five times, with the highest and lowest values excluded so that an average of three measurements could be taken. Owners authorized the use of their animals by signing a two-sided informed consent form. Due to the nature of the study, which included only a single clinical, laboratory, and USG assessment, no prospective analysis was performed. As the animals were asymptomatic during the examinations, carrying out intestinal histological analysis was not feasible due to the need for biopsy, a more invasive procedure. Therefore, the dogs did not present sufficient indications during the evaluations in this study for them to be anesthetized to collect material by digestive endoscopy or celiotomy. Hematological and biochemical evaluation of the tumorBlood samples were collected for blood count and serum biochemistry. All tests were conducted in duplicate. The jugular vein was punctured, and 5 ml of blood was collected, 2 ml of which was transferred to the tube with the Ethylenediaminetetraacetic acid (EDTA) anticoagulant and 3 ml to the tube with the clot activator gel. Samples from the tube with the EDTA anticoagulant were used for the blood count. These samples were processed at the VH/UFG Clinical Pathology Laboratory. The blood count was performed using an automatic analyzer (Celltac α MEC 6550, Nihon Kohden®, Japan), which provided the parameters of total leukocyte count, erythrocyte count, hemoglobin, mean corpuscular volume (MCV), mean corpuscular hemoglobin concentration (MCHC), erythrocyte range (RDW)-CV, and total platelet count (PLT). Microhematocrit and refractometry techniques were used to analyze hematocrit and measure total plasma proteins (TPPs). Tubes containing clot-activating gel were centrifuged at 3,600 rpm for 5 mintues to obtain serum. The concentrations of ALT and creatinine were measured. All analyses were performed on fresh samples using an automated biochemistry device (CM 250, Wiener®, Argentina). The values obtained in this analysis were later confirmed by the BIO-200 semi-automated biochemical apparatus (Bio Plus®) using commercial reagent kits (Biotécnica® and Doles®). USG assessmentThe Mylab 30 Vet Gold Esaote® equipment was used for gastroduodenal USG evaluation, coupled to a multi-frequency microconvex transducer with a frequency of 5.0–8.0 MHz, depending on the physical size of the dog being examined. All animals were assessed by the same examiner. The animals were placed in dorsal decubitus, and a wide trichotomy of the abdomen was performed prior to the evaluation, and acoustic gel was applied to allow better contact with the skin. Initially, a general systematic assessment of the abdomen was performed to rule out alterations in the organs adjacent to the GIT. The size, shape, contour, echogenicity, and echotexture of the evaluated structures were assessed. The approach used for the examination sequence was ventrolateral from left to right, to assess the urinary vesicle, left kidney, left adrenal gland, spleen, stomach, liver and gallbladder, right kidney, right adrenal gland, duodenum, pancreas, jejunum, ileum, and colon. The abdominal lymph nodes were also assessed. The prostate and testicles (in non-castrated males), right and left ovaries, and uterus were assessed in females. In addition, the echogenicity of the left kidney was compared with that of the spleen, whereas that of the right kidney was compared with that of the liver. Animals that showed clinical and laboratory screening or imaging examination alterations, except those related to the GIT, were excluded. Based on the results of the USG, the animals were divided into two groups: group 1 (G1) consisting of 15 adult healthy dogs with no alterations on USG and group 2 (G2) consisting of 19 adult healthy dogs with alterations in the image of the gastrointestinal (GI) tract (stomach and/or intestines) verified on USG. The exclusion criteria were established as follows: among the 19 dogs in G2, even without clinical signs and alterations in the previous assessments, three animals showed impairment in the USG image of the spleen and liver in addition to alterations in the GIT, which suggested hepatopathy and splenopathy to be clarified. Another animal showed nephropathy due to increased echogenicity of the kidneys. Each group (G1 and G2) consisted of 15 dogs. No further clinical follow-up was performed on the excluded dogs; therefore, it is not possible to say whether their changes progressed clinically. The sample size was estimated using Sigma Plot based on a Student’s t test for independent samples, assuming normal distribution, a 5% significance level, 80% power, and an expected effect size of 0.1 cm between groups. This effect size was selected based on the magnitude of differences in gastrointestinal wall thickness observed in Winter et al. (2014), as well as preliminary data from our group’s pilot assessments. The SD was derived from the interquartile range (IQR) of Winter et al. (2014) using IQR/1.35, as recommended for asymmetrical data. Dogs with systemic USG changes were excluded to maintain homogeneity and reduce confounding. In G1 and G2, the GIT-focused USG recommended gastric assessment, topography, echogenicity, echotexture, filling, wall thickness, parietal stratification, contractions, and peristaltic movements. In the duodenal, jejunal, ileal, and colonic evaluation, topography, echogenicity, echotexture, filling, wall thickness, parietal stratification, contractions, and peristaltic movements were checked. The USG findings were tabulated along with the data of each animal, such as age and body weight. The recommendations and references of Gladwin et al. (2014) were used for USG of the intestinal segments and measurement of the layers. This study aimed to identify parietal stratification by visualizing the five layers of the intestinal wall and measuring them in centimeters. The diameters of the mucosa, submucosa, muscularis, and serosa were measured, in addition to all the layers. The criterion for determining alterations was total intestinal thickness (in centimeters) above the reference for the species according to weight. Statistical analysisDescriptive statistics were used to determine absolute and percentage frequencies, means, SD, SEM, and coefficient of variation. The Shapiro-Wilk test was used to establish normality. The unpaired and parametric data were subjected to the t test with Welch’s correction. In all analyses, differences were considered significant when p < 0.05. Pearson’s correlation test was used to evaluate the relationship between USG intestinal thickening and the following laboratory parameters: red blood cells, hemoglobin, hematocrit, MCV, MCHC, RDW, PLT, total leukocytes, rods, segmented leukocytes, eosinophils, lymphocytes, monocytes, TPP, Alanine aminotransferase (ALT) and creatinine. For interpretation, 0.00–0.19 was considered a very weak correlation, 0.2–0.39 a weak correlation, 0.4–0.69 a moderate correlation, 0.7–0.89 a strong correlation, and above 0.90 a very strong correlation. These reference values were considered when interpreting all the correlation tests. The data were evaluated, and graphs were generated using GraphPadPrism 10. Ethical approvalThis study was approved by the Animal Use Ethics Committee of the Federal University of Goiás under protocol number 057/20. ResultsGroup 1 (G1): asymptomatic dogs with no sonographic alterationsIn G1 (n=15), abdominal USG examinations were performed on dogs of different breeds, aged between 12 and 96 months (mean 54.13 ± 28.27 months). Weight ranged from 4.8 to 15 kg (mean 7.19 ± 3.4 kg). Of the dogs in this group, 53.3% (n=8/15) were male and 46.6% (n=7/15) were female. Regarding the group’s data, 73.3% (n=11/15) were not neutered, while 26.6% (n=4/15) were neutered. In terms of breeds, 53.3% (n=8/15) were non-defined breeds, 20.0% (n=4/15) were Dachshunds, 13.3% (n=2/15) were Pinschers, and 6.66% (n=1/15) were Poodles. In relation to the USG of the intestines (Fig. 1) of the animals in this group, all the segments were assessed and measured, which determined the criteria for assessing the thickness of the organ wall, which varied according to the age group and the weight or body condition of the animal, considering the influence of thickness based on the development of the organism. In addition to the wall thickness of the GIT components studied, the degree of filling by content was also assessed by imaging, and it was found that there was no relevant degree of filling in the stomach and intestinal loops in 100% (n=15/15) of the dogs. The measurements and calculations, as well as information on the G1 animals, are presented in Table 1. When assessing the filling, it was possible to determine whether the organs were contracted, partially dilated, or dilated. All 100% (n=15/15) did not have a significant level of gastric and intestinal fullness. Therefore, they were deemed dogs with contracted GIT components. USG of the duodenum showed that 100% (n=15/15) of the patients had an empty duodenal region on US. In the layer stratification pattern evaluation, in which it is possible to assess during the examination whether the five gastrointestinal layers are intact in their visualization, 100% (n=15/15) of the dogs maintained this parietal pattern. The layers evaluated in this analysis vary from hypoechogenic to hyperechogenic (depending on the layer and its composition).
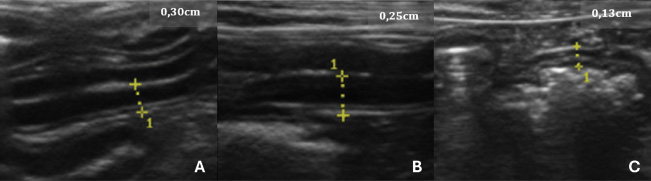
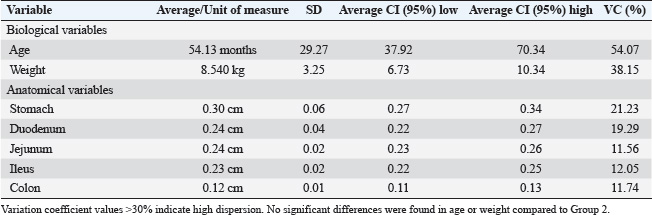
Fig. 1. USG images of the intestines of G1 dogs (asymptomatic without intestinal thickening). A, duodenum; B, jejunum; C, descending colon. The yellow dashed lines between the crosses indicate the measurements, and the values are shown in the top right-hand corner of each image. Table 1. Mean, SD, 95% confidence interval (CI), and variation coefficient (VC) for the biological (age, weight) and anatomical (stomach, duodenum, jejunum, ileus, colon) variables of dogs in Group 1 (without ultrasonographic intestinal thickening).
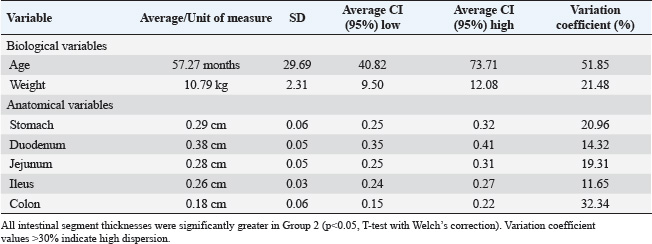
Contractions and peristaltic movements were also considered, but in G1, there were no alterations related to increased or reduced GIT motility observed by USG, thus 100% (n=15/15) of the cases. As for the echotexture of the stomach and intestines, 100% (n=15/15) were classified as homogeneous, and no heterogeneous findings were observed in this group. Similarly, there was no change in the echogenicity of the part of the GIT assessed, which defines the frequency of 100% (n=15/15). Group 2 (G2): asymptomatic dogs with alterations in the sonographyIn G2 (n=15), the age range was between 7 and 25 months (mean 57.20 ± 28.68 months). Weight ranged from 6.7 to 15 kg (average 7.9 ± 3.9 kg). Of the dogs in this group, 66.6% (n=10/15) were male and 33.3% (n=5/15) were female. Other information gathered in the previous anamnesis was that 60.0% (n=9/15) of the patients were not neutered, whereas 40.0% (n=4/15) had already been neutered. In terms of breeds, 46.6% (n=7/15) were non-defined breeds, 20.0% (n=4/15) were Schnauzers, 13.3% (n=2/15) were Maltese, and 6.66% (n=1/15) were York Shire Terriers. The animals in this group were healthy but had stomach and/or intestinal USG alterations. The measurements and calculations, as well as information on the G2 animals, are presented in Table 2. When assessing the thickness of the wall of the GIT layers, it was possible to see thickening in centimeters in association with those individuals in G2 who showed thickening in more than one gastrointestinal segment (Fig. 2) or in isolation, in which only one component of the structures analyzed was altered in the USG measurements. In G2, 100% (n=15/15) of the dogs had one or more parts of the GIT thickening. The G2 dogs showed higher values in the intestinal wall USG measurement compared to G1. The differences in the values for the duodenum, jejunum, ileum, and colon were significant in the mean comparison tests (p < 0.05) (Fig. 3). The variables obtained in the G2 group were analyzed using Pearson’s correlation test, which correlated the thickness of different intestinal segments with laboratory variables. This was done with the keratometric parameters, leukometry data, TPPs, and serum biochemistry. Table 2. Mean, SD, 95% confidence interval (CI), and variation coefficient (VC) for the biological (age, weight) and anatomical (stomach, duodenum, jejunum, ileus, colon) variables of dogs in Group 2 (with ultrasonographic intestinal thickening).
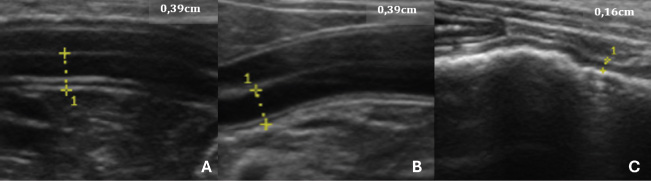
Fig. 2. USG images of the intestines of G2 dogs (asymptomatic with intestinal thickening). A, duodenum; B, jejunum; C, descending colon. The yellow dashed lines between the crosses indicate the measurements, and the values are shown in the top right-hand corner of each image. The average values for the laboratory data of the G2 animals were 7.2 (×106/μl) red blood cells, 17.02 mg/dl hemoglobin, 49.58% hematocrit, 71.52 fL MCV, 33.55% MCHC, 13.82% RDW, 294.12 (×103/μl) platelets, 8904.16 μl of total leukocytes, 17.33 μl of rod neutrophils, 6205.91 μl of segmented neutrophils, 298.29 μl of eosinophils, 2162.62 μl of lymphocytes, 219.5 μl of monocytes, 6.52 mg/dl TPPs, 1.12 mg/dl serum creatinine, and 45.75 UI/l alanine aminotransferase. The basophil value was removed from the analysis as no cell was found in the peripheral blood of any of the animals in this study. The colon wall measurement value used for the tests was the highest among those that were above the reference for the species, as recommended by Gladwin et al. (2014). This intestinal segment comprises an ascending, descending, and transverse portion.
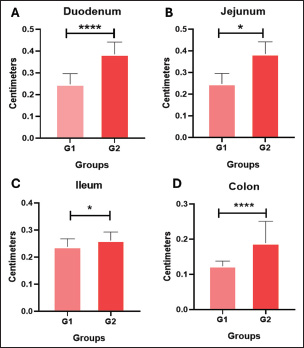
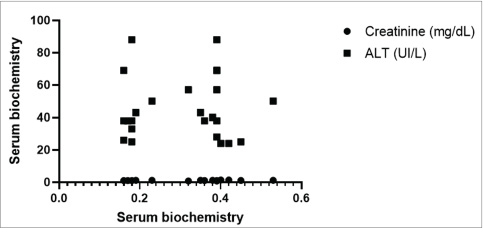
Fig. 3. Mean values and SD of intestinal wall measurements in dogs from G1 to G2. A Comparison between the duodenum, B comparison between the jejunum, C comparison between the ileum, and D comparison between the colon. Data evaluated using the Shapiro-Wilk normality test were analyzed using the t test with Welch’s correction (**p < 0.05; ****p < 0.0001). The blood count, specifically the erythrogram, analyzed the values of red blood cells, hematocrit, hemoglobin concentration, hematemetic indices, and the number of platelets, correlated with the measurement of the thickened intestinal segments. For the variables analyzed, there was no statistically significant difference (p < 0.05), and the correlation coefficient closest to 1 was that corresponding to the hematocrit value (r=0.2937), indicating that the correlations were weak between the variables analyzed. The last correlation (hematocrit and intestinal thickness) had the lowest p-value and was the parameter closest to being statistically relevant (p=0.1637). There was only one negative r coefficient, which determined a weak relationship with the suggestion that they were inversely proportional. This was found in the platelet analysis (r=−0.009438 and p=0.9651). The scatter diagram for these analyses did not show a homogeneous linear distribution between the variables (Fig. 4). For the leukogram and proteinogram variables, there was no statistically significant difference (p < 0.05), and the correlation coefficient closest to 1 was that corresponding to the value of the rods (r=0.07882), with a p-value of 0.7143. Figure 5 shows the dispersion diagram of the analyses. Total leukocytes, segmented leukocytes, eosinophils, lymphocytes, and monocytes showed a weakly negative r coefficient. For the serum biochemistry variables, there was no statistically significant difference (p < 0.05), with a p-value of 0.3023 and an r coefficient of 0.2197 for the correlation between intestinal thickening and creatinine. Despite the weak correlation, the r value was less distant from the strong correlation value, and the p value was closer to the reference for statistical significance. Conversely, for the correlation between intestinal thickness and ALT, the r was 0.008461 and p was 0.9687. The scatter diagram of the analysis is shown in Figure 6.
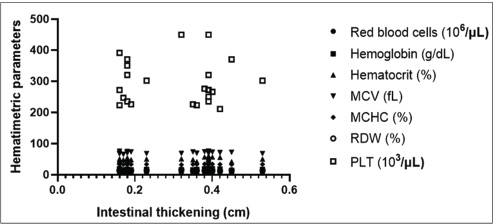
Fig. 4. Correlation graph between intestinal wall thickness and hematological parameters, showing no significant linear association.
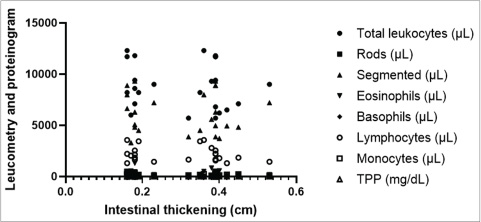
Fig. 5. Scatter plot displaying the correlation of laboratory results used to detect trends related to intestinal thickening in dogs. The dispersion is non-linear and non-progressive, with markers accumulating at various points on the diagram, indicating discrepancies in the analyzed variables’ references.
Fig. 6. Scatter plot illustrating the correlation of laboratory results used to detect trends related to intestinal thickening in dogs. The dispersion is nonlinear and nonprogressive. Notably, for the same intestinal measurement value among individuals, enzymatic values varied, deviating from linearity. DiscussionUSG of the GIT dynamically shows the intestinal segments (Penninck et al., 1989; Delaney et al., 2003). The examination made it possible to measure the intestinal layers in dogs, which is in line with the findings of previous studies. The results obtained between the groups reinforce the literature, suggesting that intestinal thickness measured by USG can serve as a potential indicator of disease. However, as observed in the results presented here, this information alone is not enough to predict the diagnostic etiology, indicating the possibility of specific alterations not associated with specific diseases. Therefore, the authors suggest that repeated follow-up examinations could provide a clearer understanding of intestinal thickening. Changes in the thickness of the intestinal wall are usually descriptive of diseases and are therefore seen in symptomatic individuals (Penninck et al., 1989; Le Roux et al., 2016). This contrasts with the study described here, which used asymptomatic dogs seen in a hospital routine, with unchanged laboratory tests and USG intestinal thickening. In this way, the findings found here are different from those mentioned by the authors, but the assessment carried out cannot rule out a one-off fluctuation seen as an USG alteration. Histopathology is indicated to help clarify the findings, but as these were asymptomatic dogs, an intestinal biopsy was not possible. At the end of the experiment, no information was found to justify the changes in the intestinal USG appearance in the G2 dogs. This corroborates the fact that little information is available on the USG appearance of enlarged intestinal layers in dogs (Moon et al., 2003). The animals examined did not show any clinical signs of digestive system involvement. Therefore, it is not possible to infer that there was an underlying disease. This differs from the findings of Penninck et al. (2003), who reported that clinical enteritis is often seen in moderate to severe GIT thickening. It is known that there was no clinical or laboratory evidence of tissue inflammation in the intestines in the animals described, but histopathological examination was not performed to confirm this. The authors acknowledge that the lack of histological evaluation limits the impact of the obtained results. However, we reinforce the relevance of this research as a starting point for more robust studies with a larger number of animals, periodic evaluations, increased correlations, and comparison with histology. In G2, the age ranged from 7 to 25 months (mean 57.20 ± 28.68 months), and the weight ranged from 6.7 to 15 kg (mean 7.9 ± 3.9 kg). In this study, no data were analyzed to conclude a higher prevalence of IU thickening considering gender, age group, and body weight. Older publications on USG standardization of GIT measurements in dogs used the Beagle breed (Penninck et al., 1989). Although this is not a study using the same correlation methodology, these variations suggest that intestinal sonographic alterations can be seen in the absence of clinical manifestations and laboratory alterations, regardless of the underlying cause. These findings may be representative of enteropathies, highlighting the need for complementary assessments. Therefore, USG is a potentially early test to check for intestinal alterations. This study clarified the relationship between IU measurements and hematological and biochemical values in dogs. However, these animals, which were clinically considered healthy, showed an increase in intestinal segment thickness. This contrasts with the available literature, which shows altered USG findings in dogs with specific diseases, such as chronic inflammatory enteropathy (CIE) (Gouvêa et al., 2020) and intestinal lymphangiectasia (Malacuns, 2021). However, materials that indicate reference values are based on experiments on healthy animals (Gladwin et al., 2014). However, these animals have values determined by frequency tests and have undergone USG monitoring for a prolonged period (Gladwin et al., 2014). This contrasts with the one-off assessment made in the present experimental design. Furthermore, it cannot be ruled out that the animals in this study did not have the diseases mentioned by the authors in the early stages or that they were asymptomatic at the time the tests were carried out. Some studies link USG evaluation with other diagnostic modalities, such as Malacuns (2021), who published on a type of protein-losing enteropathy. This work contrasts with the results obtained here because changes in the intestinal structure of dogs with intestinal lymphangiectasia are expected, which is reflected in USG and endoscopic findings. However, this difference raises the hypothesis that the animals in this study could present macroscopic alterations seen at endoscopy even in the asymptomatic phase. Although it was not possible to confirm the alterations, since there was USG thickening, endoscopic findings were probably present. In this sense, possible associations and complements between the two tests can be implied. In contrast to the use of a few variables determined by complementary exams in this analysis, specific studies on the use of USG in dogs with clinical GI symptoms have used other parameters, as observed in two studies on chronic diarrhea (Leib et al., 2012; Mapletoft et al., 2018) and one on chronic vomiting (Malancus and Malancus, 2017). It should be noted that this study disagrees with the results described here because it used non-healthy animals and because it did not generate a correlation coefficient. The results contradict data in the literature (Leib et al., 2012) when the evaluation is carried out on animals with diseases of the GIT, in which there is a nonspecific correlation or, in case studies, the simultaneous presence of USG alterations and laboratory data. However, clinical studies (Gladwin et al., 2014) that proposed reference values for the layers of the GIT wall considered healthy dogs based on clinical and laboratory evaluation. Although these studies did not establish a relationship between variables, similarities can be noted with the work carried out here. In addition, the authors of experiments and case studies (Leib et al., 2012; Malancus and Malancus, 2017; Martinez et al., 2018; Mapletoft et al., 2018) have reported the absence of alterations in hematology and biochemistry even in dogs with gastroenteropathies without a statistical evaluation of the relationship, which is partially consistent with what was reported here, given that there were no clinical signs and a limited biochemical evaluation was used. The results of G2 pointed to findings that can be seen in other reports (Malancus and Malancus, 2017; Gouvêa et al., 2020; Malacuns, 2021) but which do not occur in other studies in the literature. One report of a dog with CIE (Gouvêa et al., 2020) showed jejunal thickening with no changes in the erythrogram or serum creatinine levels, which can be seen in the four animals in G2 that showed jejunal thickening with no laboratory changes. However, the same animal (Malacuns, 2021) had clinical limb edema and vomiting, and tests showed lymphopenia, hypoalbuminemia, and thrombocytosis, all of which contrasted with the animals in G2. The same study cites another case of CIE (Gouvêa et al., 2020) with duodenal thickening without alterations in serum liver and kidney biochemistry or leukometry, similar to the dogs in the present study, but in contrast, anemia, hypoalbuminemia, hypocholesterolemia, and thrombocytosis were observed. Correlation coefficients between intestinal thickness and blood count in G2 were low (r < 0.2) and not statistically significant (p > 0.05). Similar patterns have been reported in animals with intestinal diseases, such as CIE and alimentary lymphoma, where hematological alterations are often absent or inconsistent (Parachini-Winter et al., 2019). The biochemical evaluation included the systemic markers creatinine and ALT, which remained within normal ranges. Clinical data from Gouvêa et al. (2020) suggest that these enzymes may not reflect intestinal abnormalities, while other markers, such as cholesterol and albumin, which were not assessed here, might show greater diagnostic sensitivity (Leib et al., 2012; Gouvêa et al., 2020; Malacuns, 2021). This lack of statistical significance supports the notion that routine hematological and biochemical tests may be insufficiently sensitive to detect localized or subclinical gastrointestinal changes, especially in asymptomatic individuals. Parameters such as creatinine, ALT, and cell counts are systemic indicators that may remain unaltered despite early intestinal involvement. Moreover, the complex physiology of the GIT suggests that structural or inflammatory changes may precede detectable systemic responses. Thus, ultrasonography and laboratory testing may serve as complementary tools rather than overlapping diagnostics in the evaluation of clinically healthy dogs. Moreover, the weak correlations observed (r ≈ 0) may also reflect the limited sample size and reinforce the need for larger studies to identify subtle or clinically relevant associations. Although not statistically significant, these findings suggest that meaningful relationships may exist but require greater statistical power for detection. The limited sample size reduces the statistical power of the study and may have hindered the detection of small to moderate correlations. Furthermore, the cross-sectional design restricts the ability to establish causal relationships or assess the progression of the observed USG alterations over time. This study was limited by the lack of intestinal biopsy and subsequent histopathological confirmation, the small number of laboratory tests for further correlations, and the lack of prospective evaluation because the animals were not followed up when clinical symptoms appeared. Unlike the studies that associated USG evaluation with endoscopic biopsy (Malancus and Malancus, 2017) and those in which the USG study of the wall of the GIT segments was conducted prospectively with serial evaluation (Gladwin et al., 2014). At the end of the analysis, it was not possible to determine the justification for alterations in intestinal USG thickness in healthy dogs, nor was it possible to infer predictive or trend factors based on the variables used. There are no similar studies in the literature carried out with dogs, but one study (Winter et al., 2014) used the feline species for USG of the gastrointestinal layers in animals with and without clinical signs, and changes in intestinal thickening were found even in healthy animals. Similar to the study (Winter et al., 2014), the possibilities described for the alterations found were related to the lack of monitoring of the animals, the difference in diet and the influence of the food components exposed on the intestinal mucosa, and the lack of confirmation by intestinal biopsy and histopathology (Winter et al., 2014). Intestinal thickening in asymptomatic dogs, as observed in this study, diverges from the traditional understanding that associates such findings with overt gastrointestinal disease. Several factors may help explain these discrepancies. First, some dogs may have been in an early or subclinical phase of intestinal disease, which was not yet detectable by standard laboratory tests. Second, based on genetic background, breed predisposition, or even intestinal microbiota profiles, physiological variations may occur between individuals, which are not routinely assessed. Moreover, although no significant associations were observed between intestinal thickness and age, sex, or body weight, this lack of difference does not exclude the potential influence of these variables. Genetic variability, hormonal factors, body composition, and environmental influences, such as diet, stress, or exposure to subclinical pathogens, could all contribute to intestinal wall measurement variation. These hypotheses highlight the complexity of interpreting ultrasonographic findings in clinically normal animals and reinforce the need for future multifactorial analyses. ConclusionBased on the obtained data, the increase in intestinal USG thickness in dogs does not correlate with routine laboratory parameters, making it difficult to identify predictive hematological or biochemical markers in asymptomatic animals. However, several limitations must be considered when interpreting these findings: small sample size, absence of intestinal histopathology, restricted panel of laboratory tests, and cross-sectional design without longitudinal follow-up. These factors may limit the detection of subtle associations or early disease processes. Despite these constraints, the presence of intestinal thickening in clinically normal dogs highlights the potential role of USG as a sensitive imaging tool for early or subclinical gastrointestinal changes. Prospective studies, including larger populations, serial evaluations, histopathological confirmation, and broader biomarker panels, are needed to clarify the clinical significance of these ultrasonographic findings. AcknowledgmentsThe Veterinary and Zootechnical School of the Federal University of Goiás, Goiás, Brazil. Conflict of interestThe authors declare no conflicts of interest in this study. FundingThis study did not receive any specific grants. Authors’ contributionConceptualization: I. M. O., N. C. B., and W. P. R. S.; Methodology: I. M. O. and W. P. R. S.; Formal analysis: N. C. B.; Data curation: I. M. O., W. P. R. S., C. V. M. S., S. S. F. A., M. A. M. S., A. F. M. B., and D. B. M. Drafted the manuscript: I. M. O.; revised the manuscript: N. C. B., M. A. M. S., A. F. M. B., and D. B. M.; and translated the manuscript: I. M. O. and N. C. B. All authors have read and approved the published version of the manuscript. Data availabilityAll data supporting this study’s findings are available within the manuscript. ReferencesAgut, A. 2009. Ultrasonography of the small intestine in small animals. Vet. Focus 19, 20–28. Alves, F.R., Costa, F.B., Arouche, M., Barros, A.C., Miglino, M.A., Vulcano, L.C. and Guerra, P.C. 2007. Avaliação ultrassonográfica do sistema urinário, fígado e útero do macaco-prego, Cebus apella. Pesq. Vet. Bras. 27, 377–382. Baker, J.A. and Soo, M.S. 2002. Breast US: assessment of technical quality and image interpretation. Radiology 223, 229–238. Banzato, T., Milani, C., Zambello, E. and Zotti, A. 2017. Normal ultrasonographic reference values for the gastrointestinal tract in developing puppies. Res. Vet. Sci. 115, 371–373. Collins‐Webb, A.G., Chong, D.L.A. and Cooley, S.D. 2023. Ultrasonographic intestinal muscularis thickening in dogs with histologically confirmed inflammatory bowel disease: 13 cases (2010–2021). Vet. Radiol. Ultrasound 64, 345–350. Delaney, F., O’Brien, R.T. and Waller, K. 2003. Ultrasound evaluation of small bowel thickness compared to weight in normal dogs. Vet. Radiol. Ultrasound 44, 577–580. Fitzgerald, E., Barfield, D., Lee, K.C.L. and Lamb, C.R. 2017. Clinical findings and results of diagnostic imaging in 82 dogs with gastrointestinal ulceration. J. Small Anim. Pract. 58, 211–218. Gladwin, N.E., Penninck, D.G. and Webster, C.R.L. 2014. Ultrasonographic evaluation of the thickness of the wall layers in the intestinal tract of dogs. Am. J. Vet. Res. 75, 349–353. Gouvêa, F.N., Pennacchi, C.S., Assaf, N.D., Arantes, E.A.L., Stefaniszen, A.G., Vieira, E.M., Genari, V., Guimarães-Okamoto, P.T.C. and Melchert, A. 2020. Doença inflamatória intestinal em cães - Relatos de casos. Ars Vet. 36, 332–336. Jang, H., Kim, S.W., Lee, J.W., Kim, M. and Jung, D.I. 2025. Idiopathic intestinal smooth muscle hyperplasia in a French Bulldog: clinical, imaging, capsule endoscopy, and histopathological findings. Animals 15, 1199–1207. Larson, M.M. and Biller, D.S. 2009. Ultrasound of the gastrointestinal tract. Vet. Clin. North Am. Small Anim. Pract. 39, 747–759. Le Roux, A.B. 2015. Correlation of ultrasonographic small intestinal wall layering with histology in normal dogs. [Thesis]. 68f. Available via https://digitalcommons.lsu.edu/gradschool_theses/1148. Le Roux, A.B., Granger, L.A., Wakamatsu, N., Kearney, M.T. and Gaschen, L. 2016. Ex vivo correlation of ultrasonographic small intestinal wall layering with histology in dogs. Vet. Radiol. Ultrasound 57, 534–545. Leib, M.S., Larson, M.M., Grant, D.C., Monroe, W.E., Troy, G.C., Panciera, D.L., Rossmeisl, J. H. and Werre, S.R. 2012. Diagnostic utility of abdominal ultrasonography in dogs with chronic diarrhea. J. Vet. Intern. Med. 26, 1288–1294. Malancus, R.N. 2021. Ultrasound and endoscopic findings in dogs with lymphangiectasia. Arq. Bras. Med. Vet. Zootec. 73, 49–54. Malancus, R.N. and Malancus, C.M. 2017. Assessment of ultrasonographic and endoscopic changes in dogs with gastrointestinal disorders. Arq. Bras. Med. Vet. Zootec. 69, 1451–1455. Mapletoft, E.K., Allenspach, K. and Lamb, C.R. 2018. How useful is abdominal ultrasonography in dogs with diarrhoea? J. Small Anim. Pract. 59, 32–37. Martinez, M., Pallares, F.J., Soler, M. and Agut, A. 2018. Relationship between ultrasonographic and histopathological measurements of small intestinal wall layers in fresh cat cadavers. Vet. J. 237, 1–8. Mattoon, J. and Nyland, T. 2014. Small animal abdominal ultrasound, 3rd ed. Philadelphia: Saunders-Elsevier, pp: 200–210. Moon, M.L., Biller, D.S. and Armbrust, L.J. 2003. Ultrasonographic appearance and etiology of corrugated small intestine. Vet. Radiol. Ultrasound 44, 199–203. Oliveira, I.M., da Silva, W.P.R. and Borges, N.C. 2025. B-mode and contrast-enhanced ultrasonography for intestinal assessment in dogs: a review. Open Vet. J. 15, 1066–1077. Parachini-Winter, C., Carioto, L.M. and Gara-Boivin, C. 2019. Retrospective evaluation of anemia and erythrocyte morphological anomalies in dogs with lymphoma or inflammatory bowel disease. J. Am. Vet. Med. Assoc. 254, 487–495. Penninck, D. 2008. Gastrointestinal tract. In Atlas of small animal ultrasonography. Eds., Penninck, D. and D’Anjou, M.A. Iowa: Blackwell Publishing, pp: 281–318. Penninck, D.G., Nyland, T.G., Fisher, P.E. and Kerr, L.Y. 1989. Ultrasonography of the normal canine gastrointestinal tract. Vet. Radiol. 30, 272–276. Penninck, D.G., Smyers, B. and Webster, C.R.L. 2003. Diagnostic value of ultrasonography in differentiating enteritis from intestinal neoplasia in dogs. Vet. Radiol. Ultrasound 44, 570–575. Rafael, P., Soulé, C., Sériot, P., Gibert, S., Blond, L., Baudin-Tréhiou, C. and Griffeuille, E. 2024. Evaluation of early and systematic ultrasound examination to determine postoperative dehiscence after small intestinal surgery (114 cases in dogs and cats). J. Am. Vet. Med. Assoc. 263, 1–10. Available via https://pubmed.ncbi.nlm.nih.gov/39366412/ Silva, L.C., Frey, B.A., Machado, V.M.V. and Vulcano, L.C. 2013. Avaliação ultrassonográfica gástrica em pequenos animais. Vet. Zootec. 1, 567–575. Stander, N., Wagner, W.M., Goddard, A. and Kirberger, R. 2010a. Normal canine pediatric gastrointestinal ultrasonography. Vet. Radiol. Ultrasound 51, 75–78. Stander, N., Wagner, W.M., Goddard, A. and Kirberger, R.M. 2010b. Ultrasonographic appearance of canine parvoviral enteritis in puppies. Vet. Radiol. Ultrasound 51, 69–74. Winter, M.D., Londono, L., Berry, C.R. and Hernandez, J.A. 2014. Ultrasonographic evaluation of relative gastrointestinal layer thickness in cats without clinical evidence of gastrointestinal tract disease. J. Feline Med. Surg. 16, 118–124. | ||
| How to Cite this Article |
| Pubmed Style Oliveira IM, Almeida SSFD, Sprícigo CVM, Silva WPRD, Silva MAM, Botelho AFM, Martins DB, Borges NC. Correlation between the ultrasonographic measurement of intestinal thickening and laboratory parameters in asymptomatic dogs. Open Vet. J.. 2025; 15(8): 3798-3808. doi:10.5455/OVJ.2025.v15.i8.45 Web Style Oliveira IM, Almeida SSFD, Sprícigo CVM, Silva WPRD, Silva MAM, Botelho AFM, Martins DB, Borges NC. Correlation between the ultrasonographic measurement of intestinal thickening and laboratory parameters in asymptomatic dogs. https://www.openveterinaryjournal.com/?mno=244670 [Access: January 25, 2026]. doi:10.5455/OVJ.2025.v15.i8.45 AMA (American Medical Association) Style Oliveira IM, Almeida SSFD, Sprícigo CVM, Silva WPRD, Silva MAM, Botelho AFM, Martins DB, Borges NC. Correlation between the ultrasonographic measurement of intestinal thickening and laboratory parameters in asymptomatic dogs. Open Vet. J.. 2025; 15(8): 3798-3808. doi:10.5455/OVJ.2025.v15.i8.45 Vancouver/ICMJE Style Oliveira IM, Almeida SSFD, Sprícigo CVM, Silva WPRD, Silva MAM, Botelho AFM, Martins DB, Borges NC. Correlation between the ultrasonographic measurement of intestinal thickening and laboratory parameters in asymptomatic dogs. Open Vet. J.. (2025), [cited January 25, 2026]; 15(8): 3798-3808. doi:10.5455/OVJ.2025.v15.i8.45 Harvard Style Oliveira, I. M., Almeida, . S. S. F. D., Sprícigo, . C. V. M., Silva, . W. P. R. D., Silva, . M. A. M., Botelho, . A. F. M., Martins, . D. B. & Borges, . N. C. (2025) Correlation between the ultrasonographic measurement of intestinal thickening and laboratory parameters in asymptomatic dogs. Open Vet. J., 15 (8), 3798-3808. doi:10.5455/OVJ.2025.v15.i8.45 Turabian Style Oliveira, Iago Martins, Sara Sueli Ferreira De Almeida, Carolle Vieira Muterlle Sprícigo, Wanessa Patrícia Rodrigues Da Silva, Marco Augusto Machado Silva, Ana Flávia Machado Botelho, Danieli Brolo Martins, and Naida Cristina Borges. 2025. Correlation between the ultrasonographic measurement of intestinal thickening and laboratory parameters in asymptomatic dogs. Open Veterinary Journal, 15 (8), 3798-3808. doi:10.5455/OVJ.2025.v15.i8.45 Chicago Style Oliveira, Iago Martins, Sara Sueli Ferreira De Almeida, Carolle Vieira Muterlle Sprícigo, Wanessa Patrícia Rodrigues Da Silva, Marco Augusto Machado Silva, Ana Flávia Machado Botelho, Danieli Brolo Martins, and Naida Cristina Borges. "Correlation between the ultrasonographic measurement of intestinal thickening and laboratory parameters in asymptomatic dogs." Open Veterinary Journal 15 (2025), 3798-3808. doi:10.5455/OVJ.2025.v15.i8.45 MLA (The Modern Language Association) Style Oliveira, Iago Martins, Sara Sueli Ferreira De Almeida, Carolle Vieira Muterlle Sprícigo, Wanessa Patrícia Rodrigues Da Silva, Marco Augusto Machado Silva, Ana Flávia Machado Botelho, Danieli Brolo Martins, and Naida Cristina Borges. "Correlation between the ultrasonographic measurement of intestinal thickening and laboratory parameters in asymptomatic dogs." Open Veterinary Journal 15.8 (2025), 3798-3808. Print. doi:10.5455/OVJ.2025.v15.i8.45 APA (American Psychological Association) Style Oliveira, I. M., Almeida, . S. S. F. D., Sprícigo, . C. V. M., Silva, . W. P. R. D., Silva, . M. A. M., Botelho, . A. F. M., Martins, . D. B. & Borges, . N. C. (2025) Correlation between the ultrasonographic measurement of intestinal thickening and laboratory parameters in asymptomatic dogs. Open Veterinary Journal, 15 (8), 3798-3808. doi:10.5455/OVJ.2025.v15.i8.45 |

