




| Research Article | ||
Open Vet. J.. 2026; 16(8): 5422-5433 !
Open Veterinary Journal, (2026), Vol. 16(8): 5422–5433 Research Article NAFLD animal model: HFD-C with fructose in male Sprague–Dawley ratsJenny Novina Sitepu1,2*, Hery Djagat Purnomo3, Neni Susilaningsih4, Udadi Sadhana5, Endang Mahati1 and Banundari Rachmawati11Doctoral Study Program of Medical and Health Science, Faculty of Medicine, Universitas Diponegoro, Semarang, Indonesia 2Faculty of Medicine, University of HKBP Nommensen, Medan, Indonesia 3Division of Gastroentero-Hepatology, Internal Medicine, Kariadi Hospital, Universitas Diponegoro, Semarang, Indonesia 4Department of Anatomy and Histology, Faculty of Medicine, Universitas Diponegoro, Semarang, Indonesia 5Department of Pathology Anatomic, Faculty of Medicine, Universitas Diponegoro, Semarang, Indonesia *Corresponding Author: Jenny Novina Sitepu. Doctoral Study Program of Medical and Health Science, Faculty of Medicine, Diponegoro University, Semarang, Indonesia. Email: jennysitepu [at] uhn.ac.id Submitted: 20/02/2026 Revised: 03/06/2026 Accepted: 15/06/2026 Published: 08/08/2026 © 2025 Open Veterinary Journal
AbstractBackground: A good animal model was essential to understand the mechanism of non-alcoholic fatty liver (NAFLD). It was needed to explore the NAFLD drug candidate target. Aim: This study aimed to determine the optimal fructose concentration and induction period for the NAFLD animal model. Methods: A total of 28 adult male Sprague–Dawley rats were divided randomly into seven groups: standard diet (control, P1), three groups high-fat diet with cholesterol (HFD-C) with 30% w/v fructose for 4 weeks (P2), 6 weeks (P3), 8 weeks (P4), and three other groups HFD-C with 60% w/v fructose for 4 weeks (P5), 6 weeks (P6), and 8 weeks (P7). The blood sample and liver tissue were collected at the end of each period. We used spectrophotometry to measure the transaminase enzyme and metabolic parameter concentrations. Liver tissue was evaluated for steatosis activity and fibrosis. Results: The steatosis of HFD-C with fructose groups (P2, P3, P4, P5, P6, and P7) were significantly higher than control group (p < 0.05). The ballooning of HFD-C with fructose (P3, P4, P5, P6, and P7) was significantly higher than control (p < 0.05). Ballooning of HFD-C with 30% w/v fructose increased with a prolonged period (p < 0.05). The inflammation of all the tested groups was higher than that of the control (p < 0.05). The fibrosis only appeared in the 8-week group; fibrosis in P7 was significantly higher than in the control (p < 0.05). The AST of P4, P5, P6, and P7 was higher than the control (p < 0.05), but not the ALT. The TC and LDL-C levels were raised in all HFD-C with fructose groups, but only the 8-week HFD-C with 30% w/v fructose group was higher than the control (p < 0.05). Triglyceride levels also showed the same pattern as TC and LDL-C levels. The glucose level in the HFD-C with fructose groups was also higher than that of the control group. There was no statistically significant difference between 30% w/v and 60% w/v fructose at the same period. Conclusion: The Sprague–Dawley rat fed HFD-C with 30% w/v fructose for 4 weeks showed early-stage features of NAFLD, and the Sprague–Dawley rat fed HFD-C with 60% w/v fructose for 8 weeks showed more progressive NAFLD but still early fibrosis. Keywords: Animal model, Fatty liver, NAFLD, Sprague–Dawley. IntroductionNon-alcoholic fatty liver (NAFLD) is a condition where excess fat builds up in the liver of people who do not consume alcohol (Chalasani et al., 2018; Eslam, 2020). The diagnosis of NAFLD is confirmed if steatosis is accompanied by at least one metabolic disorder without alcohol consumption or other liver disease history (Eslam, 2020). NAFLD is divided into two types, that is, simple fatty liver (NAFL) and non-alcoholic steatohepatitis (NASH) (Chalasani et al., 2018; Parthasarathy et al., 2020) . NAFL is the presence of at least 5% steatosis without sufficient inflammation and hepatocellular injury. In the initial stage, steatosis emerges in the centrilobular (acinar zone 3) position and predominantly macro-vesicular steatosis (Chalasani et al., 2018; Brunt et al., 2021). Steatohepatitis is characterized by a variable degree of steatosis, hepatocyte ballooning (Denk et al., 2019; Brunt et al., 2021), and inflammation (Chalasani et al., 2018; Flessa et al., 2022). Most of the steatosis in steatohepatitis contains cytoplasmic inclusions, termed Mallory-Denk bodies (Denk et al., 2019; Brunt et al., 2021). The global prevalence of NAFLD has increased constantly (Younossi, 2018; Estes et al., 2020; Golabi et al., 2021; Hamid et al., 2022). However, the definitive pharmacological therapy for NAFLD has not been approved yet (Ferguson and Finck, 2021). Therefore, NAFLD therapy is needed to address the NAFLD problem globally. An animal study is crucial in learning the NAFLD mechanisms. Mechanism understanding is important to find an NAFLD drug candidate target. An ideal animal model was necessary to achieve this goal (Denk et al., 2019; Jiang et al., 2019; Hundertmark, 2020). A good animal model should reflect the NAFLD pathophysiology in humans (Denk et al., 2019; Jahn et al., 2019). There were four ways to induce NAFLD, that is, genetic, dietary, and chemical-mechanically induced (Denk et al., 2019; Jahn et al., 2019; Jiang et al., 2019; Hundertmark, 2020). The dietary-induced model can mimic the NAFLD mechanism in humans metabolically. Oral fructose given with a high-fat diet (HFD) or a high-fat diet with cholesterol (HFD-C) increased NAFL progressivity (Carreres et al., 2021; Eng and Estall, 2021). However, there was no standard fructose regimen in the NAFLD animal model yet (Flessa et al., 2022). Most of the previous studies use HFD-C or HFHF (high-fat, high-fructose) diet alone to induce NAFLD in rodents (Ichimura et al., 2015; García-Lezana et al., 2018; Haldrup et al., 2018; Yin, 2019; Omagari et al., 2020 ; Chiang Morales et al., 2022). A previous study induced NAFLD in Wistar rats by HFD-C, which contains 49% fat and 1.25% cholesterol with 15% fructose, but this study did not evaluate transaminase enzymes and liver histopathology (Henkel et al., 2019) . Another study reported that mice fed the AMLN diet, which contains 40% fat, 40% carbohydrate, 22% fructose, and 2% cholesterol for 20–30 weeks, showed significant steatosis, mild inflammation, and weak hepatocellular ballooning (Tetri, 2008). Sprague–Dawley rats are more susceptible to NAFLD induced by diet than Wistar rats and mice (Zhong et al., 2020). An ideal concentration of cholesterol in diet-induced NAFLD was 0.5%–1%. The HFD with 10%–30% w/v fructose liquid is known to induce steatosis, whereas the HFD with 60% fructose liquid induces steatosis and fibrosis (Eng and Estall, 2021). In this study, we use the HFD-C diet that contains 62.5% fat and 0.5% cholesterol by calorie, combined with fructose liquid in two concentrations, that is, 30% w/v and 60% w/v. We gave the diet induction in three different periods, so we can evaluate the difference in NAFLD not only by fructose concentration but also by diet induction period. Materials and MethodsThis preliminary study was a randomized control group posttest-only design involving adult male Sprague–Dawley rats aged 6–8 weeks, conducted at the Integrated Laboratory for Research and Testing of Universitas Gajah Mada for 8 weeks. A total of 28 adult male Sprague–Dawley rats were divided into seven groups randomly: standard diet and water drink as control group (P1), HFD-C with 30% w/v fructose for 4 weeks (P2), 6 weeks (P3), and 8 weeks (P4), HFD-C with 60% w/v fructose for 4 weeks (P5), 6 weeks (P6), and 8 weeks (P7) respectively. The HFD-C diet contains 62.5% fat and 0.5% cholesterol by total calories, given orally by oral gavage. Fructose solution was provided as a drink that could be freely accessed ad libitum by the rats. The HFD-C rats were also given some standard chow to satisfy their chewing habit. At the end of each period, blood samples were collected to measure the transaminase enzyme and metabolic parameter concentrations. The metabolic parameters were total cholesterol (TC), low-density lipoprotein cholesterol (LDL-C), high-density lipoprotein cholesterol (HDL-C), triglycerides (TG), and glucose. The transaminase enzyme and metabolic parameters were measured by the spectrophotometry method. The rats were terminated to retrieve their liver organ sample. The rats were injected with 80mg/kg body weight of Ketamine intraperitoneally. After the rat was anesthetized, we performed cervical dislocation to ensure that the rat couldn’t revive. The liver tissue was colored by hematoxylin and eosin, then evaluated to get the steatosis activity and fibrosis (SAF) score. The SAF score evaluates steatosis, activity (i.e., ballooning and inflammation), and fibrosis of liver tissue. Steatosis score is 0 for steatosis <5%, 1 for 5%–33%, 2 for 34%–66%, and 3 for >66%. Ballooning score is 0 for no ballooning, 1 for ballooning without hepatocyte enlargement, and 2 for ballooning with hepatocyte enlargement. Inflammation score is 0 for no inflammation, 1 for 1–2 foci of inflammation, and 2 for >2 foci of inflammation. Fibrosis score is 0 for no fibrosis, 1 for perisinusoidal or portal fibrosis, 2 for both fibrosis (perisinusoidal and portal), 3 for fibrosis perisinusoidal and portal with bridging, and 4 for cirrhosis. Two histopathologists evaluated the liver tissues and reported the SAF score. The evaluators were blinded to group allocation to avoid research bias. The kappa coefficient value was 0.48 for steatosis, 0.64 for ballooning, 0.67 for inflammation, and 0.55 for fibrosis. We checked the data’s homogeneity of variance by the Levene test; we compared the HFD-C groups with the control by an independent t-test for data that were distributed normally (AST, ALT, HDL-C, and glucose) and Mann–Whitney U (steatosis, ballooning, inflammation, fibrosis, TC, LDL-C, and TG) as an alternative test. We used the one-way ANOVA test to determine the difference between means of seven groups and the Tukey Post Hoc test to identify which specific groups’ means differ for data that distributes normal (AST, ALT, HDL-C, and glucose). As an alternative, we used the Kruskal–Wallis test and Dunn post hoc test for steatosis, ballooning, inflammation, fibrosis, TC, LDL-C, and TG. Ethical approvalThis study has obtained ethical approval from the Health Research Ethics Commission of the Faculty of Medicine, Diponegoro University. Ethical approval no. 085/EC-H/KEPK/FK-UNDIP/VIII/2024. ResultsLiver histopathologyThe data showed that steatosis appeared in HFD-C with fructose in 4 weeks. Steatosis in HFD-C with Fructose (P2, P3, P4, P5, P6, and P7) was significantly higher than in the control (Fig. 1). Ballooning in all groups was significantly higher than control except P2 (Fig. 1). Steatosis and ballooning of HFD-C with 30% w/v fructose in the 6-week and 8-week groups were higher than in the 4-week group (Table 1). Steatosis in HFD-C with 60% w/v fructose was not different with those in HFD-C with 30% w/v fructose (Table 1). Ballooning grade in the HFD-C with 60% w/v fructose group was greater than HFD-C with 30% w/v fructose only in the 8-week group (Table 1). Inflammation in all HFD-C with fructose groups was higher than in the control (Fig. 1). There was no difference in inflammation between HFD-C with fructose administration periods nor between fructose concentrations (Table 1). Fibrosis only appeared in the 8-week groups. Fibrosis in P7 was statistically higher than in the control (Fig. 1). Fibrosis in the 8-week group was different from fibrosis in the 4-week group for both fructose concentrations, but there was no fibrosis difference between the rats that were administered with 30% w/v fructose and 60% w/v fructose (Table 1). Figure 2 shows the representative pictures of hematoxylin and eosin (H&E) staining of liver tissue. Histological assessment indicated that steatosis and inflammation appeared in 4 weeks, ballooning mostly appeared in 6 weeks, and fibrosis appeared in 8 weeks. Transaminase enzymesThe AST level of the HFD-C with 60% w/v fructose group was higher than the control in all periods. The AST level of the HFD-C with 30% w/v fructose group was higher than the control only for the 8-week group (Fig. 3). The AST level was not different between the diet administration period or fructose concentration (Table 1). The ALT level of the HFD-C with fructose group was not different from the control (Fig. 3). There was no difference in the ALT concentration in all HFD-C (Table 1). Metabolic parametersThe TC and LDL-C of HFD-C with 60% w/v fructose in the 8-week group were significantly higher than the control. Triglycerides of HFD-C with 30% w/v fructose in the 6-week and 8-week groups, as well as HFD-C with 60% w/v fructose in the 4-week and 8-week groups. The glucose level of all HFD-C rats with fructose was higher than 135 mg/dl (Table 1). The glucose level of HFD-C with 30% w/v fructose was higher than that of the control in the 6-week group. The glucose level of HFD-C with 60% w/v fructose in the 6-week and 8-week groups was higher than that of the control. The level of HDL-C was no difference with control group (Fig. 4). The TC and LDL-C levels were raised in all HFD-C with fructose groups, but only the 8-week HFD-C with 30% w/v fructose group was statistically higher than the control. Triglyceride levels also showed the same pattern as TC and LDL-C levels. The glucose level in the HFD-C with fructose groups was also higher than the control group, but slightly decreased in the 8-week HFD-C with fructose for both fructose concentrations (Fig. 4). DiscussionIn this study, we fed the Sprague–Dawley rats with HFD-C orally with fructose drink (30% w/v and 60% w/v), and we found that steatosis and inflammation appeared in 4 weeks. The previous study using C57BL/6J mice fed with a fast food diet (high fat, high cholesterol, and high fructose) showed that steatosis appeared in 8 weeks (Abe, 2019). Mice fed with HFD demonstrated steatosis, cell injury, portal and lobular inflammation, and fibrosis after 80 weeks (Velázquez et al., 2019). Rats’ and mice’s metabolism was similar to human metabolism (Gunawan et al., 2021) . Rats are frequently more susceptible to HFD than mice. Rats showed NAFLD manifestation faster and more severely than mice (Zhong et al., 2020; Carreres et al., 2021; Gunawan et al., 2021; Soret et al., 2021). Sprague–Dawley rats were more susceptible to NAFLD than Wistar rats with dietary induction (Omagari et al., 2020; Zhong et al., 2020). Two diet formulae in NAFLD preclinical research were amino acid-modified diets and Western-style diets. Amino acid-modified diets consist of methionine- and choline-deficient diets (MCDs) and choline-deficient L-amino acid-defined diets (CDAA). In contrast, Western-style diets consist of high-fat diets (HFD), high-fat-high-fructose diets (HFFD) or American lifestyle-induced obesity syndrome (ALIOS) diet, high-fat-high-cholesterol diets (HFD-C), and high-fat-high-fructose diets plus cholesterol (HFFD-C) (Denk et al., 2019; Jahn et al., 2019; Oligschlaeger and Shiri-Sverdlov, 2020; Carreres et al., 2021; Flessa et al., 2022). Amino acid-modified diet models mimic human NAFLD in a shorter time and more severely than other diet models (Daniels et al., 2019 ; Farrell et al., 2019; Jahn et al., 2019; Jiang et al., 2019; Flessa et al., 2022). However, the metabolic profile of NAFLD in the amino acid-modified diets model was very different from human NAFLD metabolism (Jiang et al., 2019; Flessa et al., 2022). The HFFD model produced obesity and NAFLD features better than the HFD model (Jiang et al., 2019; Carreres et al., 2021; Eng and Estall, 2021; Flessa et al., 2022). Adding fructose as a drink in the HFD and HFD-C model increased NAFLD progressivity to NASH (Carreres et al., 2021; Eng and Estall, 2021).
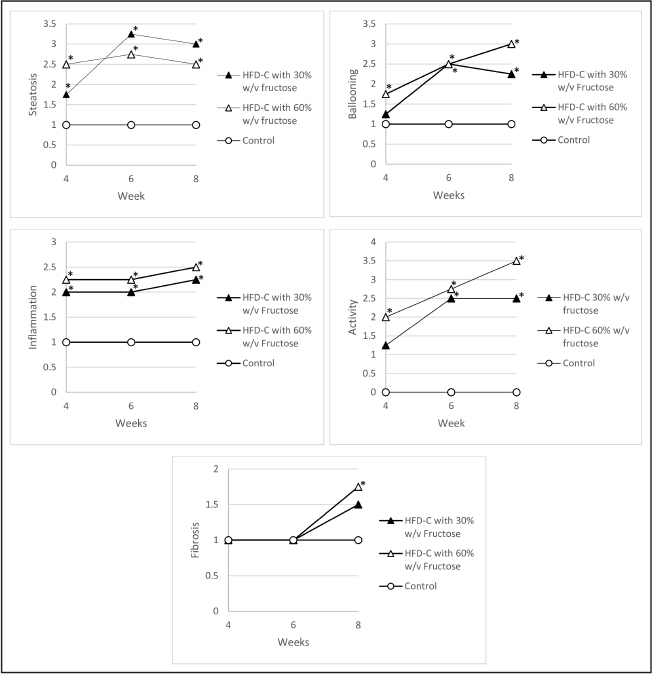
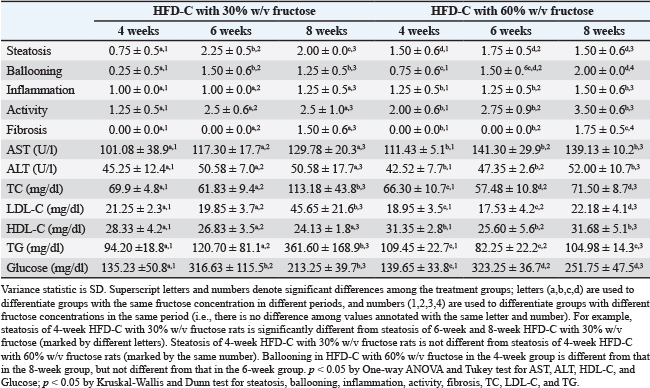
Fig. 1. The difference in histopathology features between the HFD-C with fructose and control groups. A study in Japan showed that the rats fed with HFD developed mild steatosis and inflammation without fibrosis in 8 weeks. Adding 1.25% to 2.5% cholesterol (lard) to HFD enhanced steatosis and fibrosis (Ichimura et al., 2015). An ideal concentration of cholesterol in the NAFLD model is 0.5%–1%. Cholesterol <0.5% cannot cause inflammation and fibrosis, whereas cholesterol >1% causes weight loss (Eng and Estall, 2021). The previous study reported that inflammation and fibrosis in the HFD-C rat model can mimic human NAFLD, but it usually showed minimal ballooning even in long-time HFD-C (Carreres et al., 2021). Adding 30%–60% fructose to an overfed diet could increase hepatocellular ballooning, fibrosis, and adipose tissue inflammation (Hundertmark, 2020; Zhong et al., 2020). A high-fat and fructose diet enhanced hepatic mitochondrial ageing, depletion, and dysfunction, which may be important determinants of non-alcoholic steatohepatitis pathogenesis (Bramlage, 2022; Chiang Morales et al., 2022). This is consistent with our result; the rats fed HFD-C with fructose developed ballooning and inflammation in a shorter period than the rats fed HFD, HFD-C, or HFHF alone. Table 1. Variables comparison among treatment groups.
Steatosis is the initial stage in NAFLD. It is the accumulation of fat in the liver cells that can progress to steatohepatitis, which characterized by inflammation and ballooning (Lee et al., 2023). Most of the steatosis in NAFLD is macro-vesicular steatosis. About 10% of NAFLD patients have micro-vesicular steatosis (Brunt et al., 2021; Cusi, 2022). In the initial stages, steatosis concentrates in the perivenular, zone 3 region of the acini (Brunt et al., 2021). This study showed that longer administration of HFD-C with fructose does not increase inflammation. Higher fructose concentration cannot increase inflammation either. The inflammation in NAFLD is chronic, low-grade systemic inflammation that persists and gradually causes liver damage (Petrescu et al., 2022; Lee et al., 2023). The previous study reported that inflammation was minimal in mice fed a high-fat and high-fructose diet for 24 weeks (Hsu et al., 2024). The activity score has the same pattern as the ballooning score (Fig. 1). The activity score is calculated by adding the ballooning and inflammation score of each sample. Some experts suggest using the activity score (according to ballooning and inflammation score) to evaluate NAFLD progression. When the activity score increases, the NAFLD is more progressive. (Eslam and M, 2020). In the SAF scoring system, steatosis (in any degree) that demonstrates both ballooning and inflammation degeneration with an activity score equal to or higher than 2 is diagnostic for NASH, but still the advanced stage of NASH is characterized by fibrosis (Bedossa et al., 2012). Our study showed an activity score equal to or higher than 2 in almost all HFD-C with fructose groups except in the 4-week HFD-C with 30% w/v fructose group. However, the liver tissues demonstrate fibrosis only in 8-week HFD-C with fructose groups. This study showed that fibrosis appeared in rats fed an HFD-C with 60% w/v fructose for 8 weeks, significantly different from other groups. It is consistent with previous study results; 10%–30% w/v fructose caused steatosis, whereas 60% w/v fructose caused steatosis and fibrosis (Eng and Estall, 2021). The fibrosis in our study was low-grade. Previous studies showed that the HFD model usually shows low levels of fibrogenesis. The HFD with Fructose in C57BL/6J mice for 24 weeks developed minimal fibrosis (Hsu et al., 2024). Fibrosis is the advanced stage of NAFLD; ongoing inflammation and cell injury can lead to fibrosis and eventually cirrhosis (Lee et al., 2023). Administration of a high-fat, high-cholesterol, and high-fructose diet (fast food diet) induced moderate fibrosis (F2) in 25 weeks (Farrell et al., 2019). Nutrient deficit models such as a methionine-choline-deficient diet (MCD) or choline-deficient L-amino-acid defined diet (CDAA) induced fibrosis higher than the HFD model (Bertola, 2018; Farrell et al., 2019; Hundertmark and J, 2020; Lefere et al., 2020; Puengel et al., 2020).
Fig. 2. Hematoxylin and Eosin staining of liver section.
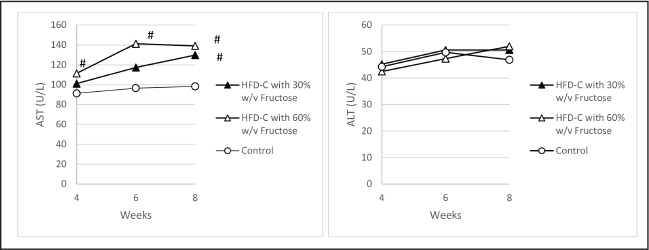
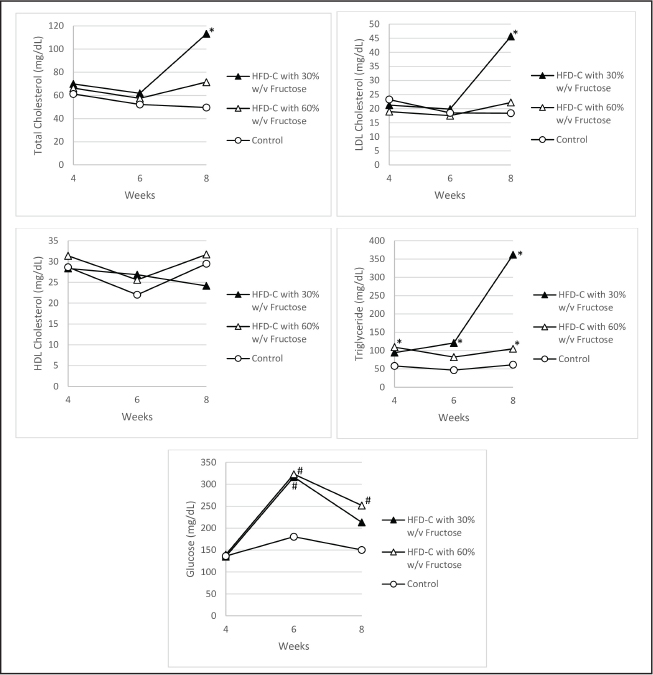
Fig. 3. The difference in transaminase enzymes between the HFD-C with fructose and control groups. We found that AST in HFD-C with 60% w/v fructose was higher than in the control group, but there was no difference in ALT between HFD-C with fructose and the control group. We already know that ALT is more specific to liver damage than AST. It is different from our result and needs further evaluation. Previous studies reported that aminotransferases (ALT and AST) could increase in NAFLD, but they could be normal in some NAFLD patients (Chalasani et al., 2018; Cusi, 2022; Mehendale, 2023). A previous study reported that about 25% of NAFLD patients and 19% of NASH patients possess normal ALT levels. A normal ALT value does not rule out NASH or even fibrosis (Ma, 2020). Enzyme levels may also be influenced by the limited sample size in this study. The TC, LDL-C, and triglycerides of the 8-week HFD-C with 30% w/v fructose group were higher than those of the control. The same was true for glucose in the 6-week HFD with 60% w/v fructose group. The triglycerides and glucose of the 8-week HFD-C with 60% w/v fructose were also higher than those of the control group. This result is consistent with previous studies; the high-fat-high-cholesterol diet with fructose causes higher plasma cholesterol and triglycerides in rodents (Tetri, 2008; Henkel and J, 2019). LDL-C and triglycerides pattern the same as the liver inflammation pattern. It is consistent with the previous study, which reported that LDL-C and triglycerides are higher in NAFLD patients with lobular inflammation than healthy subjects (Fujii and Y, 2020). The glucose level of all HFD-C with fructose groups was higher than 135 mg/dl. It means HFD-C with fructose experienced hyperglycemia. The normal rat blood glucose is 70–135 mg/dl (Wang and Z, 2010). The glucose level of the HFD-C with fructose group was higher than that of the control group, but slightly decreased in the 8-week HFD-C with fructose for both fructose concentrations. The decreasing of glucose in the 8-week HFD-C with fructose may be caused by decreasing of fructose intake. According to our observation during the research, fructose fluid intake seems to decrease after 6 weeks, but unfortunately this study doesn’t evaluate the food and fluid intake estimation of each rat. NAFLD correlates with free fatty acids (FFA) that are sourced from adipose tissue (60%), liver de novo lipogenesis (25%), and digestion (15%). FFA was esterified to triglycerides to form very low-density lipoprotein (VLDL) that enters circulation. Some FFA is oxidized in mitochondria or stored in the liver as lipid drops (LDs) (Sharma and John, 2020). Overfeeding and insulin resistance cause lipotoxicity that impairs lipolysis and leads to excess LDs in the liver, forming steatosis. It also causes endoplasmic reticulum stress and Kupffer cell activation that produce proinflammatory cytokines and mitochondrial function impairment that produce ROS (Sharma and John, 2020; Nassir, 2022; Sahu et al., 2023) An animal model could not mimic NAFLD in humans perfectly (Denk et al., 2019; Jahn et al., 2019; Carreres et al., 2021; Flessa et al., 2022). From the clinical perspective, a good animal model should mimic the most essential metabolic changes observed in NAFLD patients like obesity, insulin resistance/ hyperglycemia, and hyperlipidemia. From the hepatologist’s point of view, a relevant NAFLD animal model should show the progression of NAFLD to advanced disease stages histologically, and this phenotype needs to be thoroughly monitored by histopathological examination. The histological features can be analyzed by appropriate scoring systems quantitatively (Farrell et al., 2019; Jahn et al., 2019). Therefore, the animal model must be adapted to the study’s purposes (Denk et al., 2019; Jahn et al., 2019; Carreres et al., 2021; Flessa et al., 2022).
Fig. 4. The difference in metabolic parameters between the HFD-C with fructose and control groups. Our study lacks metabolic characterization such as insulin resistance and body mass index. Insulin resistance (e.g., HOMA-IR) is considered a more specific and sensitive marker for metabolic dysfunction than fasting blood glucose alone (Eslam and M, 2020). Fasting blood glucose is essentially a late-stage marker. Testing for insulin resistance gives us a direct look at the root cause of metabolic syndrome (Lee et al., 2022). Body mass index is one of the anthropometric measurements to predict obesity in rats (Novelli, 2007). We recommend insulin resistance and body mass index evaluation in further research to emphasize the effect of HFD-C with fructose diet-induced on NAFLD metabolically. The data on food and liquid intake are important to interpret the dose-response relationship and inter-group variability accurately. A quantitative dose-response relationship between nutrients and health outcomes is crucial for evaluating the impact of dietary modifications (Mateus and Ferreira, 2025) . Accurate food and liquid intake data are needed as guidance to reproduce the animal model. This study doesn’t report liquid and food intake of the standard diet for each rat. The fructose and standard diet were given in the same amount, but the researchers did not record the amount of fructose and standard diet that were eaten by each rat. Therefore, further research with food and liquid intake monitoring or even using the metabolism cage is recommended. LimitationsThis study has some limitations. The data on liquid intake and standard diet are not available, so we cannot interpret the dose-response relationship and inter-group variability accurately. The data on food and liquid intake are also important for reproducibility of the model. The study also uses a limited sample size and a short period. A small sample size directly decreases statistical power, making it harder to detect a true effect or increasing the chance of false negatives. Short-period research makes it difficult to assess the progressivity of NAFLD. Insulin or insulin resistance (e.g., HOMA-IR) was not measured in this study, and there was moderate inter-observer agreement on steatosis and fibrosis score. This is a preliminary study. Further study with a larger sample size and a prolonged period, a study that records food and liquid intake, and measures HOMA-IR as a metabolic parameter is really recommended to emphasize the effect of HFD-C with fructose diet-induced on NAFLD. ConclusionIn summary, Sprague–Dawley rats fed HFD-C with fructose could mimic human NAFLD histologically and metabolically. The Sprague–Dawley rat fed HFD-C with 30% w/v fructose for 4 weeks showed early-stage features of NAFLD, while Sprague–Dawley rats fed HFD-C with 60% w/v fructose for 8 weeks showed more progressive NAFLD but still early fibrosis. We recommend the Sprague Dawley rat fed HFD-C with 30% w/v fructose for 4 weeks for early induction of liver steatosis and inflammation. The glucose level of all HFD-C with fructose groups was higher than 135 mg/dl. Most of the metabolic parameters of HFD-C with fructose showed a difference from control after 8 weeks. The AST of the HFD-C with 60% w/v fructose group was higher than the control, but there was no difference in ALT between the HFD-C with fructose and the control group. Transaminase enzymes and metabolic parameters in NAFLD Sprague Dawley induced by HFD-C with fructose need further investigation. AcknowledgmentsThe authors would like to thank the Indonesian Education Scholarship, Center for Higher Education Funding and Assessment, and the Indonesian Endowment Fund for Education for funding support. FundingThis study was funded by Indonesian Education Scholarship, Center for Higher Education Funding and Assessment, and Indonesian Endowment Fund for Education. The sponsors provide funds for all study and publication fees. Authors’ contributionsJNS: conceptual design, data acquisition, methodology, figures, tables, and original draft preparation. HDP: review and editing. NS and US: critical revision of the manuscript. EM: Administrative and technical support. BR: Supervision. All authors have approved the final version. Conflict of interestThe authors declare that there is no conflict of interest. Data availabilityAll data supporting the findings of this study are available within the manuscript. ReferencesAbe, N. et al. 2019. Longitudinal characterization of diet-induced genetic murine models of non-alcoholic steatohepatitis with metabolic , histological , and transcriptomic hallmarks of human patients; doi:https://doi.org/10.1242/bio.041251. Bedossa, P., Poitou, C., Veyrie, N., Bouillot, J.L., Basdevant, A., Paradis, V., Tordjman, J. and Clement, K. 2012. ‘Histopathological algorithm and scoring system for evaluation of liver lesions in morbidly obese patients’. Hepatology 56(5), 1751–1759; doi:10.1002/hep.25889 Bertola, A. 2018. ‘Rodent models of fatty liver diseases *’. Liver. Res. 2(1), 3–13; doi:10.1016/j.livres.2018.03.001 Bramlage, K.S., Bhattacharjee, J., Kirby M., Myronovych, A., Gupta, R., Gonzalez, R.S., Xanthakos, S., Bove, K. and Kohli, R. 2022. A diet high in fat and fructose induces early hepatic mitochondrial aging. 73(1), 99–102; doi:10.1097/ MPG.0000000000003068 Brunt, E.M., Kleiner, D.E., Carpenter, D.H., Rinella, M., Harrison, S.A., Loomba, R., Younossi, Z., Neuschwander-Tetri, B.A. and Sanyal, A.J. 2021. NAFLD: reporting histologic findings in clinical practice. Hepatology 73(5), 2028–2038; doi:10.1002/hep.31599 Carreres, L., Jílková, Z.M., Vial, G., Marche, P.N., Decaens, T. and Lerat, H. 2021. Modeling diet-induced NAFLD and NASH in rats: a comprehensive review. Biomedicines 9(4), 378–393; doi:10.3390/biomedicines9040378 Chalasani, N., Younossi, Z., Lavine, J.E., Charlton, M., Cusi, K., Rinella, M., Harrison, S.A., Brunt, E.M. and Sanyal, A.J. 2018. The diagnosis and management of nonalcoholic fatty liver disease: practice guidance from the American Association for the Study of Liver Diseases. Hepatology 67(1), 328–357; doi:10.1002/hep.29367 Chiang Morales, M.D., Chang, C.Y., Le, V.L., Huang, I.T., Tsai, I.L., Shih, H.J. and Huang, C.J. 2022. High-fructose / high-fat diet downregulates the hepatic mitochondrial oxidative phosphorylation pathway in mice compared with high-fat diet alone. Cells 11(11), 1–16; doi:10.3390/cells11213425 Cusi, K. Isaacs, S., Barb, D., Basu, R., Caprio, S., Garvey, W.T., Kashyap, S., Mechanick, J.I., Mouzaki, M., Nadolsky, K., Rinella, M.E., Vos, M.B. and Younossi. 2022. American Association of Clinical Endocrinology Clinical Practice Guideline for the Diagnosis and Management of Nonalcoholic Fatty Liver Disease in Primary Care and Endocrinology Clinical Settings: co-Sponsored by the American Association for the Study of. Endocrine Pract. 28(5), 528–562; doi:10.1016/j. eprac.2022.03.010 Danielsa, S.J., Leemings, D.J., Detlefsenc, S., Bruunc, M.F., Hjulera, S.T., Henriksena, K., Heind, P., Karsdala, M.A., Brockbankd, S. and Cruwys, S. 2018. Biochemical and histological characterisation of an experimental rodent model of non-alcoholic steatohepatitis—effects of a peroxisome proliferator-activated receptor gamma (PPAR-γ) agonist and a glucagon-like peptide-1 analogue. Biomed. Pharmacotherapy 2018(111), 926–933; doi:10.1016/j.biopha.2018.12.130 Denk, H., Abuja, P.M. and Zatloukal, K. 2019. Animal models of NAFLD from the pathologist’s point of view. Biochimica Et Biophysica Acta—Mol. Basis Dis. 1865 (5), 929–942; doi:10.1016/j.bbadis.2018.04.02 Eng, J.M. and Estall, J.L. 2021. Diet-induced models of non-alcoholic fatty liver disease: food for thought on sugar, fat, and cholesterol. Cells 10(7), 1–16; doi:10.3390/cells10071805 Eslam, M., Newsome, P.N., Sarin, S.K., Anstee, Q.M., Targher, G., Romero-Gomez, M., Zelber-Sagi, S., Wong, V.W., Dufour, J.F., Schattenberg, J.M., Kawaguchi, T., Arrese, M., Valenti, L., Shiha, G., Tiribelli, C., Järvinen, Y., Fan, H., Grønbæk, H., Yilmaz, Y., Cortez-Pinto, H., Oliveira, C.P., Bedossa, P., Adams, L.A., Zheng, M.H., Fouad, Y., Chan, W.K., Mendez-Sanchez, N., Ahn, S.H., Castera, L., Bugianesi, E., Ratziu, V. and George, J. 2020. A new definition for metabolic dysfunction-associated fatty liver disease: an international expert consensus statement. J. Hepatol. 73(1), 202–209; doi:10.1016/j.jhep.2020.03.039 Estes, C., Chan, H.L.Y., Chien, R.N., Chuang, W.L., Fung, J., Goh, G.B.B., Hu, T.H., Huang, J.F., Jang, B.K., Jun, D.W., Kao, J.H., Lee, J.W., Lin, H.C., Razavi-Shearer, K. and Seto, W.K. 2020. Modelling NAFLD disease burden in four Asian regions—2019-2030. Alimentary. Pharmacol. Therapeutics. 51(8), 801–811; doi:10.1111/apt.15673 Farrell, G., Schattenberg, J.M., Leclercq, I., Yeh, M.M., Goldin, R., Teoh, N. and Schuppan, D. 2019. Mouse models of nonalcoholic steatohepatitis: toward optimization of their relevance to human nonalcoholic steatohepatitis. Hepatology 69(5), 2241–2257; doi:10.1002/hep.30333 Ferguson, D. and Finck, B.N. 2021. Emerging therapeutic approaches for the treatment of NAFLD and type 2 diabetes mellitus. Nature Rev. Endocrinol. 17(8), 484–495; doi:10.1038/s41574-021-00507-z Flessa, C.M., Nasiri-Ansari, N., Kyrou, I., Leca, B.M., Lianou, M., Chatzigeorgiou, A., Kaltsas, G., Kassi, E. and Randeva, H.S. 2022. Genetic and diet-induced animal models for non-alcoholic fatty liver disease (NAFLD) research. Int. J. Mol. Sci. 23(24), 23; doi:10.3390/ijms232415791 Fujii, Y., Nouso, K., Matsushita, H., Kariyama, K., Sakurai, T., Takahashi, Y., Chiba, H., Hui, S. P., Ito, Y., Ohta, M. and Okadaa, H. 2020. Low-density lipoprotein (LDL)-triglyceride and its ratio to LDL-cholesterol as diagnostic biomarkers for nonalcoholic steatohepatitis. J. Am. Soc. Nephrology JASN, 1206–1215; doi:10.1093/jalm/jfaa044 García-Lezana, T., Raurell, I., Bravo, M., Torres-Arauz, M., Salcedo, M.T., Santiago, A., Schoenenberger, A., Manichanh, C., Genescà, J., Martell, M. and Augustin, S. 2018. Restoration of a healthy intestinal microbiota normalizes portal hypertension in a rat model of nonalcoholic steatohepatitis. Hepatology 67(4), 1485–1498; doi:10.1002/hep.29646 Golabi, P., Paik, J.M., Alqahtani, S., Younossi, Y., Tuncer, G. and Younossi, Z.M. 2021. Burden of non-alcoholic fatty liver disease in Asia, the Middle East and North Africa: data from Global Burden of Disease 2009-2019. J. Hepatol. 75(4), 795–809; doi:10.1016/j.jhep.2021.05.022 Gunawan, S., Aulia, A. and Soetikno, V. 2021. Development of rat metabolic syndrome models: a review. Vet. World 14(7), 1774–1783; doi:10.14202/vetworld.2021.1774-1783 Haldrup, D., Heebøll, S., Thomsen, K.L., Andersen, K.J., Meier, M., Mortensen, F.V., Nyengaard, J.R., Hamilton-Dutoit, S. and Grønbæk, H. 2018. Preserved liver regeneration capacity after partial hepatectomy in rats with non-alcoholic steatohepatitis. World. J. Hepatol. 10(1), 8–21; doi:10.4254/wjh.v10.i1.8 Hamid, O., Eltelbany, A., Mohammed, A., Alsabbagh Alchirazi, K., Trakroo, S. and Asaad, I. 2022. The epidemiology of non-alcoholic steatohepatitis (NASH) in the United States between 2010-2020: a population-based study. Ann. Hepatol. 27(5), 100727; doi:10.1016/j.aohep.2022.100727 Henkel, J., Buchheim-Dieckow, K., Castro, J.P., Laeger, T., Wardelmann, K., Kleinridders, A., Jöhrens, K. and Püschel, G.P. 2019. Reduced oxidative stress and enhanced FGF21 formation in livers of endurance exercised rats with diet-induced diet. Nutrients 11(11), 2709; doi:10.3390/nu11112709 Hsu, W.F., Lee, M.H., Lii, C.K. and Peng, C.Y. 2024. No difference in liver damage induced by isocaloric fructose or glucose in mice with a high-fat diet. Nutrients 16, 1–15; doi:10.3390/nu16203571 Hundertmark, J. and Tacke, F. 2020. Expert opinion on drug discovery how effective are nonalcoholic fatty liver disease models for drug discovery? How effective are nonalcoholic fatty liver disease models for drug discovery?. Expert Opinion Drug Discovery 15(11), 1237–1240; doi:10.1080/17460 441.2020.1776258 Ichimura, M., Kawase, M., Masuzumi, M., Sakaki, M., Nagata, Y., Tanaka, K., Suruga, K., Tamaru, S., Kato, S., Tsuneyama, K. and Omagari, K. 2015. High-fat and high-cholesterol diet rapidly induces non-alcoholic steatohepatitis with advanced fibrosis in Sprague–Dawley rats. Hepatol. Res. 45(4), 458–469; doi:10.1111/hepr.12358 Jahn, D., Kircher, S., Hermanns, H.M. and Geier, A. 2019. Animal models of NAFLD from a hepatologist’s point of view. Biochimica Et Biophysica Acta - Mol. Basis Dis. 1865(5), 943–953; doi:10.1016/j.bbadis.2018.06.023 Jiang, M., Wu, N., Chen, X., Wang, W., Chu, Y., Liu, H., Li, W., Chen, D., Li, X. and Xu, B. 2019. Pathogenesis of and major animal models used for nonalcoholic fatty liver disease. J. Int. Med. Res. 47(4), 1453–1466; doi:10.1177/0300060519833527 Lee, K.C., Wu, P.S. and Lin, H.C. 2023. Pathogenesis and treatment of non-alcoholic steatohepatitis and its fibrosis. Clin. Mol. Hepatol. 29, 77–98. Lee, S., Park, S. and Choi, C.S. 2022. Insulin resistance: from mechanisms to therapeutic strategies. Diabetes Metab. J. 46, 15–37; doi:10.4093/dmj.2021.0280 Lefere, S., Puengel, T., Hundertmark, J., Penners, C., Frank, A.K., Guillot, A., De Muynck, K., Heymann, F., Adarbes, V., Defrêne, E., Estivalet, C., Geerts, A., Devisscher, L., Wettstein, G. and Tacke, F. 2020. Differential effects of selective- and pan-PPAR agonists on experimental steatohepatitis and hepatic macrophages. J. Hepatol. 73(4), 757–770. Ma, X. et al. 2020. Proportion of NAFLD patients with normal ALT value in overall NAFLD patients: a systematic review and meta-analysis. 1–8. doi:10.1186/s12876-020-1165-z Mateus, G. and Ferreira-p, C. 2025. Mapping the quantitative dose—response relationships between nutrients and health outcomes to inform food risk—benefit assessment. Foods 14, 1–23; doi: 10.3390/foods14081420 Nassir, F. 2022. NAFLD: mechanisms, Treatments, and Biomarkers. Biomolecules 12(824), 12. Novelli, E.L.B. et al. 2007. Anthropometrical parameters and markers of obesity in rats’, Laboratory Animals [Preprint]; doi:10.1258/002367707779399518 Oligschlaeger, Y. and Shiri-Sverdlov, R. 2020. NAFLD preclinical models: more than a handful, less of a concern?. Biomedicines 8(28), 28; doi:10.3390/biomedicines8020028 Omagari, K., Suzuta, M., Taniguchi, A., Kumamoto, R., Koyama, Y., Fukuda, A., Suruga, K., Ichimura-Shimizu, M. and Tsuneyama, K. 2020. A non-obese , diet-induced animal model of nonalcoholic steatohepatitis in Wistar / ST rats compared to Sprague-Dawley rats. Clin. Nutr. Exp. 30, 1–14; doi:10.1016/j.yclnex.2020.03.001 Parthasarathy, G., Revelo, X. and Malhi, H. 2020. Pathogenesis of nonalcoholic steatohepatitis: an overview. Hepatol. Commun. 4(4), 478–492; doi:10.1002/hep4.1479 Petrescu, M., Vlaicu, S.I., Ciumărnean, L., Milaciu, M.V., Mărginean, C., Florea, M., Vesa, S.C. and Popa, M. 2022. Chronic inflammation — a link between nonalcoholic fatty liver disease (NAFLD) and dysfunctional adipose tissue. medicina 58, 1–16; doi:10.3390/medicina58050641 Puengel, T., De Vos, S., Hundertmark, J., Kohlhepp, M., Guldiken, N., Pujuguet, P., Auberval, M., Marsais, F., Shoji, K.F., Saniere, L., Trautwein, C., Luedde, T., Strnad, P., Brys, R., Clément-Lacroix, P. and Tacke, F. 2020. The medium-chain fatty acid receptor GPR84 mediates myeloid cell infiltration promoting steatohepatitis and fibrosis. J. Clin. Med. 9, 1–17; doi:10.3390/jcm9041140 Sahu, P., Chhabra, P. and Mehendale, A.M. 2023. A comprehensive review on non-alcoholic fatty liver disease. Cureus 15(12), 1–14; doi:10.7759/cureus.50159 Sharma, B. and John, S. 2020. Nonalcoholic Steatohepatitis (NASH). National Library of Medicine. https://www.ncbi.nlm.nih.gov/books/NBK470243/. Soret, P.A., Magusto, J., Housset, C. and Gautheron, J. 2021. In vitro and in vivo models of non-alcoholic fatty liver disease: a critical appraisal. J. Clin. Med. 10(1), 1–18; doi:10.3390/jcm10010036 Tetri, L.H. et al. 2008. Severe NAFLD with hepatic necroinflammatory changes in mice fed trans fats and a high-fructose corn syrup equivalent. 63110, 987–995. doi:10.1152/ajpgi.90272.2008 Velázquez, K.T., Enos, R.T., Bader, J.E., Sougiannis, A.T., Carson, M.S., Chatzistamou, I., Carson, J.A., Nagarkatti, P.S., Nagarkatti, M. and Murphy, E.A. 2019. Prolonged high-fat-diet feeding promotes non-alcoholic fatty liver disease and alters gut microbiota in mice. World J. Hepatol. 11(8), 619–637; doi:10.4254/wjh.v11.i8.619 Wang, Z., Yang, Y., Xiang, X,. Zhu, Y., Men, J., He, M. 2010. Estimation of the normal range of blood glucose in rats. Wei Sheng Yan Jiu 39(2), 133–137. Yin, Y., Liu, H., Zheng, Z., Lu, R. and Jiang, Z. 2019. Genistein can ameliorate hepatic inflammatory reaction in nonalcoholic steatohepatitis rats. Biomed. Pharmacotherapy 111(74), 1290–1296; doi:10.1016/j. biopha.2019.01.004 Younossi, Z., Anstee, Q.M., Marietti, M., Hardy, T., Henry, L. and Eslam, M. 2018. Global burden of NAFLD and NASH: trends, predictions, risk factors and prevention. Nature. Rev. Gastroenterol. Hepatol. 15(1), 11–20; doi:10.1038/nrgastro.2017.109 Zhong, F., Zhou, X., Xu, J. and Gao, L. 2020. Rodent Models of Nonalcoholic Fatty Liver Disease. Digestion 101(5), 522–535; doi:10.1159/000501851 | ||

| How to Cite this Article |
| Pubmed Style Sitepu JN, Purnomo HD, Susilaningsih N, Sadhana U, Mahati E, Rachmawati B. NAFLD animal model: HFD-C with fructose in male Sprague–Dawley rats. Open Vet. J.. 2026; 16(8): 5422-5433. doi:10.5455/OVJ.2026.v16.i8.35 Web Style Sitepu JN, Purnomo HD, Susilaningsih N, Sadhana U, Mahati E, Rachmawati B. NAFLD animal model: HFD-C with fructose in male Sprague–Dawley rats. https://www.openveterinaryjournal.com/?mno=311134 [Access: August 08, 2026]. doi:10.5455/OVJ.2026.v16.i8.35 AMA (American Medical Association) Style Sitepu JN, Purnomo HD, Susilaningsih N, Sadhana U, Mahati E, Rachmawati B. NAFLD animal model: HFD-C with fructose in male Sprague–Dawley rats. Open Vet. J.. 2026; 16(8): 5422-5433. doi:10.5455/OVJ.2026.v16.i8.35 Vancouver/ICMJE Style Sitepu JN, Purnomo HD, Susilaningsih N, Sadhana U, Mahati E, Rachmawati B. NAFLD animal model: HFD-C with fructose in male Sprague–Dawley rats. Open Vet. J.. (2026), [cited August 08, 2026]; 16(8): 5422-5433. doi:10.5455/OVJ.2026.v16.i8.35 Harvard Style Sitepu, J. N., Purnomo, . H. D., Susilaningsih, . N., Sadhana, . U., Mahati, . E. & Rachmawati, . B. (2026) NAFLD animal model: HFD-C with fructose in male Sprague–Dawley rats. Open Vet. J., 16 (8), 5422-5433. doi:10.5455/OVJ.2026.v16.i8.35 Turabian Style Sitepu, Jenny Novina, Hery Djagat Purnomo, Neni Susilaningsih, Udadi Sadhana, Endang Mahati, and Banundari Rachmawati. 2026. NAFLD animal model: HFD-C with fructose in male Sprague–Dawley rats. Open Veterinary Journal, 16 (8), 5422-5433. doi:10.5455/OVJ.2026.v16.i8.35 Chicago Style Sitepu, Jenny Novina, Hery Djagat Purnomo, Neni Susilaningsih, Udadi Sadhana, Endang Mahati, and Banundari Rachmawati. "NAFLD animal model: HFD-C with fructose in male Sprague–Dawley rats." Open Veterinary Journal 16 (2026), 5422-5433. doi:10.5455/OVJ.2026.v16.i8.35 MLA (The Modern Language Association) Style Sitepu, Jenny Novina, Hery Djagat Purnomo, Neni Susilaningsih, Udadi Sadhana, Endang Mahati, and Banundari Rachmawati. "NAFLD animal model: HFD-C with fructose in male Sprague–Dawley rats." Open Veterinary Journal 16.8 (2026), 5422-5433. Print. doi:10.5455/OVJ.2026.v16.i8.35 APA (American Psychological Association) Style Sitepu, J. N., Purnomo, . H. D., Susilaningsih, . N., Sadhana, . U., Mahati, . E. & Rachmawati, . B. (2026) NAFLD animal model: HFD-C with fructose in male Sprague–Dawley rats. Open Veterinary Journal, 16 (8), 5422-5433. doi:10.5455/OVJ.2026.v16.i8.35 |