





| Research Article | ||
Open Vet. J.. 2026; 16(5): 3144-3154 Open Veterinary Journal, (2026), Vol. 16(5): 344-3154 Research Article Relative importance analysis of correlated predictors in aquatic veterinary science: Application to an abalone datasetElmabrok Masaoud1*, Abulwahid Sirtiyah1, Mohammed Abdulqadir2, Asem Mohamed1, Abdeulmajid Khapoli1 and Kamal Alshaybani31Faculty of Veterinary Medicine and Agriculture, University of Zawia, Az-Zāwiyah, Libya 2Faculty of Medicine, University of Zawia, Az-Zāwiyah, Libya 3Faculty of Health Sciences, University of Zawia, Az-Zāwiyah, Libya *Corresponding Author: Elmabrok Masaoud. Faculty of Veterinary Medicine and Agriculture, University of Zawia, Submitted: 24/11/2025 Revised: 10/03/2026 Accepted: 19/03/2026 Published: 31/05/2026 © 2025 Open Veterinary Journal
ABSTRACTBackground: Relative importance refers to the process of quantifying how much each predictor in a linear regression model contributes to explaining the outcome variation. In veterinary science, linear regression is widely applied as an analytical tool, allowing researchers to examine relationships between predictors and outcomes of interest in animal populations. Aim: This study aims to provide an introduction to statistical approaches for quantifying the relative importance of correlated predictors. This study focuses exclusively on statistical procedures implemented in R software that are applicable to linear regression within veterinary science. Additionally, the study demonstrates relative importance analysis for correlated predictors using the abalone dataset as an example. Methods: This study evaluates several statistical approaches for assessing predictor importance, including Shapley value-based decomposition, Genizi method, relative weights analysis, and dominance analysis. Results: The shell weight of abalone was consistently ranked as the most influential predictor in predicting the ring count, which serves as a proxy for abalone age, across all methods. The Proportional Marginal Variance Decomposition (PMVD) metric showed overlapping importance among predictors, while the Genizi metric provided clear separation between all predictors. The Genizi metric and relative weight method consistently produced narrow confidence intervals (CIs) across all estimates, while the PMVD produced wider bootstrap intervals, Lindeman, Merenda, and Gold (LMG) method showed moderate variability, indicating a slight difference in estimates across both metrics. Conclusion: Shell weight is the most dominant predictor of ring count, serving as a proxy for the age of abalone. Both the relative weights and the Genizi method performed well, resulting in narrow CIs. Dominance analysis provided deeper hierarchical insights into predictor importance but requires greater computational resources, particularly for complex models. Keywords: Abalone dataset, Correlated predictors, Dominance analysis, Relative weights analysis, Shapley value. IntroductionThis paper provides an introduction to quantifying the relative importance of correlated predictors. Relative importance in regression analysis refers to the process of determining how much each predictor contributes to explaining the variation in the outcome of interest (Seedorff and Cavanaugh, 2024). According to Grömping (2006) relative importance refers to the quantification of the contribution of an individual predictor to a regression model. Johnson and Lebreton (2004) offer a working definition of relative importance: “The proportionate contribution each predictor makes to R2, considering both its direct effect (i.e., its correlation with the criterion) and its effect when combined with the other variables in the regression equation.” Linear regression is widely applied as an analytical tool in veterinary science, allowing researchers to examine relationships between predictors and outcomes of interest in animal populations. This analytical model helps researchers account for confounding factors, identify significant predictors, and quantify the relative importance of different predictors. It helps address questions about how age, breed, diet, and other risk factors influence the risk of (Suárez et al., 2017). For example, Puig et al. (2022) presented a linear regression model in livestock production to evaluate growth performance between vaccine groups. Mair et al. (2015) applied regression models to predict the intensity of nematode infection in lambs using a range of traits. Phu et al. (2019) used a linear regression model to assess antimicrobial sales as a proportion of business income in veterinary practices. Burgess et al. (2021) developed and validated a regression model and an online tool to estimate malignancy risk in dogs with splenic masses using preoperative data from a large diagnosed cohort. Several statistical approaches, including dominance analysis (Azen and Budescu, 2003; Luchman, 2021), relative weights analysis (RWA) (Johnson, 2000; and Tonidandel and Lebreton, 2015), the Genizi method (Genizi, 1993), and Shapley value-based decomposition of (Israeli, 2007), have been proposed to determine the relative importance of correlated predictors R2. Edwards et al. (2019) assessed the relative importance of each predictor in predicting fear of veterinary examination and fear of unfamiliar individuals using a dominance analysis framework and the Lindeman, Merenda, and Gold (LMG) method (a method for decomposing the R2). Despite the large body of literature on relative importance analysis, applied researchers, particularly veterinarian researchers, may find little specific guidance on the choice between relative importance methods for the data at hand. Our motivating example for this study is the Abalone dataset (Nash et al., 1994), which can be accessed at https://archive.ics.uci.edu/dataset/1/abalone. This dataset, originally collected by marine research laboratories, contains morphometric and tissue-weight measurements routinely used in aquatic veterinary assessments. Predictors such as shell dimensions and tissue weights make this dataset suitable for developing non-invasive age estimation models. Specifically, to clarify predictor naming and ensure consistency across analyses, shell weight, diameter, whole weight, viscera weight, and shucked weight were specified as predictors in all models, while ring count was used as the response variable and a proxy for age, consistent with the dataset’s original design and documentation. Accurate age estimation is essential for health monitoring, harvest planning, and disease risk management in abalone aquaculture, all of which fall within the scope of aquatic veterinary medicine. This study aims to provide an applied introduction to statistical approaches for quantifying the relative importance of correlated predictors. It focuses exclusively on statistical procedures implemented in R software that are applicable to linear regression in veterinary science. Additionally, the study demonstrates relative importance analysis for correlated predictors using the Abalone dataset. Materials and MethodsThe linear regression model and R2Consider an independent continuous outcome yi, i=1,…..,n and a set of p explanatory predictors’ xi1, … ,xip. Therefore, a linear regression model can be written as follows: yi=β0 + β1xi1 + ... + βp xip + ei where β1,..., βp, refer to the unknown regression model coefficients that are to be estimated, and ei, …., en are independent random variables commonly assumed to follow a normal distribution, say ei ~ N(0,σ2), where σ2 represents the variance. The ei represent the difference between the actual outcome (yi) and the model-predicted ith outcome observation (ŷi) and are commonly called residuals. The sum of squared difference as: outcome of interest (Chatterjee and Ali, 2006), also known as the total sum of squares, is defined as: (SStotal=SSmodel + SSresidual=∑ni=1 (ŷi – ȳ)2). These quantities are used to calculate the coefficient of determination (known as R2), which is a statistical measure that indicates how well the independent predictors explain the outcome variability in a regression model. R2 is defined as the ratio of the model-explained variance to the total variance of the outcome (Wooldridge, 1991; Chatterjee and Ali, 2006; Huettner and Sunder, 2012) and can be mathematically written as follows:
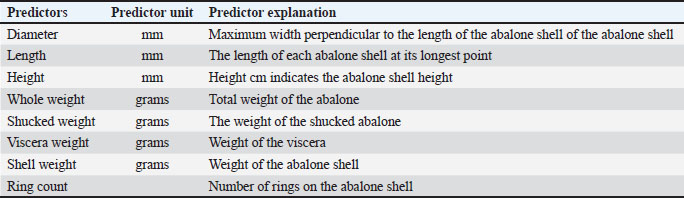
Relative importance of the methodsIn linear regression models, the “relevance” of a predictor is often limited to the sign and p-value of its regression coefficients (Huettner and Sunder, 2012). However, the relative importance of a predictor is to decompose the R2 of a linear regression model (Grömping, 2006) into components that capture part of the variation explained by the predictors in the model (Israeli, 2007). A predictor’s contribution to R2 consists of two parts: one related to the predictor itself (direct contribution) and the other related to the interaction between the predictor and other predictors in the regression model (Johnson and LeBreton, 2004). The presence of moderate or high correlation between two or more predictors in linear regression analysis is referred to as a multicollinearity issue. It affects regression coefficients and may lead to inflated standard errors, making it difficult to determine the statistical significance and true effect size of individual predictors. Consequently, the interpretation of regression coefficients becomes uncertain and potentially misleading. Shapley value-basedThe Shapley value-based approach addresses the multicollinearity issue by calculating the average marginal contribution of each predictor across all possible predictor combinations (Israeli, 2007). This idea is based on the fundamentals of game theory and the economic principle of marginal contribution, where the Shapley value of a player in every coalition game is basically the average contribution of all marginal contributions that this player can make to all coalitions (Chantreuil and Trannoy, 1999); that is, when predictors are correlated, their contributions to the model's prediction are shared. The Shapley values then split this contribution among correlated predictors based on how much each contributes to different combinations. The Shapley value considers all combinations of predictors included in the regression model for each predictor. Depending on the ordering of predictors, a correlated predictor may appear earlier in a sequence and show a greater contribution, whereas it may appear later and demonstrate a reduced contribution in other settings. The final Shapley value is the average of the marginal contributions. Israeli (2007) proposed using the Shapley value approach to determine the exact contribution of different predictors to a linear regression model to R2. This method calculates the marginal contribution of each predictor by removing it from the model—along with its interaction terms—and observing the change in R2. The Shapley value fairly allocates the explained variance by considering all possible predictor orderings, even in complex models with categorical variables and interactions, thus addressing the challenge of dividing contributions among interacting terms (Israeli, 2007). Grömping (2006 and 2007) reviewed recent work on the relative importance of predictors with a focus on R2 decomposition and discussed their statistical properties. Genizi methodGenizi (1993) introduced an alternative method to address multicollinearity in regression by transforming correlated predictors into uncorrelated components before assessing their contributions to the model’s explained variance. This method decomposes the squared multiple correlation coefficient in multiple regression between predictors and the outcome into orthogonal (uncorrelated) components using eigenvectors and eigenvalues. Then, it measures how strongly each uncorrelated component relates to the outcome of interest and reallocates the variance to the original predictors. Genizi (1993) introduced this decomposition to address the challenge of attributing the overall explained variance to individual predictors. Relative weight analysisRWA (Johnson, 2000; Tonidandel and Lebreton, 2015) addresses the multicollinearity issue by breaking down the total variance explained by a regression model R2 into weights that more precisely represent each predictor’s relative contribution. The RWA begins by computing the correlation matrix among the independent predictors. Then, the eigenvectors and eigenvalues are derived. A diagonal matrix is created from the eigenvalues, and its square root is obtained. The eigenvector matrix and its transpose then multiply this result to produce a transformed matrix, which is subsequently squared to obtain the weight. The inverse of the transformed matrix is multiplied by the correlation vector between the outcome and the independent predictors to estimate the partial effect of each independent predictor on the outcome variable. The sum of these partial effects is the R2 value, which represents the total explained variance. Multiplying the squared transformed matrix by the squared partial effects produces the raw relative weights. These raw weights are then converted into percentages by dividing each weight by the R2 value and multiplying by 100. Dominance analysisDominance analysis (Azen and Budescu, 2003) addresses the multicollinearity issue by evaluating each predictor’s incremental contribution (Luchman, 2021) to the model’s explained variance for every predictor combination. That is, the average additional contribution to R2 that each predictor makes across all subset models is computed and then used to rank predictor importance (or dominance) in regression models. This approach distributes shared variance among correlated predictors based on their performance in various combinations of models. A predictor dominates another if it contributes more to the model's R2 in every predictor subset that includes both predictors. There are three types of dominance: complete, conditional, and general dominance (Azen and Budescu, 2003). Complete dominance occurs when a predictor consistently contributes more to the model’s explained variance (R2) in every subset model that includes both predictors. Conditional dominance occurs when a predictor contributes more to the model’s explained variance (R2) within specific subsets or data conditions. General dominance occurs when a predictor contributes, on average, more to the model’s explained variance (R2) than another predictor across all subset models. The general dominance statistics are equivalent to the Shapley value-based decomposition (Luchman, 2021). Software and estimation proceduresRelative weights were computed using the rwa package (Chan, 2025), which is available in R software (version 4.3.1). Dominance analysis was conducted in R using the domir R package (Luchman, 2024). The Shapley value decomposition is accomplished using the averaging over orders (LMG) method (Lindeman et al., 1980) and the Proportional Marginal Variance Decomposition (PMVD) method, which are implemented in the R package (Grömping, 2006). The Genizi method is implemented using the implementation available in the relaimp package. The LMG method was initially proposed by Lindeman et al. (1980) and uses a simple unweighted sequential sum of squares over all orderings of predictors. Chevan and Sutherland (1991)provided a hierarchical partitioning algorithm that allows the calculation of each predictor’s contribution to the total explained variance of a regression model and extended this idea to more general classes of regression models. The LMG method is reinvented by applying the Shapley value from game theory and focuses on linear models, whereas the PMVD method is a weighted analog of the LMG method (Grömping, 2007). It was proposed by Feldman (2005) and adopts data-dependent weights and uses a weighted sequential sum of squares over all orderings of predictors. Example: abalone dataThe Abalone dataset (Nash et al., 1994) contains 4,177 rows. Each row represents the attributes and physical measurements of abalones, including their gender, length, diameter, whole weight, shucked weight, viscera weight, shell weight, and ring count. Lengths are measured in millimeters, and weights are measured in grams. The categorical gender feature has been converted into numerical form, ensuring that all data are represented numerically. Farmers typically cut the shells and manually count the number of rings using a microscope to estimate the age of abalones. The ring count plus 1.5 is widely recognized as a reliable estimate of the chronological age of abalones (Guney et al., 2022). Abalones are rare marine snails belonging to the genus Haliotis (Shinn, 2022). They are prized shellfish in many regions, rich in iron and pantothenic acid, and hold significant economic value worldwide. The market value of an abalone is positively associated with its age; the younger the abalone, the higher the market value (Misman et al., 2019; Hossain and Chowdhury, 2019). However, the current age estimation method, which involves cutting the shell and counting growth rings, is costly, inefficient, and often inaccurate due to environmental factors and growth variations in stunted populations (Cui and Xiao, 2024). Therefore, the ability to identify and quantify the most important predictor(s) for predicting an abalone’s age would be highly valuable for those seeking to accurately determine it. The Abalone dataset (Nash et al., 1994) is used as an example to demonstrate the calculation of the relative importance of correlated predictors in a linear regression model. Table 1 shows four different weight measures: whole weight, shucked weight, viscera weight, and shell weight. The height indicates the height of the abalone shell. The outcome of interest here is the ring count of the abalone shell (i.e., used as a proxy for the abalone age) and is included in the dataset. Table 1. The attributes of the abalone data.
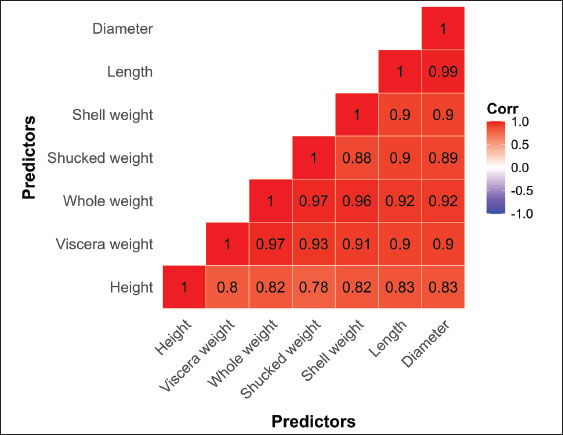
Pearson correlation coefficients are shown in Figure 1. The length and diameter of the shell are highly positively correlated (r=0.99). The correlation coefficient between whole weight and shucked weight is 0.97, the correlation coefficient between whole weight and viscera weight is 0.97, and the correlation coefficient between whole weight and shell weight is 0.96. The correlation coefficient between length and height is 0.90, and that between diameter and height is 0.91. For a more detailed analysis of correlation coefficients for the abalone data, see, for example, Cui and Xiao (2024). This dataset has been cited more than 55 times, for example, see Guo et al. (2021) and Zhang (2023). For more details on citations, see https://archive.ics.uci.edu/dataset/1/abalone. In this research paper, we build on the work of Guo et al. (2021) by performing a relative-importance analysis based on the final regression model presented in Figure 1 with R code provided in Appendix A. The model was specified as follows:
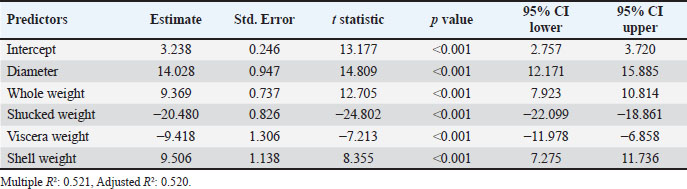
Fig. 1. The Pearson correlation values between predictors. Ring counti ≈ intercept + Diameteri + Whole weighti + Shucked weighti + Viscera weighti + Shell weighti + eiModel (1) With ei assumed i.i.d. with mean 0 and constant variance; age is reported where relevant as Age=Ring count +1.5 years. As an initial step, we performed a multiple regression analysis (Model 1) using ordinary least squares (OLS) to predict abalone age (ring count) from 4,177 cases. In Model 1, ring count was modeled as the response in a linear regression with the following predictors: Diameter (mm), Whole weight (g), Shucked weight (g), Viscera weight (g), and Shell weight (g). The results and interpretation of its coefficients are beyond the scope of this manuscript (Guo et al., 2021). After which, the relative importance scores were estimated. The results and interpretation of regression coefficients presented for model (1) in Table 2 are beyond the scope of this research paper; see, for example, Guo et al. (2021). In this study, as an initial step, we performed a multiple regression analysis, referred to as Model (1), using OLS regression to predict the ring count (i.e., used as a proxy for the age of abalones). All 4,177 cases from the abalone dataset were included in the regression analysis. The OLS method was implemented using R’s builtin lm() function for fitting linear regression models. Subsequently, the relative importance scores were estimated. Model (1) models the ring count as a linear function of the following physical measurements of abalones: diameter, whole weight, shucked weight, viscera weight, and shell weight (Guo et al., 2021). Table 2. The regression results of Model 1.
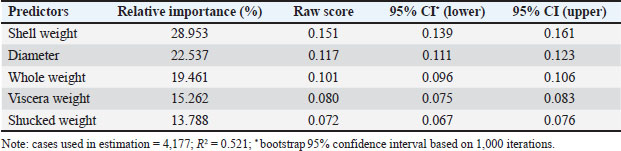
ResultsThe results are presented according to each statistical method. Table 2 shows the regression analysis results of Model (1). Figure 2 displays the relative importance of each predictor, as estimated by the LMG, PMVD, and Genizi metrics. The findings of the dominance analysis are presented in Tables 4–6. Table 3 shows the relative weights and their bootstrap confidence intervals (CIs), which are based on 1,000 iterations. These bootstrap CIs, estimated using the percentile method, indicate the range within which the true relative score is likely to fall. Table 3. The RWA results.
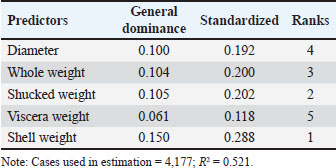
Table 4. The results of the general dominance analysis.
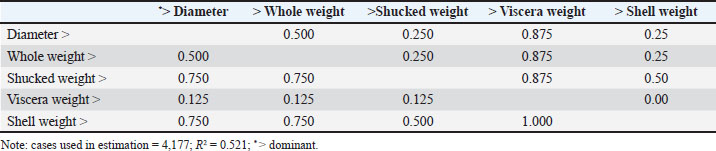
Table 5. The complete dominance analysis results.
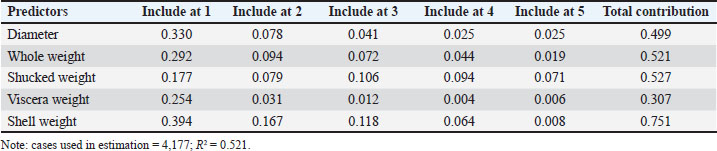
Table 6. The results of the conditional dominance analysis.
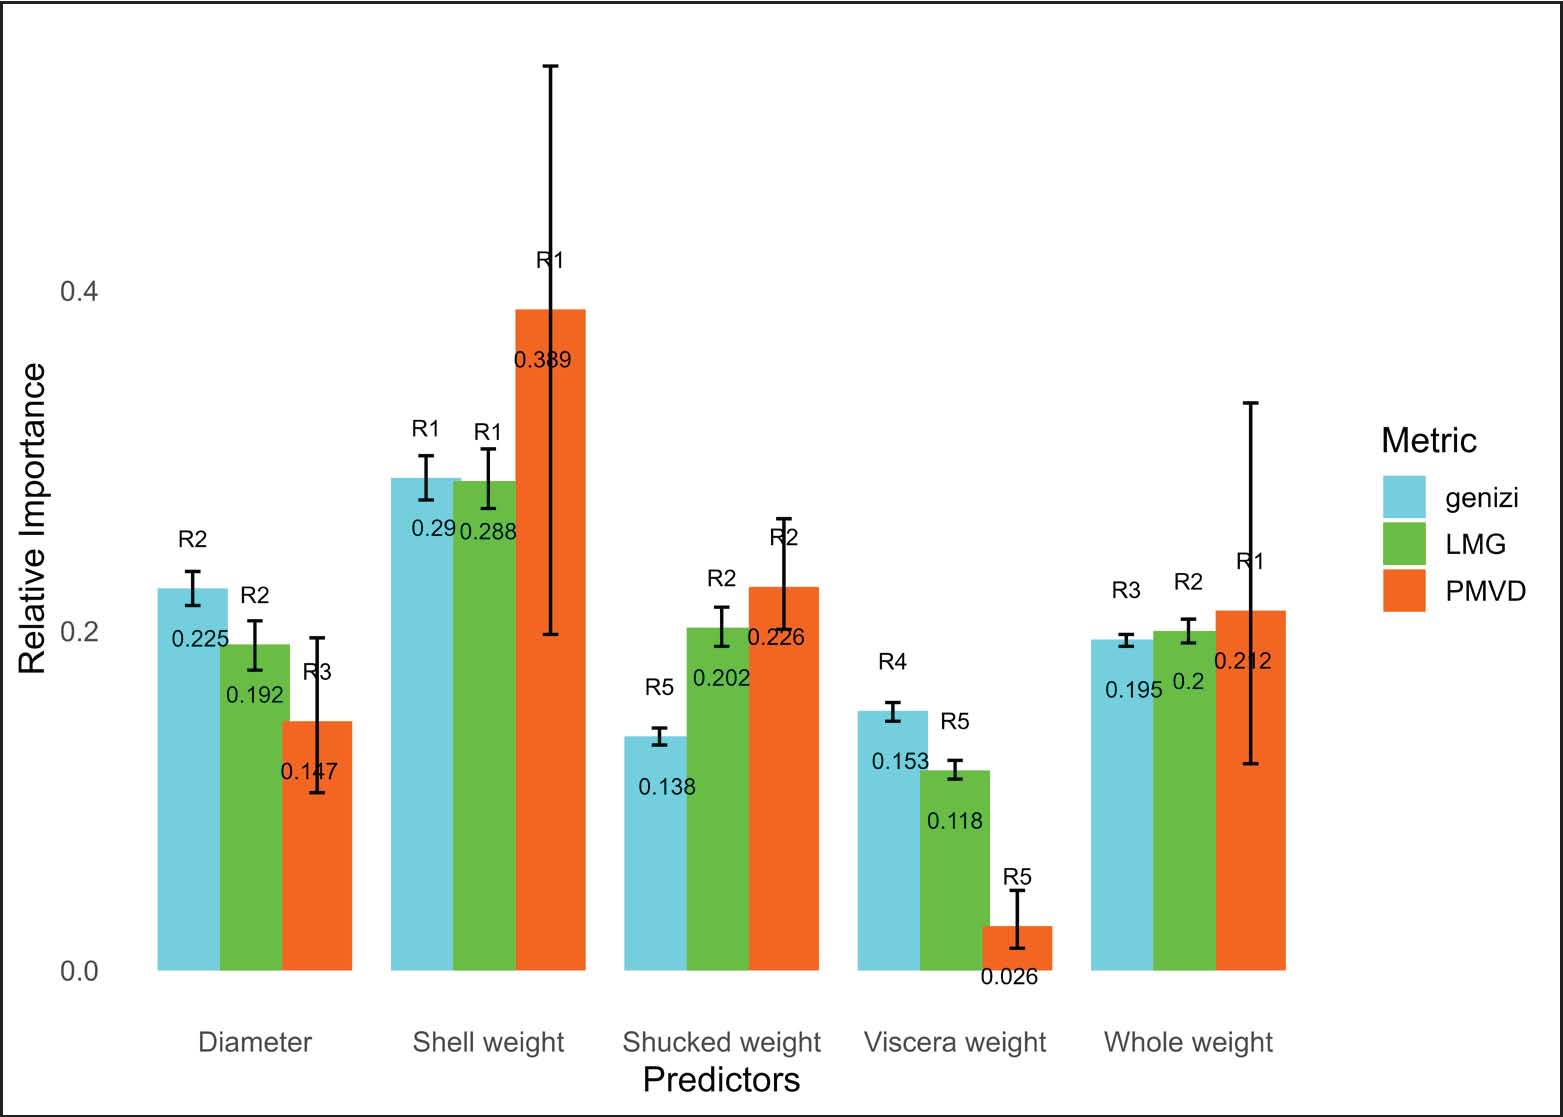
Fig. 2. The relative importance of predictors with 95% bootstrap CIs (R2=52.1%, metrics are normalized to the sum of 100%). Overall and across all methods, the shell weight of abalones is consistently ranked as the most influential predictor in predicting the ring count of abalones (used as a proxy for age). The PMVD metric shows overlapping importance among predictors, whereas the Genizi metric provides clear separation between all predictors. The Genizi metric and relative weight method consistently produced narrow CIs across all estimates, while the PMVD produced wider bootstrap intervals, the LMG showed moderate variability, indicating a slight difference in estimates across both metrics. The results of Model (1) showed that R2=0.521, indicating that 52.1% of the variation in the ring count of abalones is explained by Model (1). This model’s R2 (0.52.1) is decomposed to determine the relative importance of the five predictors using LMG, PMVD, and Genizi metrics, the relative weight method, and the dominance analysis method. Based on the results presented in Table 2, Model (1) can be written as follows: Ring count=3.238 + 14.028 * Diameter + 9.369* Whole weight - 20.480 * Shucked weight – 9.418* Viscera weight + 9.506 * Shell weight Results of the LMG, PMVD, and genizi metricsFigure 2 shows the results of relative importance contributions by LMG, PMVD, and Genizi metrics. The error bars represent the 95% CIs for each relative weight. The PMVD metric results indicate that shell weight and whole weight are statistically similar in importance and are ranked equally as the most important predictors. The relative weight of the shell weight is approximately 0.389 with a wider CI of 0.18–0.53 explaining about 38.9% of the model’s R2. The relative weight of the whole weight is approximately 0.212 with a slightly narrower CI of 0.12–0.34 that explaining roughly 21.2% of the R2 value. The relative weight of the viscera is estimated to be approximately 0.026 with CI of 0.013–0.046 explaining only 2.6% of the R2. This predictor remains statistically different from all other predictors and is ranked the least important. The estimated relative weight of the shucked weight is approximately 0.226 with a CI of 0.202–0.270, explaining approximately 22.6% of the variance accounted for by the regression model. The relative weight of the diameter is approximately 0.147 with a CI of 0.109–0.20, accounting for approximately 14.7% of the explained variance. Both shucked weight and diameter are moderately important predictors. The results from the LMG metric (Fig. 2) showed a relative weight of 0.29 for the shell weight predictor, with a narrow CI of 0.27–0.31 explaining about 29% of the variation accounted for by R2. Therefore, the shell weight is ranked as the most important predictor of the ring count. Diameter, whole weight, and shucked weight predictors are statistically similar, explaining approximately 19% (0.192 with CI of 0.178–0.217), 20% (0.20 with CI of 0.193–0.207), and 20% (0.20 with CI of 0.191–0.215) of the variance explained by R2, respectively, and are thus ranked equally as moderate importance predictors. The viscera weight explained approximately 12% (0.118 with CI of 0.113–0.124) of R2 and is ranked as the least important predictor. The results from the Genizi metric (Fig. 2) showed a distinct order of predictors. Shell weight was again the most important predictor, explaining about 29% (0.290 with a narrow CI of 0.277–0.301) of, R2 followed by diameter explaining at 23% (0.225 with CI of 0.216–0.235), then whole weight at 20% (0.20 with a narrow CI of 0.191–0.198), and viscera weight at 15% (0.153 with a narrow CI of 0.149–0.158) of R2. Shucked weight was the least important predictor, accounting for only 14% (0.140 with a narrow CI of 0.133–0.143) of the explained variation by R2. Overall, across all three metrics, shell weight consistently ranked as the most influential predictor, with relative importance values ranging from approximately 0.29 to 0.38. Viscera weight was consistently ranked as the least important predictor, contributing the least to the variance explained. The PMVD metric shows an overlapping relative importance among predictors, specifically between shell weight and whole weight predictors, as they ranked equally in the top rank, while the Genizi metric provides a clear separation between all predictors. The Genizi metric produced narrow CI across all estimates, followed by LMG, while PMVD produced wider bootstrap intervals, with LMG showing moderate variability, indicating a slight difference in estimates across both metrics. Results of the RWAThe results of the RWA (Table 3) present the relative importance percentages, raw scores, bootstrap 95 CIs, and R2 value. Results showed R2=0.521, indicating that approximately 52.1% of the variance in the ring count of abalone is explained by the combined five predictors. The results (Table 3) showed that shell weight is the most important predictor, accounting for nearly 29% of the variance explained. Its raw score of 0.151, combined with a narrow CI of 0.139–0.161, indicates a strong and stable contribution. The diameter predictor has a raw score of 0.117 and is ranked second with a relative importance percentage of 22.5% and a tight CI of 0.111–0.123, indicating low variability in this estimate. The whole weight, viscera weight, and shucked weight contribute less, but the difference remains statistically significant. Results of the dominance analysisThe results of the general, complete, and conditional dominance analyses are presented in Tables 4–6, respectively. Results of dominance analysis showed R2=0.521, indicating that approximately 52.1% of the variance in the ring count of abalone is explained by the combined five predictors. The results of the general dominance (Table 4) show that shell weight is the most important predictor, with the highest general dominance of 0.150 and a standardized value of 0.288. The sucked weight, whole weight, and diameter show similar general dominance values of 0.105, 0.104, and 0.100, respectively, indicating that mass-related measurements are key drivers. Viscera weight, with a general dominance value of 0.06, is the least important predictor of the ring count of abalone. The results of the complete-dominance analysis (Table 5) show how often one predictor contributes more to the model than another across all subset models. A value of 1.00 indicates full dominance, whereas 0.00 indicates no dominance. The results show that shell weight dominates all other predictors, although it shows balanced dominance with shucked weight. Shucked weight dominates the diameter, whole weight, and viscera weight predictors, but has a balanced dominance score of 0.5 against shell weight. Whole weight dominates viscera weight, shows balanced dominance with diameter, and loses to shucked and shell weight. The diameter predictor behaves similarly to the whole weight, but with slightly weaker dominance values. The viscera weight dominates none and is consistently the weakest predictor. The conditional dominance (Table 6) shows the average contribution of each predictor to the model's R2 at different model sizes (i.e., when Model (1) includes 1, 2, 3, 4, or all 5 predictors). This average helps understand the importance of predictor changes as more predictors are added to Model (1). The results show that the shell weight, with an average contribution of 0.751, is consistently dominant across all model sizes. Shucked weight contributes strongly, with an average of 0.527. The overall weight has an average of 0.521, showing a particularly strong influence in the smaller model, and remains consistent across larger model sizes. Diameter contributed an average of 0.499, and its importance is relatively strong in smaller models but slightly reduced when additional predictors are included. Viscera weight consistently contributes the least across all model sizes (especially in larger models), reflecting its weaker overall influence on the abalone ring count. DiscussionThe discussion is organized according to the interpretation of predictor rankings, statistical robustness, and practical application to aquatic and veterinary sciences. Overall, this study showed that all methods produced similar relative importance rankings of predictors. This finding aligns with that of Lebreton et al. (2004)who reported that Shapley value-based decomposition, Genizi’s method, RWA, and dominance analysis produce similar predictor rankings when correlations are moderate; moreover, both relative weights and Genizi methods yielded narrow CIs, whereas PMVD showed greater variability, and LMG exhibited moderate variability. Interpretation of the rankingsThis study found that shell weight is the most dominant predictor for predicting the ring count (i.e., used as a proxy for age) of abalone, outperforming other weight-based and anatomical measures. Shell weight appears to capture both overlapping and distinct aspects of the ring count, reflecting its unique relationship with the accumulated mass. This aligns with prior work by Mehta (2019) who concluded that shell weight is the most important attribute for predicting the age of abalone using a parallel plot. Statistical robustnessUnlike the study by Mehta (2019) this study applies statistical parametric methods, including RWA, Genizi metrics, and Shapley-based value, to separate the effects of correlated predictors. This provides a statistically inference-based view of predictor importance and a clearer understanding of their relative contributions. The RWA, Shapley values, and Genizi metrics support bootstrap CI estimation, allowing for more robust statistical inference. However, bootstrap CI can be somewhat liberal. Dominance analysis, as a non-parametric method, provides a deeper hierarchical perspective on predictor importance by comparing predictors based on their relative importance or dominance. Genizi (1993) approach uses the geometrical decomposition of R2 by transforming correlated predictors into an orthogonal basis via the square root of the correlation matrix to produce non-negative, orthogonal components whose sum equals the total R2. This approach performed well for Model (1). Since the presence of multicollinearity affects regression coefficients, the Genizi metric avoids this by focusing on variance explained rather than solely on coefficient size or significance, making it a robust choice predictor for relative importance analysis. In our experience, complex regression models, such as the linear regression model presented in Figure 1 of Zhang (2023) which includes two- and three-way interaction terms, pose challenges for the PMVD and Genizi metrics because they do not support higher-order terms. Dominance analysis can also be computationally intensive. However, relative weights and LMG methods performed well; however, interpreting higher-order terms can be challenging, particularly for relative weights. Finally, the analysis of a single dataset (e.g., the abalone dataset used here) using multiple relative importance methods does not necessarily provide much insight into which method provides the right answer and does not cover all aspects of statistical inference. Therefore, we recommend conducting larger studies to assess their statistical properties, especially in the presence of moderate and high multicollinearity and higher-order interaction terms. Practical application to the aquatic and veterinary sciencesThe findings regarding shell weight indicate that external structural mass may serve as a more dependable marker of biological maturity than internal tissue mass. The findings indicate that shell weight and shucked weight emerge as dominant age predictors, reinforcing their role as practical, non-invasive indicators for veterinarians conducting routine health checks and growth monitoring in abalone farms. These results indicate that aquatic veterinarians can prioritize measuring shell and meat weights to accurately estimate age without destructive sampling, thereby reducing stress and improving animal welfare. This analysis demonstrates that the abalone dataset provides valuable insights for aquatic veterinary medicine. By identifying the most informative age estimation predictors, veterinarians can streamline health assessments, optimize harvest timing, and detect growth anomalies that may signal environmental stress or disease. ConclusionThis study concludes that shell weight is the most important predictor of ring count, which serves as a proxy for the age of abalone. The results also indicate that both the relative weights and Genizi methods performed well and produced consistent results with narrow CIs. The dominance analysis offered deeper hierarchical insights but required substantial computational resources, especially for complex models such as linear regression models that include two- and three-way interaction terms. The findings also indicate that complex regression models pose challenges for PMVD and Genizi metrics because these approaches do not support higher-order terms (e.g., two- and three-way interaction terms). In contrast, the relative weights and LMG methods performed reliably and produced similar rankings; however, the interpretations of higher-order terms can still be challenging, particularly when RWA is used. Using literature-based datasets on abalone can provide veterinary researchers with a more comprehensive understanding of the biological, nutrition, and habitat factors influencing shellfish health and growth. Such a dataset contains complex, interrelated predictors, making the application of robust statistical techniques essential to separate these relationships. The incorporation of R-based analytical tools facilitates reproducible research while enabling the visualization and quantification of the relative importance of correlated predictors. This approach improves interpretability and strengthens biological insight and clinical decision-making, thereby enhancing research and diagnostic outcomes in aquatic veterinary science and marine biology. AcknowledgmentsNone. Conflict of interestThe authors declare no conflict of interest. FundingAll authors declare no funding to report. Authors’ contributionsAll authors contributed equally. Data availabilityAll data were provided in the manuscript. Extra data can be accessed at https://archive.ics.uci.edu/dataset/1/abalone. The R code for the analysis is available (Appendix A). Ethical approvalNot needed for this study. ReferencesAzen, R. and Budescu, D.V. 2003. The dominance analysis approach for comparing predictors in multiple regression. Psychol. Methods 8(2), 129. Burgess, K.E., Price, L.L., King, R., Kwong, M., Grant, E., Olson, K.A., Lyons, J.A., Robinson, N.A., Wendelburg, K.M. and Berg, J. 2021. Development and validation of a multivariable model and online decision-support calculator to aid in preoperative discrimination of benign from malignant splenic masses in dogs. J. Am. Vet. Med. Assoc. 258(12), 1362–1371. Chan, M. 2025. rwa: Perform a relative weights analysis. The Comprehensive R Archive Network, R package version 0.1.0. Available via https://CRAN.R-project.org/package=rwa Chantreuil, F. and Trannoy, A. 1999. Inequality decomposition values: the trade-off between marginality and consistency. Doctoral dissertation, auto-saisine. INRA Économie Documentation, Rennes, France. Chatterjee, S. and Ali S. H. 2006. Measuring the Quality of Fit. P39-42 in Regression Analysis by Example. 4th Edition. Hoboken, NJ: Wiley-Interscience. Available via https://onlinelibrary.wiley.com/doi/book/10.1002/0470055464 Chevan, A. and Sutherland, M. 1991. Hierarchical partitioning. Am. Statist. 45(2), 90–96. Cui, Y. and Xiao, Z. 2024. Abalone age prediction and analysis of influencing factors: combining machine learning, shap and correlation coefficient methods. Preprints. Edwards, P.T., Hazel, S.J., Browne, M., Serpell, J.A., Mcarthur, M.L. and Smith, B.P. 2019. Investigating risk factors that predict a dog’s fear during veterinary consultations. PLoS One 14(7), 215416. Feldman, B.E. 2005. Relative importance and value. Manuscript version 1.1, 2005-03-19. Rochester, NY: SSRN. Genizi, A. 1993. Decomposition of R² in multiple regression with correlated regressors. Stat. Sin. 3(2), 407–420. Grömping, U. 2007. Estimators of relative importance in linear regression based on variance decomposition. Am. Statist. 61(2), 139–147. Grömping, U. 2006. Relative importance for linear regression in R: the package relaimpo. J. Stat. Softw. 17(1), 1–27. Guney, S., Kilinc, I., Hameed, A.A. and Jamil, A. 2022. Abalone age prediction using machine learning. In Pattern recognition and artificial intelligence. Eds., Djeddi, C., Siddiqi, I., Jamil, A., Ali Hameed, A. and Kucuk, I. Cham, Switzerland: Springer, 1543. Guo, R., Luo, J. and Gao, W. 2021. A new method of measuring the age of abalone based on data visualization analysis. J. Phys. Conf. Ser. 1744, 42181. Hossain, M.M. and Chowdhury, M.N.M. 2019. Econometric ways to estimate the age and price of abalone, MPRA Paper 91210. Munich, Germany: University Library. Huettner, F. and Sunder, M. 2012. Axiomatic arguments for decomposing goodness of fit according to Shapley and Owen values. Electron. J. Statist. 6(none). Israeli, O. 2007. A Shapley-based decomposition of the R-Square of a linear regression. J. Econ. Inequality 5(2), 199–212. Johnson, J.W. 2000. A heuristic method for estimating the relative weight of predictor variables in multiple regression. Multivariate. Behav. Res. 35(1), 1–19. Johnson, J.W. and Lebreton, J.M. 2004. History and use of relative importance indices in organizational research. Org. Res. Methods 7(3), 238–257. Lebreton, J.M., Ployhart, R.E. and Ladd, R.T. 2004. A Monte Carlo comparison of relative importance methodologies. Org. Res. Methods 7(3), 258–282. Lindeman, R.H., Merenda, P.F. and Gold, R.Z. 1980. Introduction to bivariate and multivariate analysis. Glenview, IL: Scott Foresman. Luchman, J.N. 2024. domir: tools to support relative importance analysis. The Comprehensive R Archive Network, R package version 1.2.0. Available via https://CRAN.R-project.org/package=domir Luchman, J.N. 2021. Determining relative importance in Stata using dominance analysis: domin and domme. Stata. J. 21(2), 510–538. Mair, C., Matthews, L., De Cisneros, J.P.J., Stefan, T. and Stear, M.J. 2015. Multitrait indices to predict worm length and number in sheep with natural mixed predominantly Teladorsagia circumcincta infection. Parasitology 142(6), 773–782. Mehta, K. 2019. Abalone age prediction problem: a review. Int. J. Comput. Appl. 178(50), 43–49. Misman, M.F., Samah, A.A., Aziz, N.A., Majid, H.A., Shah, Z.A., Hashim, H. and Harun, M.F. 2019. Prediction of abalone age using regression-based neural network. In Proceedings of the 1st International Conference on Artificial Intelligence and Data Sciences (AiDAS), IEEE, Ipoh, Malaysia, pp 23–28. Nash, W., Sellers, T., Talbot, S., Cawthorn, A. and Ford, W. 1994. The Population Biology of Abalone (Haliotis species) in Tasmania. I. Blacklip Abalone (H. rubra) from the North Coast and the Islands of Bass Strait. Sea Fisheries Division. Marine Research Laboratories -Taroona, Department of Primary Industry and Fisheries. Hobart, Tasmania, Australia. Phu, D.H., Giao, V.T.Q., Truong, D.B., Cuong, N.V., Kiet, B.T., Hien, V.B., Thwaites, G., Rushton, J. and Carrique-Mas, J. 2019. Veterinary drug shops as main sources of supply and advice on antimicrobials for animal use in the Mekong Delta of Vietnam. Antibiotics 8(4), 195. Puig, A., Bernal, I., Sabaté, D., Isaac, B., Jordi, M., Lorena, N., Daniel, A. and Ramon, J. 2022. Comparison of effects of a single dose of MHYOSPHERE® PCV ID with three commercial porcine vaccine associations against Mycoplasma hyopneumoniae (Mhyo) and porcine circovirus type 2 (PCV2) on piglet growth during the nursery period under field conditions. Vet. Res. Commun. (46), 1167–1173; doi: 10.1007/s11259-022-09971-y Seedorff, J. and Cavanaugh, J.E. 2024. Assessing variable importance for best subset selection. Entropy, 26(9), 801; doi: 10.3390/e26090801 Shinn, H. 2022. Pinto Abalone (Haliotis kamtschatkana): Bibliography. Silver Spring, MD: NOAA Central Library; doi: 10.25923/ggpq-pk49 Suárez, E.L., Pérez, C.M., Rivera, R. and Martínez, M.N. 2017. Applications of regression models in epidemiology. Hoboken, NY: John Wiley & Sons. Tonidandel, S. and Lebreton, J.M. 2015. RWA Web: a free, comprehensive, web-based, and user-friendly tool for relative weight analyses. J. Business Psychol. 30(2), 207–216. Wooldridge, J.M. 1991. A note on computing r-squared and adjusted r-squared for trending and seasonal data. Econ. Lett. 36(1), 49–54. Zhang, C. 2023. Using abalone’s physical features to predict its age. Highlights. Sci. Eng. Technol. 47, 95–105. Appendix AR code for relative importance analysis of abalone data # PMVD, LMG, and genizi metrics included in the relaimpo package (non-US version) # 1. Fit the linear regression model model <- lm (rings ~ diameter + whole weight+ shucked weight+ viscera weight + shell weight, data=abalone) #2. Use the relaimp package boot_results <- boot.relimp (model, b=1000, type=c ("genizi","lmg", "pmvd"), rela=TRUE) boot_eval <- booteval.relimp(boot_results, typesel=c ("genizi","lmg", "pmvd"), level=0.95, bty="perc", nodiff=TRUE) ================================================================ # RWA using the rwa package: RWA_bootstrap <- rwa ( df=abalone, outcome="rings", predictors=c (“diameter", "whole weight", "shucked weight", "viscera weight", "shell weight"), bootstrap=TRUE, n_bootstrap=1000, conf_level=0.95 ) ================================================================ # Dominance analysis using the Domir package: Dom_results <-domir( rings ~ diameter + whole weight + shucked weight + viscera weight + shell weight, function(formula) { lm_model <- lm(formula, data=abalone ) summary(lm_model)[["r.squared"]] } ) ================================================================ | ||
 . Therefore, the total variation of the
| How to Cite this Article |
| Pubmed Style Masaoud E, Sirtiyah A, Abdulqadir M, Mohamed A, Khapoli A, Alshaybani K. Relative importance analysis of correlated predictors in aquatic veterinary science: Application to an abalone dataset. Open Vet. J.. 2026; 16(5): 3144-3154. doi:10.5455/OVJ.2026.v16.i5.55 Web Style Masaoud E, Sirtiyah A, Abdulqadir M, Mohamed A, Khapoli A, Alshaybani K. Relative importance analysis of correlated predictors in aquatic veterinary science: Application to an abalone dataset. https://www.openveterinaryjournal.com/?mno=299117 [Access: June 26, 2026]. doi:10.5455/OVJ.2026.v16.i5.55 AMA (American Medical Association) Style Masaoud E, Sirtiyah A, Abdulqadir M, Mohamed A, Khapoli A, Alshaybani K. Relative importance analysis of correlated predictors in aquatic veterinary science: Application to an abalone dataset. Open Vet. J.. 2026; 16(5): 3144-3154. doi:10.5455/OVJ.2026.v16.i5.55 Vancouver/ICMJE Style Masaoud E, Sirtiyah A, Abdulqadir M, Mohamed A, Khapoli A, Alshaybani K. Relative importance analysis of correlated predictors in aquatic veterinary science: Application to an abalone dataset. Open Vet. J.. (2026), [cited June 26, 2026]; 16(5): 3144-3154. doi:10.5455/OVJ.2026.v16.i5.55 Harvard Style Masaoud, E., Sirtiyah, . A., Abdulqadir, . M., Mohamed, . A., Khapoli, . A. & Alshaybani, . K. (2026) Relative importance analysis of correlated predictors in aquatic veterinary science: Application to an abalone dataset. Open Vet. J., 16 (5), 3144-3154. doi:10.5455/OVJ.2026.v16.i5.55 Turabian Style Masaoud, Elmabrok, Abulwahid Sirtiyah, Mohammed Abdulqadir, Asem Mohamed, Abdeulmajid Khapoli, and Kamal Alshaybani. 2026. Relative importance analysis of correlated predictors in aquatic veterinary science: Application to an abalone dataset. Open Veterinary Journal, 16 (5), 3144-3154. doi:10.5455/OVJ.2026.v16.i5.55 Chicago Style Masaoud, Elmabrok, Abulwahid Sirtiyah, Mohammed Abdulqadir, Asem Mohamed, Abdeulmajid Khapoli, and Kamal Alshaybani. "Relative importance analysis of correlated predictors in aquatic veterinary science: Application to an abalone dataset." Open Veterinary Journal 16 (2026), 3144-3154. doi:10.5455/OVJ.2026.v16.i5.55 MLA (The Modern Language Association) Style Masaoud, Elmabrok, Abulwahid Sirtiyah, Mohammed Abdulqadir, Asem Mohamed, Abdeulmajid Khapoli, and Kamal Alshaybani. "Relative importance analysis of correlated predictors in aquatic veterinary science: Application to an abalone dataset." Open Veterinary Journal 16.5 (2026), 3144-3154. Print. doi:10.5455/OVJ.2026.v16.i5.55 APA (American Psychological Association) Style Masaoud, E., Sirtiyah, . A., Abdulqadir, . M., Mohamed, . A., Khapoli, . A. & Alshaybani, . K. (2026) Relative importance analysis of correlated predictors in aquatic veterinary science: Application to an abalone dataset. Open Veterinary Journal, 16 (5), 3144-3154. doi:10.5455/OVJ.2026.v16.i5.55 |