


| Research Article | ||
Open Vet. J.. 2026; 16(3): 1893-1912 Open Veterinary Journal, (2026), Vol. 16(3): 1893-1912 Research Article Subchronic comparative assessment of graded ferrous sulfate doses on biochemical, histological, and multiorgan micromorphological changes in wistar ratsAteeqah Ghayth Alzwawy1,2*, Abdelhafidh Khazri3, Ahmed Kouki3, Manel Ben Ali4, Chayma Ben Fayala5, Mossadok Ben-Attia3, Ezzeddine Mahmoudi3, Mohsen Sakly2, Riadh Marrouchi6 and Haïfa Tounsi-Kettiti51Department of Zoology, Faculty of Sciences, University of Ajdabia, Ajdabia, Libya 2Laboratory of Integrated Physiology LR17ES02, Faculty of Sciences of Bizerte, Carthage University, Jarzouna, Tunisia 3Laboratory of Environment Biomonitoring LR01ES14, Faculty of Sciences of Bizerte, University of Carthage, Zarzouna, Tunisia 4Department of Biology, College of Sciences, Taif University, Taif, Saudi Arabia 5Laboratory of Human and Experimental Pathological Anatomy, Pasteur Institute of Tunis, Tunis El Manar University, PTunis-Belvédère, Tunisia 6Laboratory of Venoms and Therapeutic Biomolecules, Pasteur Institute of Tunis, Tunis El Manar University, Tunis-Belvédère, Tunisia *Corresponding Author: Ateeqah Ghayth Alzwawy. Department of Zoology, Faculty of Sciences, University of Ajdabia, Ajdabia, Libya. Email: atteqah.ghayth.alzwawy [at] uoa.edu.ly Submitted: 30/07/2025 Revised: 15/02/2026 Accepted: 27/02/2026 Published: 31/03/2026 © 2026 Open Veterinary Journal
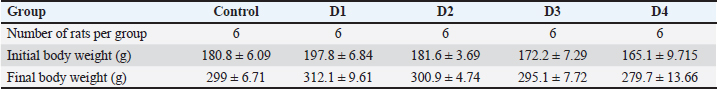
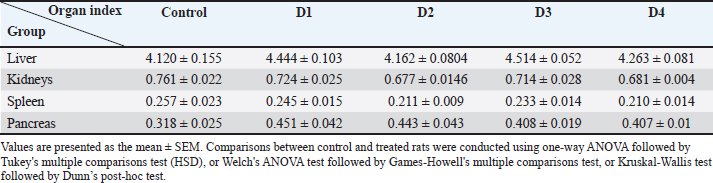
ABSTRACTBackground: Iron is a necessary trace element in the human body. However, excessive concentration can promote the overproduction of reactive oxygen species, leading to oxidative stress and organ injury. Aim: This study aims to evaluate the biochemical and micromorphological changes that occur following exposure to graded doses of ferrous sulfate in a rat model. Methods: The treated groups (D1, D2, D3, and D4) were orally and daily treated with graded doses of ferrous sulfate (12.5 mg/kg [D1], 25 mg/kg [D2], 50 mg/kg [D3], and 100 mg/kg [D4]) for 6 weeks, whereas the control group received only saline solution (0.9% NaCl solution at 5 ml/kg body weight) during the same period. Results: Different doses of ferrous sulfate did not cause mortality. Weekly control of glucose levels in all rats revealed a remarkable interaction effect (p=0.02) between treatment and time, indicating that the dynamics of change over time differed among the groups. Moreover, a significant effect was detected in the time factor (p < 0.001) and in the second factor, which refers to the treatments (p < 0.001). In addition, ferrous sulfate differentially altered the levels of oxidative stress biomarkers, including glutathione, catalase, glutathione-S-transferase, and malondialdehyde, as well as the acetylcholinesterase activity in a dose- and organ-dependent manner. Histopathological examination revealed signs of liver inflammation and pancreatic and kidney hyperemia. Prussian blue staining revealed no significant iron deposits in any organs. Conclusion: Excessive iron may cause oxidative damage to vital organs and alter blood glucose levels. Keywords: Iron overload, Multiple organ toxicity, Glycemia, Oxidative stress, Histopathology. IntroductionIron is an essential trace element required for numerous metabolic processes, including energy production, oxygen transport, and DNA synthesis (Fleischhacker and Kiley, 2011; Puig et al., 2017; Sarkar et al., 2018). It also contributes to immune function and host defense (Ganz and Nemeth, 2015). The human body typically contains 3–4 g of iron, mostly stored as ferritin and hemosiderin in the liver, spleen, and bone marrow (Cook et al., 2003). Approximately 1 mg of iron is lost daily through sweat and gastrointestinal waste (Marfil-Rivera, 2015). Adequate iron intake is vital for preventing malnutrition and maintaining normal cognitive and physiological functions, along with other essential elements such as zinc and selenium. For example, the fortification of foods with iron and zinc improves cognitive performance and nutritional status in pre-adolescents (Iftikhar et al., 2024). However, excess iron accumulation can be harmful. When iron exceeds its storage capacity, free Fe²⁺ ions promote the formation of reactive oxygen species (ROS) via the Fenton reaction, causing oxidative stress and cellular injury (Kell, 2009). Chronic iron overload contributes to liver, kidney, and pancreatic dysfunction and neurodegenerative disorders (Kaur et al., 2009; Salvador et al., 2011; Liu et al., 2023). A disrupted iron regulator system can significantly impact various organs through both systemic iron excess and deficiency (Xie et al., 2024). Thus, iron overload is most often accompanied by increased iron absorption from a normal diet, high doses of parenteral iron following multiple red blood cell transfusions or multiple intravenous iron infusions, and various human diseases (Marfil-Rivera, 2015). Iron overload has been linked to numerous human diseases, including hereditary hemochromatosis, thalassemia, and neurodegenerative diseases (Fleming and Ponka, 2012 ; Fernandez-Real and Manko, 2014 ; Brissot et al., 2018). Iron overload is accompanied by toxic accumulation in numerous vital organs, such as the liver (Che et al., 2020 ), pancreas (Tian et al., 2023), kidney (Dominguez et al., 2015; Ige et al., 2019; Geng et al., 2022), and spleen (Feng et al., 2021). Research on animals exposed to experimental iron overload (Atarashi et al., 2018) and on humans with hereditary hemochromatosis (Niemelä et al., 1999) has demonstrated that periportal iron deposition in hepatocytes is more intense than in the centrilobular zone. In ferroportin disease, iron accumulation occurs in Kupffer cells (Zoller et al., 2005), whereas it is marked in hepatocytes in hereditary hemochromatosis (Duarte et al., 2017). Liver atrophy and dysfunction can result from excess iron (Petrillo et al., 2021). Iron accumulation in the pancreas has also been reported in several genetic mutation models of iron overload (Lunova et al., 2017; Pelucchi et al., 2021). Significant iron accumulation was also observed in the exocrine and endocrine pancreatic tissues of iron-overloaded mice (Tian et al., 2023). Hyperglycemia, insulin resistance, pancreatic β-cell malfunction, and ultimately diabetes mellitus are shown to be caused by excessive iron deposition in the pancreas (Dominguez et al., 2015; Ige et al., 2019). Initial findings showed that rats with streptozotocin-induced diabetes had elevated iron levels in the kidneys. This indicates that both diabetes and excessive iron may contribute to kidney damage (Ige et al., 2019; Geng et al., 2022). Spleen injury is one of the most prevalent pathological findings in individuals with iron overload disorders (Badria et al., 2015). In the case of secondary iron overload, excess iron leads to increased hepatic hepcidin expression, which promotes iron sequestration by macrophages, particularly in the spleen (Ganz and Nemeth, 2015; Feng et al., 2021). Iron overload promotes the production of ROS and reactive nitrogen species in various vital organs, leading to oxidative damage to cellular molecules and impaired cellular function (Wang et al., 2020; Adel et al., 2021; Liang et al., 2023; Nassar et al., 2023). Thus, in iron-overloaded mice, an increase in pancreatic oxidative stress was reported with an elevated malondialdehyde (MDA) level and decreased superoxide dismutase and glutathione peroxidase (GPx) activities (Tian et al., 2023). Furthermore, an excess of hydroxyl free radicals and lipid peroxidation may also be catalyzed by iron overload, leading to oxidative stress and injury to renal tissue, which can cause organ dysfunction (Wang et al., 2020; Adel et al., 2021). Although iron is an important component in neuronal function, its accumulation in tissues has been associated with neurotoxicity. Excess iron in nervous tissue can exert toxic effects through ROS overproduction, mainly via the Fenton reaction, leading to oxidative stress and neuronal cell death (Bardestani et al., 2021). Cerebral iron deposition has been associated with severe neurodegenerative diseases, such as Alzheimer’s and Parkinson’s diseases (Kaur et al., 2009; Salvador et al., 2011). Ironis known to cross the blood–brain barrier and selectively accumulate in specific brain regions, where excessive deposition exerts profound neurotoxic effects (Dusek et al., 2022 ; Martins et al., 2022 ; Gao et al., 2014). In patients with spinal cord injury, iron accumulation in the motor cortex is mediated by nitric oxide (NO), a reactive free radical released from activated microglia, which regulates iron metabolism-related proteins and contributes to neuronal ferroptosis (Lu et al., 2015 ). At the molecular level, excessive iron in neuronal tissue catalyzes the Fenton and Haber–Weiss reactions, generating highly reactive hydroxyl radicals (OH•) that inflict oxidative damage on lipids, proteins, and nucleic acids (Bardestani et al., 2021). Oxidative stress disrupts mitochondrial integrity, impairs ATP synthesis, and activates intrinsic apoptotic pathways (Kaur et al., 2009). Iron-induced ferroptosis, characterized by iron-dependent lipid peroxidation and glutathione (GSH) and GPx4 depletion, further amplifies neuronal injury (Derry et al., 2020 ). Furthermore, iron overload disrupts calcium homeostasis, increases glutamate excitotoxicity, and interferes with dopamine metabolism. This leads to the formation of reactive quinones that worsen dopaminergic neuronal degeneration, especially in regions related to Parkinson’s disease (Salvador et al., 2011). These processes establish a vicious cycle of oxidative imbalance, neuroinflammation, and progressive neuronal loss that underpins the pathogenesis of various neurodegenerative disorders. Iron overload can sometimes arise as a side effect of anemia treatment. Ferrous sulfate is a common treatment, a supplement that is effective for addressing anemia. The recommended daily dose of ferrous sulfate for adults with mild to moderate iron deficiency anemia is 325 mg, which contains 65 mg of elemental iron. This dose should be divided into 3 separate doses throughout the day (Brittenham, 2018). The route of drug administration, whether intramuscular, intravenous, injected, or oral, is considered a valid and well-tolerated therapeutic strategy in treating human anemia (Liang et al., 2023; Nassar et al., 2023). However, the extent of iron overload’s side effects on tissues, such as the liver, pancreas, kidneys, and spleen, has not been well documented (Pavlakou et al., 2017). This study aimed to evaluate the pathological effects of iron overload in a rat model. This evaluation was conducted through the analysis of biochemical and histological parameters related to vital organs, with a specific emphasis on the association between excessive iron and oxidative stress. Materials and MethodsAnimals used and experimental designThirty male Wistar rats (180 ± 20 g), provided by the Pasteur Institute of Tunis, were housed, six per cage, in an environment with a 12 hours light/dark cycle at 23°C ± 2°C and a relative humidity of 62% to 70%. The rats were acclimatized 1 week before the start of the experiment. All animals were provided with water and standard food ad libitum (pellet food AIN-93G from Society Badr Utique-TN). In the experimental phase, the rats were randomly assigned to five groups, each consisting of six rats. The control group received daily oral administration of a saline solution (0.9% NaCl) at a dosage of 5 ml/kg for a duration of 6 weeks. The treated groups (D1, D2, D3, and D4) were given daily oral doses of ferrous sulfate (Batch No. 309210500-1017-111, BIOCHEM Chemopharma), which was prepared in a saline solution (0.9% NaCl) for the same 6-week period. The specific doses for the treated groups were as follows: D1, D2, D3, and D4 received 12.5, 25, 50, and 100 mg/kg of ferrous sulfate, respectively. In terms of elemental iron (Fe), these dosages correspond to 2.5, 5, 10, and 20 mg/kg, respectively. A geometric progression of 2 was used to select the range of the doses considered. These doses were chosen in accordance with the study of Mirhoseini Moosavi et al. (2015). Rats were extensively habituated to handling and intragastric infusion, with a weekly assessment of the body weight using an electronic balance before receiving saline solution or ferrous sulfate doses. At the end of the experiment, animals were decapitated after light anesthesia by placing each animal in a closed chamber containing ether until it lost its righting reflex (Liu et al., 1993). The liver, spleen, pancreas, and kidneys were immediately removed, washed with ice-cold buffer, weighed, and divided into two parts. The first part was preserved in 4% formalin solution for histological examination, and the second organ section was homogenized and stored at −80°C for subsequent biochemical analysis. Biochemical analysisBlood glucose levels and body weight assessmentAnimals were fasted overnight weekly, and water was given ad libitum. Blood samples (0.005 ml) were collected from the tail vein in a syringe without anesthesia. Glucose levels were monitored weekly using common clinical methods by an electronic blood glucometer validated for small animal use (Bionime Rightest GM550). Glucose levels are expressed as mg/dl. The body weight was also recorded until the day of sacrifice. Examination of oxidative stress biomarkers in rat tissuesGSH concentration was measured according to Ellman’s method (1959). In brief, the samples were deproteinized with 5% sulfosalicylic acid and centrifuged, and the supernatant was reacted with 0.01 M DTNB in 0.1 M phosphate buffer (pH 7.4). The absorbance was measured at 412 nm, and the GSH concentration was calculated using a standard curve (Ellman, 1959). The decomposition of hydrogen peroxide (H2O2) was studied by measuring the catalase (CAT) activity, as described by Aebi (1974). In addition, the Glutathione-S-transferase (GST) activity was assessed using a modified method based on Habig et al. (1974). Lipid peroxidation in the supernatants was evaluated by determining TBARS, which were quantified in terms of MDA concentration according to the method developed by Buege and Aust (1978). Lipid peroxidation in hepatic tissue was evaluated using a calorimetric approach, as outlined by Buege and Aust (1978). Neurotoxic potential assessment of ferrous sulfate using acetylcholinesterase (AChE) activityAChE activity was determined according to the method of Ellman et al. (1961) which measures the hydrolysis of acetylthiocholine iodide and the resulting colorimetric change at 412 nm in the presence of 5,5′-dithiobis-2-nitrobenzoic acid (DTNB), and the activity was expressed as AChE units per milligram of protein (extinction coefficient: 13.6 mM−1 cm−1). One AChE unit was defined as the enzyme amount required to hydrolyze 1 μmol of acetylthiocholine iodide per minute. The specific activity of the enzyme was defined as the units of enzyme activity per milligram of protein, as measured using bovine serum albumin as the standard. Histological analysisThe liver, pancreas, kidney, and spleen tissues excised immediately after sacrifice were histopathologically examined, rinsed in cold saline, and fixed in 4% neutral buffered formalin for 24 to 48 hours. After graded ethanol dehydration, xylene clearing, and paraffin embedding, 4-µm serial sections were obtained using a Leica microtome. Four non-consecutive sections were prepared for each organ and animal: − Three specimens were stained with hematoxylin and eosin for general morphology (Day, 2014). − One was stained with Prussian blue for iron detection (Lours et al., 2022). The slides were analyzed using a Zeiss Axiolab microscope equipped with an AXIOCAM 712 camera. Semi-quantitative evaluation of liver inflammation and necrosisPortal inflammation was evaluated on HE-stained liver sections using a semi-quantitative scoring system based on the Ishak score (Ishak et al., 1995) as follows: − 0=Absence of portal inflammation; − 1=Mild inflammatory infiltrate (5–15 mononuclear cells) involving 25% of portal tracts; − 2=Moderate inflammatory infiltrate (15–30 mononuclear cells) involving 25% to 50% of portal tracts, with or without early periportal extension; − 3=Severe inflammatory infiltrate (>30 mononuclear cells) involving more than 50% of portal tracts and marked periportal extension. Lobular necrosis was assessed by evaluating the number of necrotic cells and lobules. Scoring was performed in a blinded manner on all sections in at least 10 portal tracts and 10 lobules per section. Assessment of the iron depositionIron deposition was evaluated in Prussian blue-stained sections at 200× magnification (LPF) in at least 10 randomly selected fields per section and scored as follows: − 0=Absence of the iron deposit; − 1 (low)=Scattered positive cells representing 10% of the total cell population in the low-power field; − 2 (moderate)=Iron deposition involving 10% to 30% of the parenchymal cells; − 3 (high)=>30% of parenchymal cells with diffuse distribution in the LPF. For statistical and comparative analysis, scores 0 and 1 were classified as negative, whereas scores 2 and 3 were considered positive. Evaluation of vascular congestionVascular congestion (hyperemia) was defined as the dilation of capillaries and small vessels with erythrocyte accumulation in the absence of leukocytic infiltration or structural parenchymal damage and was recorded as present or absent in 10 fields per section. Statistical analysisThe data structure was first evaluated for normality using the Shapiro–Wilk test. If the data were normally distributed, Bartlett’s test was used to assess the equality of variance. For data that did not meet the normality assumption, the Brown–Forsythe test was used instead. In analyzing glucose level data, repeated measures analysis of variance (ANOVA) was used to examine differences between groups (effect of dose), within groups (effect of time), and the critical “dose × time” interaction. In addition, one-way ANOVA, Welch’s ANOVA, or the Kruskal–Wallis test was conducted to assess overall differences in biomarker activities between the control and treated groups. To compare the treatment groups with the control group, Tukey’s HSD, Games–Howell’s test, or Dunn’s multiple comparisons test were used. In all statistical significance tests, a p-value of ≤0.05 was considered to indicate a significant difference. GraphPad Prism software version 8 was used for all statistical analyses. Ethical approvalAll experiments were conducted in compliance with the National Institute of Health guidelines for the use and care of animals, as well as the local ethics committee of the Sciences Faculty of Bizerte (No. 1592023). ResultsBody weight and organ weightBody weight showed no significant changes (p > 0.05) after 6 weeks of ferrous sulfate exposure compared with the control group (Table 1). In addition, no mortality was observed in any group, and none of the rats in the study exhibited any signs of morbidity. Interestingly, the measurement of organ index, which serves as a primary indicator of potential toxicological effects of FeSO4, revealed that subacute treatment with increasing doses of FeSO4 did not significantly affect the relative weights of the liver, kidneys, and spleen compared with those of the control rats. Furthermore, a non-significant variation in the relative weight of the pancreas was noted ( Tables 1and 2). Table 1. Assessment of rat body weight (g) that received graded ferrous sulfate doses (12.5 mg/kg [D1], 25 mg/kg [D2], 50 mg/kg [D3], and 100 mg/kg [D4]) over 6 weeks.
Table 2. Assessment of the relative weight of organs (organ index) in rats that received varying iron doses (12.5 mg/kg [D1], 25 mg/kg [D2], 50 mg/kg [D3], and 100 mg/kg [D4]) over 6 weeks.
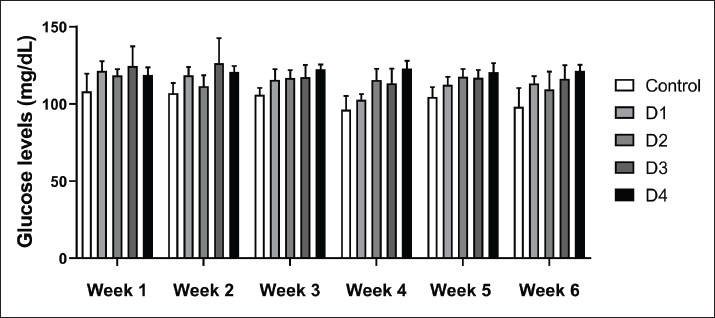
Evaluation of glucose levelsThe weekly assessment of blood glucose levels in rats treated with various doses of FeSO4 showed that both the duration of treatment (6 weeks) and the doses (D1, D2, D3, and D4) significantly affected this clinical marker (Fig. 1). Notably, a significant interaction was observed between time and dose (p=0.02), suggesting that the changes over time varied among the different study groups. In addition, the time factor had a highly significant effect (p < 0.001), and a significant main effect of dose was also found (p < 0.001).
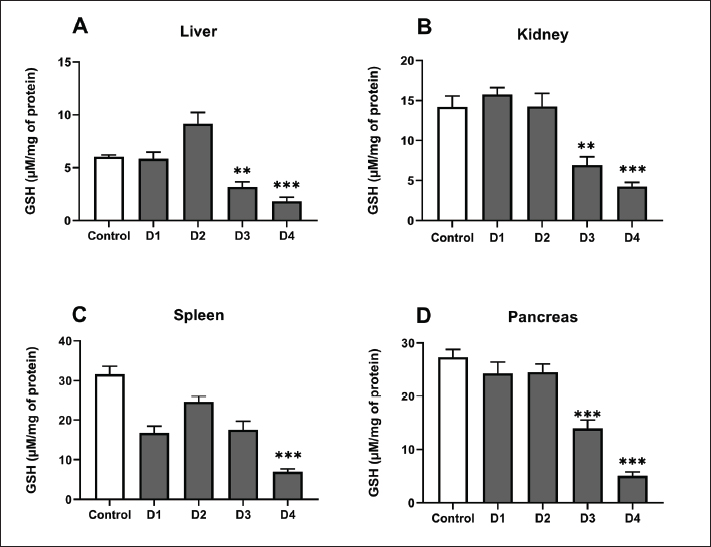
Fig. 1. Glucose levels of control and rats treated with different doses of ferrous sulfate (12.5 mg/kg [D1], 25 mg/kg [D2], 50 mg/kg [D3], and 100 mg/kg [D4]) for 06 weeks. Values are expressed as the mean ± SD. n=6 rats per group. Two-way repeated measures ANOVA, followed by Tukey HSD test was used to assess between- group differences, within-group differences (effect of time), and the dose × time interaction. Determination of oxidative stress biomarkerOxidative and neurotoxic markersGSH levelsGSH levels were evaluated in the kidney, liver, pancreas, and spleen following exposure to 4 different concentrations of ferrous sulfate (Fig. 2). Our results showed that the GSH levels were modulated. In the liver, GSH levels showed a biphasic response: GSH levels slightly increased after exposure to ferrous sulfate at concentrations of 12.5 mg/kg (D1, p > 0.64) and 25 mg/kg (D2, p=0.70) compared to the control group. However, GSH content decreased significantly after treatment with 50 mg/kg (D3, p= 0.001) and 100 mg/kg (D4, p < 0.001) (Fig. 2A). In the kidney (Fig. 2B), GSH levels decreased significantly following treatment with 50 mg/kg (D3, p=0.001) and 100 mg/kg (−68%, p < 0.001) of ferrous sulfate. In the spleen (Fig. 2C), GSH levels showed a different pattern, with a slight decrease at 12.5 (D1, p=0.07), 25 (D2, >0.99), and 50 (D3, p=0.10) mg/kg, which became more pronounced with the dose of 100 mg/kg (D4, −60%, p < 0.001) compared to control rats. Furthermore, pancreatic GSH contents showed a significant (p < 0.001) reduction only at D3 (p < 0.001) and D4 (Fig. 2D).
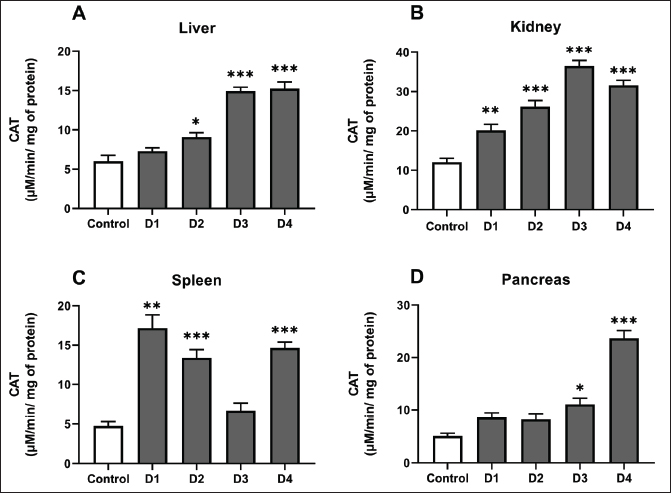
Fig. 2. GSH levels in the liver (A), kidneys (B), spleen (C) and pancreas (D) of control rats, and rats that received different ferrous sulfate doses (12.5 mg/kg [D1], 25 mg/kg [D2], 50 mg/kg [D3] and 100 mg/kg [D4]) for 6 weeks. Values are expressed as the mean ± SEM. n=6 rats per group. Comparisons between control and treated rats were conducted using Welch's ANOVA test followed by Games-Howell's multiple comparisons test (A); one-way ANOVA followed by Tukey HSD (B and D) and Kruskal-Wallis test followed by Dunn’s multiple comparisons test (C). * p < 0.05, ** p < 0.01; *** p < 0.001. CAT activityCAT activity was measured in the kidney, liver, pancreas, and spleen of rats exposed to different doses of ferrous sulfate (Fig. 3). In the liver, the activity of this antioxidant enzyme increased significantly, reaching a peak of approximately 15.23 ± 3.74 µmol/min/mg protein (+82%, p < 0.001) at the dose 100 mg/kg (Fig. 3A). In the pancreas, CAT activity rose from 5.1 ± 2.26 µmol/min/mg protein in the control group to 23.67 ± 2.07 µmol/min/mg protein (+364%, p < 0.001) in the pancreas of rats treated with 100 mg/kg of ferrous sulfate, indicating a strong adaptive antioxidant response (Fig. 3D). The highest CAT activity was detected in the kidneys compared with other organs, showing a significant increase even at the low dose (12.5 mg/kg) (p < 0.01). This increase peaked at doses of 50 (p < 0.001) and 100 mg/kg (p < 0.001) compared with the control (Fig. 3B). In the spleen, CAT activity showed a significant increase in this enzymatic marker at lower doses D1 and D2 (p < 0.001) and became more significant at D4 (p < 0.001) compared with that in the control animals. This suggests that enzymatic adaptation to oxidative stress is effective (Fig. 3C).
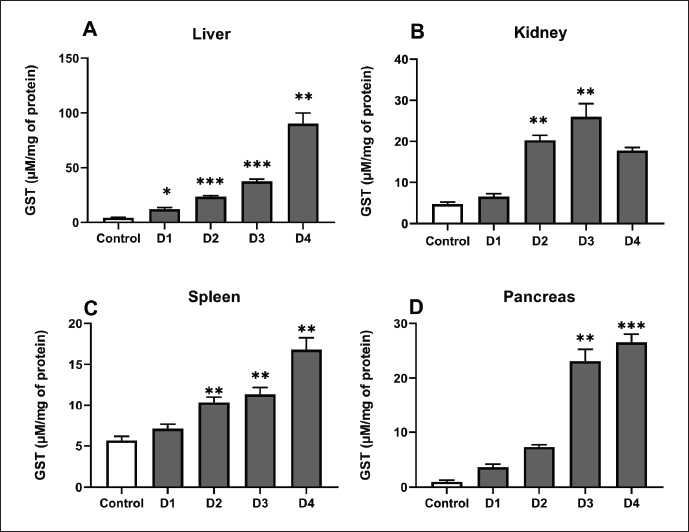
Fig. 3. CAT activity in the liver (A), kidneys (B), spleen (C) and pancreas (D) of control rats, and rats treated with different ferrous sulfate doses (12.5 mg/kg [D1], 25 mg/kg [D2], 50 mg/kg [D3] and 100 mg/kg [D4]) for 06 weeks. Values are expressed as the mean ± SEM. n=6 rats per group. Comparisons between control and treated rats were conducted using one-way ANOVA followed by Tukey HSD test (A–C) and Kruskal-Wallis test followed by Dunn’s multiple comparisons test (D). * p < 0.05, ** p < 0.01; *** p < 0.001 compared to the control rats. GST activityThe GST activity in the liver, kidney, pancreas, and spleen was evaluated following exposure to increasing doses of ferrous sulfate (Fig. 4). Overall, the GST activity increased in all examined organs, reflecting enhanced detoxification and antioxidant defense in response to oxidative stress. In the liver (Fig. 4A), GST activity displayed the most pronounced elevation in D2 (p < 0.001), D3 (p < 0.001), and D4 (p < 0.001), rising progressively with iron exposure and reaching a maximum of 90.26 ± 26.55 µmol/min/mg protein at 100 mg/kg, representing an increase of approximately (+78%, p < 0.001). A moderate but significant increase was observed in the kidney at (D2, p < 0.006) and (D3, p < 0.002) (Fig. 4B). In comparison to the control animals, a significant increase in enzymatic activity was observed in the spleen supernatants at doses of 25 mg/kg (D2, p=0.002), 50 mg/kg (D2, p=0.002), and 50 mg/kg (D4, p=0.002). However, no significant variation was observed at the 12.5 mg/kg dose (D1, p=0.38; Fig. 4C). Importantly, the results showed a significant increase in this enzymatic marker in the pancreas at doses of 50 mg/kg (D3, p=0.001) and 100 mg/kg (D4, p < 0.001) compared with the control rats (Fig. 4D).
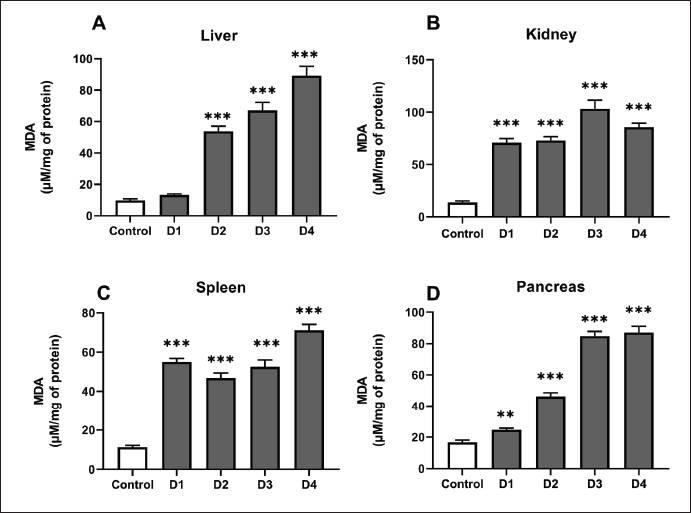
Fig. 4. GST activity in the liver (A), kidney (B), spleen (C) and pancreas (D) of control, and rats treated with different ferrous sulfate doses (12.5 mg/kg [D1], 25 mg/kg [D2], 50 mg/kg [D3] and 100 mg/kg [D4]) for 06 weeks. Values are expressed as the mean ± SEM. n=6 rats per group. Comparisons between control and treated rats were conducted using Welch's ANOVA test followed by Games-Howell's multiple comparisons test (A and C), and Kruskal-Wallis test followed by Dunn’s multiple comparisons test (B and D). * p < 0.05, ** p < 0.01; *** p < 0.001 compared to the control rats. MDA levelsThe degree of lipid peroxidation in tissues was assessed using MDA levels (Fig. 5). In the liver of control rats and those receiving the lowest ferrous sulfate dose (12.5 mg/kg), the MDA levels were approximately 9.79 ± 5.78 and 13.33 ± 2.5 µmol/mg of protein, respectively, but the difference was not statistically significant (p=0.11). However, at 25 mg/kg, the level of MDA in the liver of treated rats increased significantly (p < 0.001) in a dose-dependent manner. At the highest dose of 100 mg/kg, the MDA level reached a maximum of approximately 89.20 ± 23.71 µmol/mg of protein (+810%, p < 0.001) (Fig. 5A). Exposure to ferrous sulfate induced a significant increase in MDA levels in the pancreas (Fig. 5D) as observed in the liver. The highest doses (D2, D3, and D4) resulted in a highly significant (p < 0.001) increase in MDA levels in both the kidney (Fig. 5B) and spleen (Fig. 5C).
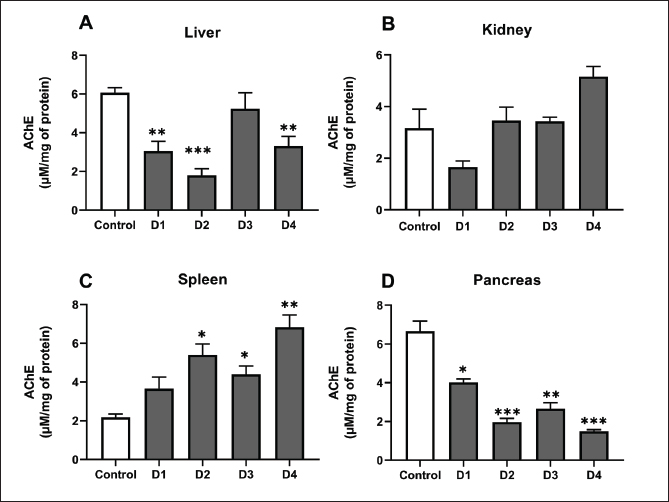
Fig. 5. MDA levels in the liver (A), kidney (B), spleen (C) and pancreas (D) of control rats and rats exposed to different ferrous sulfate doses (12.5 mg/kg [D1], 25 mg/kg [D2], 50 mg/kg [D3] and 100 mg/kg [D4]) for 06 weeks. Values are expressed as the mean ± SEM. n=6 rats per group. Comparisons between control and treated rats were conducted using Welch's ANOVA test followed by Games-Howell's multiple comparisons test. ** p < 0.01, *** p < 0.001 compared to the control rats. AChE activityAfter 6 weeks of treatment, AChE activity showed distinct variations across the studied organs, reflecting a dose-dependent influence of ferrous sulfate (Fig. 6). In the liver, AChE activity decreased significantly (−52%, p < 0.003) at the dose 12.5 mg/kg and significantly decreased (72%, p < 0.001) at 25 mg/kg. At 50 mg/kg (5.24 ± 0.97 µmol/min/mg, −18%), no significant difference (p= 0.80) was noted, whereas at 100 mg/kg (3.32 ± 0.70 µmol/min/mg, −48%), the decrease was again significant (p < 0.01) (Fig 6A). In the pancreas, a significant decline (p= 0.02) was recorded at 12.5 mg/kg (4.32 ± 0.48 µmol/min/mg, −35%), followed by a significant decrease (p < 0.001) at 25 mg/kg (1.98 ± 0.86 µmol/min/mg, −70%) and 50 mg/kg (2.66 ± 1.02 µmol/min/mg, −60%, p=0.001). The inhibition was more pronounced and highly significant (p < 0.001) at 100 mg/kg (1.50 ± 0.68 µmol/min/mg, −77%) compared with the control (6.66 ± 1.27 µmol/min/mg) (Fig. 6A). In the spleen, AChE activity increased significantly (p=0.01) at 25 mg/kg at 25 mg/kg (5.39 ± 1.41 µmol/min/mg, +147%) compared with the control (2.18 ± 0.89 µmol/min/mg). At 50 mg/kg (4.40 ± 1.06 µmol/min/mg, +102%), the increase remained significant (p=0.01), whereas at 100 mg/kg (6.83 ± 1.57 µmol/min/mg, +213%), the increase was highly significant (p=0.003), with no significant change at 12.5 mg/kg (p=0.25) compared with the control group (Fig. 6C).
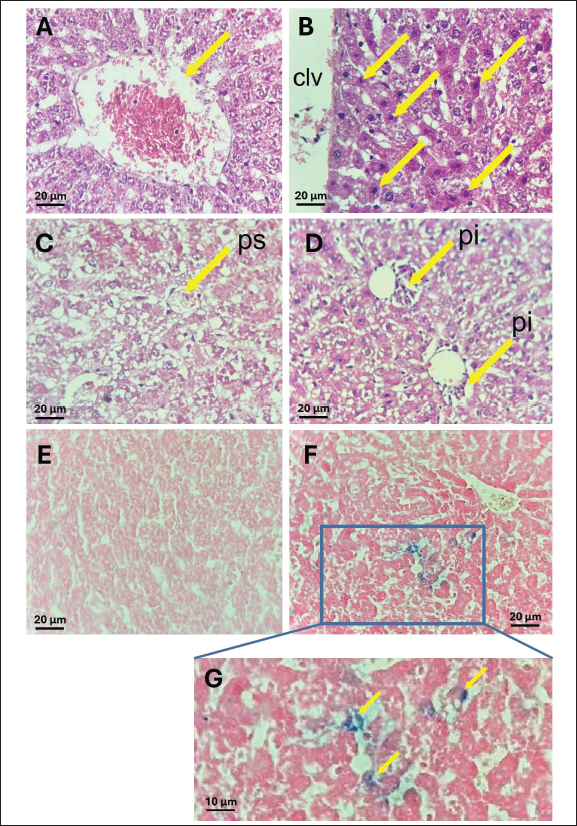
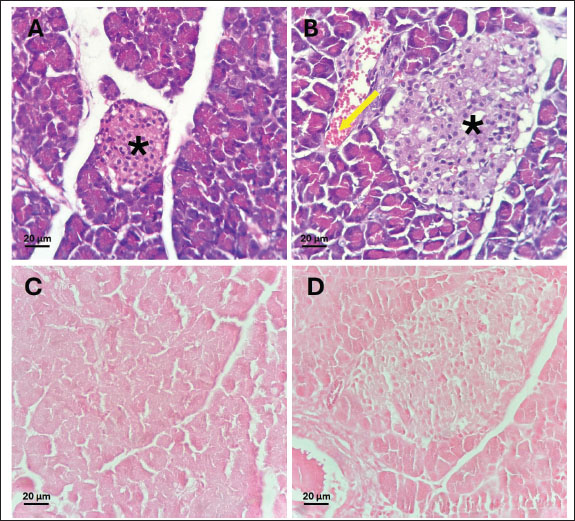
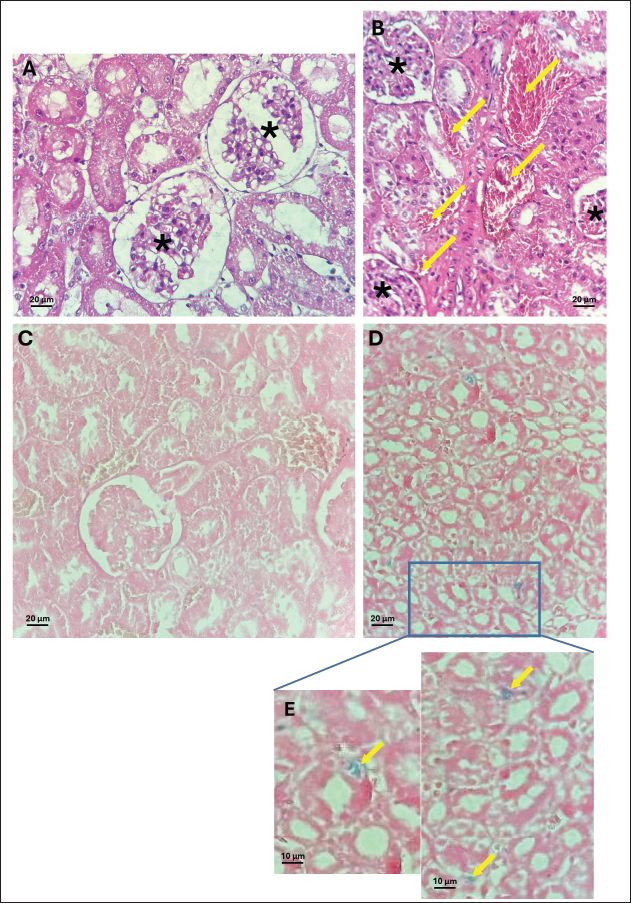
Fig. 6. Acetylcholinesterase activity in the liver (A), kidney (B), spleen (C) and pancreas (D) of control, and rats treated with different ferrous sulfate doses (12.5 mg/kg [D1], 25 mg/kg [D2], 50 mg/kg [D3] and 100 mg/kg [D4]) for 06 weeks. Values are expressed as the mean ± SEM. n=6 rats per group. Comparisons between control and treated rats were conducted using one way ANOVA followed by Tukey HSD (A and D) and Welch's ANOVA test followed by Games-Howell's multiple comparisons test (B, C). * p < 0.05, ** p < 0.01, *** p < 0.001 compared to the control rats. In the kidney, a non-significant decrease (p=0.38) was observed at 12.5 mg/kg (1.66 ± 0.67 µmol/min/mg) compared with the control (3.17 ± 1.84 µmol/min/mg). In addition, non-significant increase (p > 0.99) was noted at 25 mg/kg (3.46 ± 1.65 µmol/min/mg, +9%) and 50 mg/kg (p > 0.99) (3.40 ± 0.66 µmol/min/mg, +7%). However, at the highest dose (100 mg/kg), AChE activity increased slightly (p= 0.21) to 5.16 ± 1.45 µmol/min/mg compared with the control group. Histological studyThe control samples from the liver, pancreas, kidneys, and spleen exhibited normal histological features, serving as a baseline for comparison with treated groups. At doses of 12.5, 25, and 50 mg/kg, no detectable effects were observed in any of the examined organs, whereas the higher dose (100 mg/kg) induced histopathological changes. The liver maintained its normal architecture in rats treated with 100 mg/kg of ferrous sulfate, showing no signs of congestion or steatosis (Fig. 7A, C). However, hepatocytes displayed eosinophilic cytoplasm with condensed nuclei (Fig. 7B), indicating hypoxic changes. These eosinophilic cells were randomly scattered among normal hepatocytes around the centrilobular vein in approximately 60% of the lobules. In addition, mild portal inflammation was observed in 10% of the portal spaces, without extending into the lobules or causing fibrosis (Fig. 7D) and was scored as 1. Prussian blue staining revealed a weak iron deposit in some perivascular Kupffer cells (<10%) in the liver (scored 1) (Fig. 7F, G). These changes in the liver tissue likely resulted from oxidative stress. Pancreas micrographs demonstrated the presence of hyperemia in rats treated with 100 mg/kg of ferrous sulfate (Fig. 8B), suggesting possible effects on microcirculation and blood flow in this organ. However, no significant histological changes were detected in the pancreatic tissue, particularly in the islets of Langerhans. Prussian blue staining revealed no iron deposits in the pancreas (scored 0; Fig. 8C, D). Furthermore, no evidence of inflammatory changes or hyperemia was observed at lower doses; however, hyperemia without inflammation was evident in the kidneys of rats receiving 100 mg/kg of FeSO4 (Fig. 9B), indicating potential effects on renal microcirculation. Prussian blue staining revealed weak iron deposits in several kidney tubular cells (scored 1; Fig. 9D, E). These findings suggest that treatment with ferrous sulfate caused mild alterations in renal blood flow, with some iron accumulation, but no significant histological damage was observed. No significant changes were observed in the spleen histological examination in rats treated with 100 mg/kg of ferrous sulfate, suggesting that this organ may not be affected significantly by the treatment (Fig. 10A and B). During our study, only scores of 0 and 1 (<10%) were observed, corresponding to the absence and low level of iron deposition, respectively. In contrast, no cases with scores of 2 (10%–30%) or 3 (>30%) were detected, indicating the absence of moderate or extensive iron deposits in all the analyzed samples.
Fig. 7. Photomicrographs of the liver tissue (Magnification 40X/0.65). (A and C) Controls; (B and D) Hematoxylin and eosin staining for 100 mg/kg ferrous sulfate-treated group B: hepatocytes exhibiting eosinophilic cytoplasm with condensed nuclei (arrows) around the centrilobular vein (clv). D: Mild portal inflammation (pi) (5–15 mononuclear cells) observed in <25% of portal spaces (ps) (arrows) without fibrosis or extension into the lobules. extending into the lobules or causing fibrosis. Perls Prussian blue staining in the liver (E and F). E (control): absence of hemosiderin deposit. F: Blue deposit in Kupfer cells (score 1) in rats treated with 100 mg/kg ferrous sulfate. G (zoom): Deposit in Kupfer cells.
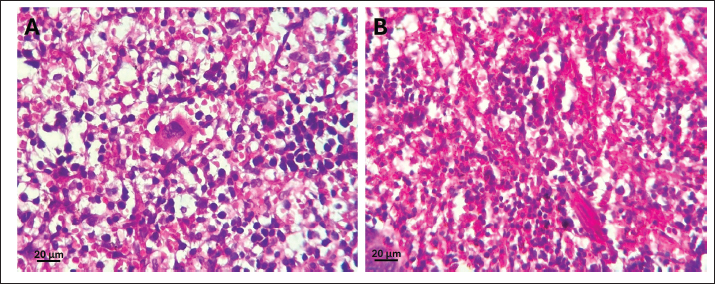
Fig. 8. Photomicrographs of HE stained pancreas tissue (Magnification 40X/0.65). (A) Control and (B) 100 mg/kg ferrous sulfate-treated group. B: Noteworthy congestion (arrows) is observed in the pancreas. C and D: Perls Prussian blue staining in the pancreas of rats. Absence of deposit (score 0) in C (control) and in D (100 mg/kg). *: Islets of Langerhans.
Fig. 9. Photomicrographs of HE stained kidney tissue. (A) Control (magnification 40X/0.65) and (B) 100 mg/kg ferrous sulfate-treated group. B: Congestion in interstitial veins of renal tissues (arrows) (magnification 40X/0.65). (C and D): Perls Prussian blue staining in the kidney of rats. C: control, absence of hemosiderin deposit (magnification 40X/0.65). D: (100 mg/kg), small tubular deposit of iron (score 1) (Magnification 10X/0.25). E (zoom on D): Deposit in several tubular cells (arrow). *: Glomeruli.
Fig. 10. Photomicrographs of spleen tissue (Magnification 40X/0.65). (A) Control. (B): Spleen tissue of the 100 mg/kg treated group showing no significant alterations compared to the control. DiscussionOur study showed that treatment with ferrous sulfate affects glucose levels. In fact, an increase in glycemia was observed in treated rats in a dose-dependent manner. This finding is consistent with earlier research indicating that iron overload could be one of the possible cofactors contributing to glycemic disorder (Wang and Babitt, 2019). Excessive iron accumulation enhances oxidative stress through the Fenton reaction, generating ROS that impair pancreatic β-cell function, decrease insulin synthesis, and promote β-cell apoptosis. Furthermore, excess iron stimulates hepatic gluconeogenesis and reduces glucose uptake in peripheral tissues, thereby contributing to insulin resistance (Simcox and McClain, 2013; Fernández-Real and Manco, 2014). Previous research has revealed that large-body iron storage or high iron dosages given to animals may cause diabetes symptoms, such as insulin resistance and hyperglycemia (Awai et al., 1979; Bao et al., 2012). Furthermore, in patients with beta-thalassemia, the continuous accumulation of exogenous iron by transfusion responsible for iron overload, leading to metal deposition in the pancreas, resulting in glucose intolerance with, reduced circulating insulin concentration due to beta cell depletion and hepatic disturbance of insulin use (Cavallo-Perin et al., 1995; Olivieri, 1999). Elevated iron levels in tissues have been linked to multiple genetic factors and medical disorders, such as specific types of cancer, heart and liver diseases, diabetes, irregular hormone levels, and immune system dysfunctions (Forciniti et al., 2020; Nairz and Weiss, 2020 ; Ni et al., 2022; Harrison et al., 2023). In this work, iron exposure modulated the non-enzymatic and enzymatic antioxidative stress parameters in a concentration- and organ-dependent manner. The non-enzymatic status was first evaluated by GSH content following exposure to different doses of ferrous sulfate in the liver, pancreas, spleen, and kidney. GSH is a tripeptide that is primarily involved in shielding mitochondria from ROS toxicity and in controlling cell division, metabolism, and apoptosis (Marí et al., 2013). Furthermore, GSH is an essential antioxidant defense agent, serving as a free radical scavenger, a cofactor for nucleophilic conjugation, and a proton donor in important antioxidant metabolic processes (Franco et al., 2007). Our findings demonstrate a biphasic (hormetic) response of GSH to ferrous sulfate exposure, reflecting distinct molecular adaptations to increasing oxidative stress. At the lowest dose (25 mg/kg), the elevation of GSH suggests activation of redox-sensitive transcription factors such as Nrf2, which binds to the antioxidant response element (ARE) and enhances the transcription of genes involved in GSH synthesis and recycling (Nguyen et al., 2009 ; Marí et al., 2013). This adaptive response indicates that iron acts as a signaling molecule at sub-toxic levels, promoting antioxidant defense activation rather than causing damage. However, at higher doses (50 and 100 mg/kg), excessive iron catalyzes Fenton and Haber–Weiss reactions, resulting in uncontrolled ROS generation. This leads to the rapid oxidation of reduced GSH to GSSG and inhibits GSH reductase-mediated regeneration, ultimately causing GSH depletion and redox disequilibrium (Franco et al., 2007; Ma et al. (2019); Kocpinar et al., 2020). GSH depletion not only compromises cellular antioxidant capacity but also promotes oxidative stress–induced signaling pathways associated with apoptosis and mitochondrial dysfunction. To counterbalance GSH depletion, cells enhance enzymatic antioxidant responses, particularly CAT, which plays a central role in neutralizing hydrogen peroxide and preventing hydroxyl radical formation (Orbea et al., 2002; Takano et al., 2003; Pi and Collins, 2010). The observed increase in CAT at higher iron doses reflects an adaptive molecular mechanism aimed at maintaining redox homeostasis, highlighting the dual role of iron as both a metabolic cofactor and a driver of oxidative toxicity. Overall, these molecular interactions underscore the dynamic nature of oxidative stress response and the critical balance between protective adaptation and toxic overload. In the present investigation, the exposure of rats to graded doses of ferrous sulfate dose-dependently increased CAT activity in different organs in response to hydrogen peroxide production. The high induction of CAT activity, mainly in the liver, could be related to the biological function of this organ, representing the main storage organ for iron and, therefore, the major site of free radical formation (Algharib, 2016). The iron-induced oxidative stress revealed in our study agrees with the results of Galaris et al. (2019)showing that iron accumulation can eventually exceed the capacity of iron storage, leading to the emergence of unshielded redox-active iron and promoting oxidative stress. The increase in CAT activity following oral iron therapy is a sign of improved redox status (Kurtoglu et al., 2003). Besides catalase, GST is also among the antioxidant enzymes involved in protecting cells against oxidative damage because of its high specific catalytic activity toward reactive aldehydes and related oxidants (Singhal et al., 1999). The GST catalyzes the conjugation of GSH to hydroxyalkyls (Hayes and Pulford, 1995). The induction of GST in response to iron exposure may represent a protective response against oxidative stress. Our results agree with previous findings suggesting that iron treatment induces oxidative stress in rats, which is correlated with an increase in GST activity in the liver (Khan et al., 1995; Tjalkens et al., 1998). In this study, iron administration increased GST activity in all the examined organs. However, the highest GST levels were observed in the liver of rats exposed to 100 mg/kg of GST. This finding supports the observation by Desmots et al. (2002) in iron-exposed mice. These authors suggested that GST is differentially regulated in the liver and its induction is related to free radical overproduction. This result could also be related to the fact that the liver is the main organ of iron storage (Siddique and Kowdley, 2012). Recent studies have shown that the initial pathological shifts in cellular injury are intricately linked to ROS accumulation (Imai et al., 2019; Liu et al., 2020). ROS, such as superoxide (O2˙−) or H2O2, emerge as byproducts of oxygen produced during physiological activities, such as mitochondrial respiration. At the physiological level, ROS serve as crucial signaling molecules in safeguarding cellular metabolism (Scherz-Shouval and Elazar, 2011; Sinenko et al., 2021). However, an abundance of ROS can result in considerable cellular and molecular harm, potentially fueling inflammation and inflicting tissue injury (Biasi et al., 2013). Prolonged exposure to iron over 6 weeks can induce varying levels of liver damage, including steatosis, mitochondrial impairment, and liver cell demise (Ho et al., 2013; Frijhoff et al., 2015). The tissue MDA content, a well-established marker of lipid peroxidation, is another important indicator of redox imbalance (Bozkurt et al., 2018). Free radicals, especially ROS, are major contributors to oxidative damage. Through the Fenton reaction, Fe²⁺ reacts with H₂O₂ to generate highly reactive hydroxyl radicals that initiate lipid peroxidation cascades (Zhang et al., 2022). The resulting MDA accumulation reflects the oxidative degradation of cell membranes and the extent of cellular injury (Ohkawa et al., 1979). In this study, MDA levels in the liver, kidney, pancreas, and spleen increased proportionally with iron dosage, indicating a dose-dependent increase in oxidative stress. These findings are consistent with earlier reports showing elevated MDA levels in the organs of iron-treated rats (Shivarajashankara et al., 2003; Sripetchwandee et al., 2014 ). The increase in MDA levels in the kidney was histologically associated with hyperemia and mild iron deposits. This suggests that lipid peroxidation-induced membrane damage contributes to the observed microvascular alterations. The relationship between iron overload and neurotoxicity is well recognized, particularly in neurodegenerative diseases such as Alzheimer’s and Parkinson’s disease, where iron dysregulation promotes oxidative stress and neuronal injury through ROS generation and mitochondrial impairment (Xu et al., 2017). Although these mechanisms illustrate the neurotoxic potential of excessive iron in mammals, the present study analyzed visceral tissues of rats, where enzymatic responses reflect systemic oxidative stress rather than neural dysfunction. The biomarkers examined CAT, GST, and GSH are general indicators of oxidative and detoxification capacity across tissues. Thus, the observed variations in their activities indicate metal-induced oxidative disturbances in the soft tissues of the organism, serving as reliable markers of environmental contamination rather than neuron-specific effects. AChE hydrolyzes acetylcholine to terminate nerve impulses at the synaptic cleft (Lionetto et al., 2013). In this regard, AChE is a critical target for iron toxicity (Pohanka, 2014). AChE is primarily produced in the brain. However, it is also found in various other non-nervous tissues throughout the body, including the muscle, liver, pancreas, spleen, and kidney, where it plays a crucial role in regulating the levels of acetylcholine. In addition, AChE regulates organ functions and redox state (Dumont et al., 1984; Grubič et al., 1999; Nieto-Cerón, 2004; Kocyigit et al., 2017). Previous research has revealed the capability of AChE to protect low-density lipoproteins against metal-induced oxidation (Park et al., 2021). These findings imply that AChE can prevent the initiation of lipid oxidation, thereby inhibiting the early formation of oxidative products, including lipid peroxides (Fuhrman et al., 2004). Our results indicated that the pattern of AChE activity varied among organs, showing dose- and tissue-specific responses. AChE activity in the liver initially decreased at lower iron doses (12.5 and 25 mg/kg), followed by a gradual increase that peaked at 50 mg/kg. In contrast, at higher doses, the pancreas exhibited a more pronounced and persistent inhibition of AChE activity. Conversely, in the kidney and spleen, AChE activity progressively increased with increasing iron concentrations, reaching its highest level at 100 mg/kg. The initial decrease in hepatic and pancreatic AChE activity may be attributed to oxidative deactivation of the enzyme, as ROS can oxidize critical thiol groups and alter the conformation of active sites, thereby reducing catalytic efficiency (Schallreuter et al., 2004; Cai et al., 2013). Cellular membrane lipid peroxidation, which often accompanies iron-induced oxidative stress, can further disrupt the microenvironment of membrane-bound AChE, leading to enzyme inhibition. In the pancreas, such inhibition might also interfere with the cholinergic regulation of insulin secretion, which is highly sensitive to redox imbalance. In contrast, the elevated AChE activity in the kidney and spleen may reflect a compensatory response to sustained oxidative stress. Increased enzyme activity under such conditions could be part of a stress-adaptive or immunomodulatory mechanism, as AChE plays a regulatory role in the cholinergic anti-inflammatory pathway (Pohanka, 2014). As an adaptive response to oxidative and inflammatory stress, iron overload may activate redox-sensitive transcription factors, leading to the upregulation of AChE gene expression (Gandhi and Abramov 2012; Kawabata, 2022; Ru et al., 2024). In the kidney, enhanced AChE activity could also help preserve ionic and osmotic homeostasis under metal-induced stress (Cortese et al., 2016). Overall, these findings highlight that iron exposure triggers organ-specific modulation of AChE, where inhibition in the liver and pancreas likely results from direct oxidative damage, while activation in the kidney and spleen may represent an adaptive or compensatory mechanism to counteract oxidative and inflammatory challenges. This dual pattern underscores the complex interplay among oxidative stress, enzyme regulation, and tissue-specific function in response to iron overload. Long-term iron exposure in rats can result in varying degrees of cellular damage, affecting cell membrane integrity, mitochondrial function, and organ integrity, such as the liver, kidney, pancreas, and spleen. Our findings unequivocally confirmed that an overabundance of iron can induce adverse effects on cellular integrity. Excess iron may be a catalyst for cellular damage. Our histopathological investigations showed that ferrous sulfate (100 mg/kg) administration to rats over 6 weeks caused inflammation and hyperemia in the liver, pancreas, and renal tissues. These findings align with previous studies that reported that mice induced chronic pancreatitis by repeated intraperitoneal injections of iron dextran at a dose of 120 mg/kg for 12 weeks (Tian et al., 2023). An excess of free and insoluble Fe2+ can infiltrate organs, deposit in local tissues, and damage cytomembranes and organelles (Fernández-Real and Manco, 2014). In our study, minor structural alterations, such as congestion, inflammation, and hyperemia, were observed in the pancreas, kidneys, and liver at the highest dose of 100 mg ferrous sulfate, which may be attributed to the relatively low doses used compared with those used in previous research (Lash and Saleem, 1995). Apart from liver and heart complications, the pancreas is frequently affected in cases of iron overload syndromes (Lunova et al., 2017). Iron overload may also lead to toxic accumulation in other organs, including the joints and endocrine glands (Tian et al., 2023). In a recent study, Punchai et al. (2024)investigated the molecular impact of iron excess on kidney cell lines and demonstrated that iron overload caused significant cell death by activating molecular mechanisms in the ferroptosis and apoptosis pathways, enhancing lipid oxidation, decreasing GPx levels, and altering renal function (Punchai et al., 2024). Recent evidence suggests the involvement of additional pathways, including ferroptosis, in iron overload toxicity (Bao et al., 2012; Yu et al., 2021). Ferroptosis is an iron-dependent form of non-apoptotic cell death that involves protein and lipid oxidation (Chen et al., 2023; Punchai et al., 2024; Zhang and Xie, 2024). Decreased GSH and GPx levels during ferroptosis lead to lipid peroxidation in the presence of iron (Nassar et al., 2023). Thus, iron excess induces ferroptosis via the Fenton reaction and ROS accumulation in the liver (Xing et al., 2022) and kidney (Punchai et al., 2024). Similarly, ferroptosis is recognized as an important iron-dependent form of regulated cell death in pancreatic beta cells, leading to decreased insulin secretion and insulin resistance (Miao et al., 2023). Prussian blue staining, employed to identify iron accumulation in organs, revealed a weak deposit in the liver and kidney, confirming iron overload. None was found in the pancreas or spleen. Both the liver and kidneys are the primary organs involved in iron management, storage, and regulation (Gao et al., 2014; Dev and Babitt, 2017; Wang and Babitt, 2019). Our findings may help explain the modest effects of ferrous sulfate on tissue histopathology, which is consistent with earlier findings that showed elevated serum iron levels after oral administration of ferrous sulfate at a dose of 100 mg/kg (Kaur et al., 2009). In contrast, a significant deposit was reported in the pancreas of rats exposed to 120 mg/kg iron (Tian et al., 2023). These conflicting results emphasize the critical role of dose and duration of administration in the establishment of lesions and deposits (Adham et al., 2015). Furthermore, we acknowledge that hematological parameters were not included in this study, and we plan to incorporate these analyses into future research. ConclusionIn summary, the current study showed that subchronic iron excess resulted in significant alterations in glycemia, redox status, and multiorgan injury. These findings have significant implications for improving the efficacy of iron intake in managing iron disorders and developing iron therapies. Iron supplementation should be used more carefully in relevant clinical applications. AcknowledgmentsThe authors would like to acknowledge the Deanship of Graduate Studies and Scientific Research, Taif University for funding this work. Dr. Thomas Gyedu-Ababio from the University of Port Elizabeth (Ghana) is also deserving of gratitude, whose assistance with the paper’s linguistic revision was greatly appreciated. Author’s contributionAteeqah Ghayth Alzwawy: experiments and preparation of the original draft. Ahmed Kouki: preparation of materials and animal experiments. Abdelhafidh Khazri, Manel Ben Ali, and Chayma Ben Fayala: study design and biochemical tests. Riadh Marrouchi, Haïfa Tounsi-Kettiti: Histological studies, critical revision, and validation. Ezzeddine Mahmoudi, Mohsen Sakly, and Mossadok Ben-Attia: Statistical analysis, coordination, and analysis of results. Conflict of interestsThe authors declare that they have no known competing financial interests or personal relationships that could have influenced the work reported in this paper. Data availabilityThe data supporting the findings of this study are available on request from the corresponding author. ReferencesAdel, R.M., Lotfy, R.A., Darwish, A.S. and Amer, A.S. 2021. Destructive effect of iron overload in brain tissue of albino rats: ameliorative role of silver immobilized organo-modified casein nanocomposite as co-treating agent with Deferasirox. J. Trace Elem. Med. Biol. 67, 126794. Adham, K.G., Farhood, M.H., Daghestani, M.H., Aleisa, N.A., Alkhalifa, A.A., El Amin, M.H., Virk, P., Al-Obeid, M.A. and Al-Humaidhi, E.M. 2015. Metabolic response to subacute and subchronic iron overload in rat model. Acta. Biol. Hung. 66(4), 361–373. Aebi, H. 1974. Catalase. In Methods of enzymatic analysis. Ed., Bergmeyer, H.U. Weinheim (Germany)/NY: Verlag Chemie/Academic Press Inc., (USA), pp: 673–680. Algharib, S.A. 2016. Antioxidant effect of selenium and its nanoform on oxidative stress induced by iron overload. BVMJ 31(1), 96–102. Atarashi, M., Izawa, T., Mori, M., Inai, Y., Kuwamura, M. and Yamate, J. 2018. Dietary iron overload abrogates chemically-induced liver cirrhosis in rats. Nutrients 10(10), 1400. Awai, M., Narasaki, M., Yamanoi, Y. and Seno, S. 1979. Induction of diabetes in animals by parenteral administration of ferric nitrilotriacetate. A model of experimental hemochromatosis. Am. J. Pathol. 95(3), 663–673. Badria, F.A., Ibrahim, A.S., Badria, A.F. and Elmarakby, A.A. 2015. Curcumin attenuates iron accumulation and oxidative stress in the liver and spleen of chronic iron-overloaded rats. PLos One. 10(7), e0134156. Bao, W., Rong, Y., Rong, S. and Liu, L. 2012. Dietary iron intake, body iron stores, and the risk of type 2 diabetes: a systematic review and meta-analysis. BMC Med. 10, 119. Bardestani, A., Ebrahimpour, S., Esmaeili, A. and Esmaeili, A. 2021. Quercetin attenuates neurotoxicity induced by iron oxide nanoparticles. J. Nanobiotech. 19, 327. Biasi, F., Leonarduzzi, G., Oteiza, P.I. and Poli, G. 2013. Inflammatory bowel disease: mechanisms, redox considerations, and therapeutic targets. Antioxid. Redox. Signal. 19(14), 1711–1747. Bozkurt, A., Budak, H., Erol, H.S., Can, S., Mercantepe, T., Akin, Y., Ozbey, I., Cankaya, M., Halici, M.B. and Coban, T.A. 2018. A novel therapeutic agent: antioxidant effects of hydroxylfasudil on rat kidney and liver tissues in a protamine sulphate-induced cystitis rat model; preliminary results. Artif. Cells. Nanomed. Biotechnol. 46(sup2), 9–14. Brissot, P., Pietrangelo, A., Adams, P.C., De Graaff, B., Mclaren, C.E. and Loréal, O. 2018. Haemochromatosis. Nat. Rev. Dis. Primers. 4, 18016; doi:10.1038/nrdp.2018.16 Brittenham, G.M., 2018. Disorders of iron homeostasis: iron deficiency and overload. Elsevier, 2018, 478–490. Buege, J.A. and Aust, S.D. 1978. Microsomal lipid peroxidation. Methods. Enzymol. 52, 302–310. Cai, L., Liao, H.F., Zhang, X.J., Shao, Y., Xu, M. and Yi, J.L. 2013. Acetylcholinesterase function in apoptotic retina pigment epithelial cells induced by H2O2. Int. J. Ophthalmol. 6(6), 772–777. Cavallo-Perin, P., Pacini, G., Cerutti, F., Bessone, A., Condo, C., Sacchetti, L., Piga, A. and Pagano, G. 1995. Insulin resistance and hyperinsulinemia in homozygous β-thalassemia. Metabolism 44, 281–286. Che, J., Yang, J., Zhao, B., Zhang, G., Wang, L., Peng, S. and Shang, P., 2020. The effect of abnormal iron metabolism on osteoporosis. Biol Trace Elem Res. 195(2), 353–365. Chen, Y., Guo, X., Zeng, Y., Mo, X., Hong, S., He, H., Li, J., Fatima, S. and Liu, Q. 2023. Oxidative stress induces mitochondrial iron overload and ferroptosis cell death. Scientific. Rep. 13, 1515. Cook, J.D., Flowers, C.H. and Skikne, B.S. 2003. The quantitative assessment of body iron. Blood 101(9), 3359–3364; doi:10.1182/blood-2002-10-3071 Cortese, S., Moreira-Maia, C.R., St Fleur, D., Morcillo-Peñalver, C., Rohde, L.A. and Faraone, S.V. 2016. Association between ADHD and obesity: a systematic review and meta-analysis. Am. J. Psychiatry 173(1), 34–43. Day, C.E. 2014. Histopathology: Methods and Protocols. New York, NY: Humana Press, p: 416. Derry, P.J. 2020. Revisiting the intersection of amyloid, pathologically modified tau and iron in Alzheimer’s disease from a ferroptosis perspective. Progress Neurobiol. 184, 101716. Desmots, F., Rissel, M., Pigeon, C., Loyer, P., Loréal, O. and Guillouzo, A. 2002. Differential effects of iron overload on GST isoform expression in mouse liver and kidney and correlation between GSTA4 induction and overproduction of free radicals. Free Radic. Biol. Med. 32(1), 93–101. Dev, S. and Babitt, J.L. 2017. Overview of iron metabolism in health and disease. Hemodial. Int. 21(6), 6–20. Dominguez, J.H., Liu, Y. and Kelly, K.J. 2015. Renal iron overload in rats with diabetic nephropathy. Physiol. Rep. 3 (12), 12654. Duarte, T.L., Caldas, C., Santos, A.G., Silva-Gomes, S., Santos-Gonçalves, A., Martins, M.J., Porto, G. and Lopes, J.M., 2017. Redox Biol. 11, 157–169. Dusek, G., Sweet, W.V., Widlansky, M.J., Thompson, P.R. and Marra, J.J., 2022. A novel statistical approach to predict seasonal high tide flooding. Front. Mar. Sci. 9, 1073792; doi: 10.3389/fmars.2022.1073792 Dumont, Y., Larose, L., Poirier, G.G. and Morisset, J. 1984. Changes in Acetylcholinesterase and Cholinesterase Activities in Rat Pancreas during Postnatal Development: lack of Relation with Muscarinic Receptor Maturation. Pharmacology 29(1), 40–46. Ellman, G.L., Courtney, K.D., Andres, V. and Featherstone, R.M. 1961. A new and rapid colorimetric determination of acetylcholinesterase activity. Biochem. Pharmacol. 7(7), 88–95. Ellman. 1959. Tissue sulfhydryl groups. Arch. Biochem. Biophys. 82(1), 70–77. Feng, Z., Min, L., Chen, H., Deng, W., Tan, M., Liu, H. and Hou, J. 2021. Iron overload in the motor cortex induces neuronal ferroptosis following spinal cord injury. Redox Biol. 43, 101984. Fernández-Real, J.M. and Manco, M. 2014. Effects of iron overload on chronic metabolic diseases. Lancet Diabetes Endocrinol. 2(6), 513–526; doi: 10.1016/S2213-8587(13)70174-8 Fleischhacker, A.S. and Kiley, P.J. 2011. Iron-containing transcription factors and their roles as sensors. Curr. Opin. Chem. Biol. 15(2), 335–341. Fleming, R.E. and Ponka, P. 2012. Iron overload in human disease. N. Engl. J. Med. 366(4), 348–359. Forciniti, S., Greco, L., Grizzi, F., Malesci, A. and Laghi, L. 2020. Iron Metabolism in Cancer Progression. Int. J. Mol. Sci. 21(6), 2257. Franco, R., Panayiotidis, M.I. and Cidlowski, J.A. 2007. Glutathione depletion is necessary for apoptosis in lymphoid cells independent of reactive oxygen species formation. J. Biol. Chem. 282(42), 30452–30465. Frijhoff, J., Winyard, P.G., Zarkovic, N., Davies, S.S., Stocker, R., Cheng, D., Knight, A.R., Taylor, E.L., Oettrich, J., Ruskovska, T. and Gasparovic, A.C. 2015. Antioxid Redox Signal. Antioxid. Redox Signal. 23(14), 1144–1170. Fuhrman, B., Partoush, A. and Aviram, M. 2004. Acetylcholine esterase protects LDL against oxidation. Biochem. Biophys. Res. Commun. 322(3), 974–978. Galaris, D., Barbouti, A. and Pantopoulos, K. 2019. Iron homeostasis and oxidative stress: an intimate relationship. Biochim. Biophys. Acta. Mol. Cell. Res. 1866(12), 118535. Gandhi, S. and Abramov, A.Y. 2012. Mechanism of oxidative stress in neurodegeneration. Oxid. Med. Cell. Longev. 2012(1), 428010. Ganz, T. and Nemeth, E. 2015. Iron homeostasis in host defense and inflammation. Nat. Rev. Immunol. 15(8), 500–510. Gao, W., Li, X., Gao, Z. and Li, H. 2014. Iron increases diabetes-induced kidney injury and oxidative stress in rats. Biol. Trace Elem. Res. 60, 368–375. Geng, W., Pan, L., Shen, L., Sha, Y., Sun, J., Yu, S., Qiu, J. and Xing, W. 2022. Evaluating renal iron overload in diabetes mellitus by blood oxygen level-dependent magnetic resonance imaging: a longitudinal experimental study. BMC Med. Imag. 22(1), 200. Grubič, Z., Zajc-Kreft, K., Brank, M., Marš, T., Komel, R. and Miranda, A.F. 1999. Control levels of acetylcholinesterase expression in the mammalian skeletal muscle. Chem. Biol. Inter. 14, 119–120. Habig, W.H., Pabst, M.J. and Jakoby, W.B. 1974. Glutathione S-transferases: the first enzymatic step in mercapturic acid formation. J. Biol. Chem. 249(22), 7130–7139. Harrison, A.V., Lorenzo, F.R. and Mcclain, D.A. 2023. Iron and the pathophysiology of diabetes. Annu. Rev. Physiol. 85, 339–362. Hayes, J.D. and Pulford, D.J. 1995. The glutathione S-transferase supergene family: regulation of GST and the contribution of the isoenzymes to cancer chemoprotection and drug resistance part II. Crit. Rev. Biochem. Mol. Biol. 30(6), 445–600. Ho, E., Karimi Galougahi, K., Liu, C.C., Bhindi, R. and Figtree, G.A. 2013. Biological markers of oxidative stress: applications to cardiovascular research and practice. Redox Biol. 1(1), 483–491. Iftikhar, H., Israr, B., Butt, M.S. and Pasha, I. 2024. The Impact of Iron and Zinc Fortified Snacks on Cognitive Performance in Pre-Adolescents. J. Agri. Sci. 61, 1066–1074. Ige, A.O., Ongele, F.A., Adele, B.O., Emediong, I.E., Odetola, A.O. and Adewoye, E.O. 2019. Pathophysiology of iron overload-induced renal injury and dysfunction: roles of renal oxidative stress and systemic inflammatory mediators. Pathophysiology 26(2), 175–180. Imai, T., Iwata, S., Hirayama, T., Nagasawa, H., Nakamura, S., Shimazawa, M. and Hara, H. 2019. Intracellular Fe2+ accumulation in endothelial cells and pericytes induces blood-brain barrier dysfunction in secondary brain injury after brain hemorrhage. Sci. Rep. 9(1), 6228. Ishak, K., Baptista, A., Bianchi, L., Callea, F., De Groote, J., Gudat, F., Denk, H., Desmet, V., Korb, G., MacSween, R.N.M., Phillips, M.J., Portmann, B.G., Poulsen, H., Scheuer, P.J., Schmid, M. and Thaler, H. 1995. Histological grading and staging of chronic hepatitis. J. Hepatol. 22(6), 696–669; doi:10.1016/0168-8278(95)80226-6 Kaur, D., Rajagopalan, S. and Andersen, J.K. 2009. Chronic expression of H-ferritin in dopaminergic midbrain neurons results in an age-related expansion of the labile iron pool and subsequent neurodegeneration: implications for Parkinson's disease. Brain Res. 1297, 17–22. Kawabata, T. 2022. Iron-induced oxidative stress in human diseases. Cells 11(14), 2152. Kell, D.B. 2009. Iron behaving badly: inappropriate iron chelation as a major contributor to the aetiology of vascular and other progressive inflammatory and degenerative diseases. BMC Med. Genomics 2, 2; doi: 10.1186/1755-8794-2-2 Khan, M.F., Srivastava, S.K., Singhal, S.S., Chaubey, M., Awasthi, S., Petersen, D.R., Ansari, G.A.S. and Awasthi, Y.C. 1995. Iron-Induced Lipid-Peroxidation in Rat Liver Is Accompanied by Preferential Induction of Glutathione S-Transferase 8-8 Isozyme. Toxicol. Appl. Pharmacol. 131(1), 63–72. Kocpinar, E.F., Gonul Baltaci, N., Ceylan, H., Kalin, S.N., Erdogan, O. and Budak, H. 2020. Effect of a prolonged dietary iron intake on the gene expression and activity of the testicular antioxidant defense system in rats. Biol. Trace Elem. Res. 195(1), 135–141. Kocyigit, U.M., Taşkıran, A., Taslimi, P., Yokuş, A., Temel, Y. and Gulçin, I. 2017. Inhibitory effects of oxytocin and oxytocin receptor antagonist atosiban on the activities of carbonic anhydrase and acetylcholinesterase enzymes in the liver and kidney tissues of rats. J. Biocha. MolToxicol. 31(11), e21972. Kurtoglu, E., Ugur, A., Baltaci, A.K. and Undar, L. 2003. Effect of iron supplementation on oxidative stress and antioxidant status in iron-deficiency anemia. Biol. Trace. Elem. Res. 96(1-3), 117–123. Lash, A. and Saleem, A. 1995. Iron metabolism and its regulation. A review. Ann. Clin. Lab. Sci. 25(1), 20–30. Liang, M., Chen, L., He, Q., Mi, X., Qu, L., Xie, J. and Song, N. 2023. Intraperitoneal injection of iron dextran induces peripheral iron overload and mild neurodegeneration in the nigrostriatal system in C57BL/6 mice. Life. Sci. 320, 121508. Lionetto, M.G., Caricato, R., Calisi, A., Giordano, M.E. and Schettino, T. 2013. Acetylcholinesterase as a biomarker in environmental and occupational medicine: new insights and future perspectives. Biomed. Res. Int. 2013, 321213. Liu, C.Y., Wang, M., Yu, H.M., Han, F.X., Wu, Q.S., Cai, X.J., Kurihara, H., Chen, Y.X., Li, Y.F. and He, R.R. 2020. Ferroptosis is involved in alcohol-induced cell death in vivo and in vitro. Biosci. Biotechnol. Biochem. 84(8), 1621–1628. Liu, P.T., Kentish, P.A., Symons, A.M. and Parke, D.V. 1993. The effects of ether anaesthesia on oxidative stress in rats-dose response. Toxicology 80(1), 37–49. Liu, Y., Li, G., Lu, F., Guo, Z., Cai, S. and Huo, T. 2023. Excess iron intake induced liver injury: the role of gut-liver axis and therapeutic potential. Biomed. Pharmacother. 168, 115728. Lours, C., Cottin, L., Wiber, M., Andrieu, V., Baccini, V., Baseggio, L., Brouzes, C., Chatelain, B., Daliphard, S., Fenneteau, O., Geneviève, F., Girard, S., Leymarie, V., Maloum, K., Rieu, J.B., Sebahoun, G., Sudaka, I., Troussard, X., Wagner-Ballon, O., Wuilleme, S., Bardet, V. and Lesesve, J.F. 2022. Perls’ stain guidelines from the French-speaking cellular hematology group (GFHC). Diagnostics 12(7), 1698. Lu, Q., Harris, V.A., Rafikov, R., Sun, X., Kumar, S. and Black, S.M. 2015. Nitric oxide induces hypoxia ischemic injury in the neonatal brain via the disruption of neuronal iron metabolism. Redox Biol. 6, 112–121. Lunova, M., Schwarz, P., Nuraldeen, R., Levada, K., Kuscuoglu, D., Stützle, M., Vujić Spasić, M., Haybaeck, J., Ruchala, P., Jirsa, M. and Deschemin, J.C., 2017. J Pathol. 241(1), 104–114. Ma, W., Feng, Y., Jia, L., Li, S., Li, J., Wang, Z., Chen, X. and Du, H. 2019. Dietary iron modulates glucose and lipid homeostasis in diabetic mice. Biol. Trace Elem. Res. 189(1), 194–200. Marfil-Rivera, L.J. 2015. Iron overload. Med. Univer. 17(69), 240–242. Martins, A.M., Gomes, A.L., Boas, I.V., Marto, J., Ribeiro, H.M., 2022. Correction: Cannabis-based products for the treatment of skin inflammatory diseases: a timely review. Pharmaceutics 15(7), 849; doi: 10.3390/ph15070849 Marí, M., Morales, A., Colell, A., García-Ruiz, C., Kaplowitz, N. and Fernández-Checa, J.C. 2013. Mitochondrial glutathione: features, regulation and role in disease. Biochem. Biophys. Acta. 1830(5), 3317–3328. Miao, R., Fang, X., Zhang, Y., Wei, J., Zhang, Y. and Tian, J. 2023. Iron metabolism and ferroptosis in type 2 diabetes mellitus and complications: mechanisms and therapeutic opportunities. Cell Death Dis. 14(3), 186. Mirhoseini Moosavi, P., Astaraei, A.R., Karimi, A., Moshiri, M., Etemad, L., Zeinali, M. and Karimi, G. 2015. Efficacy of orally administered montmorillonite for acute iron poisoning detoxification in rat. Appl. Clay. Sci. 103, 62–66. Nairz, M. and Weiss, G. 2020. Iron in infection and immunity. Mol. Aspects. Med. 75, 100864. Nassar, A.Y., Meligy, F.Y., Abd-Allah, G.M., Khallil, W.A., Sayed, G.A., Hanna, R.T., Nassar, G.A. and Bakkar, S.M. 2023. Oral acetylated whey peptides (AWP) as a potent antioxidant, anti-inflammatory, and chelating agent in iron-overloaded rats' spleen. J. Funct. Foods. 102, 105444. Nguyen, D.X., Bos, P.D. and Massagué, J., 2009. Metastasis: from dissemination to organ-specific colonization. Nat. Rev. Cancer 9(4), 274–284 ; doi: 10.1038/nrc2622 Ni, S., Yuan, Y., Kuang, Y. and Li, X. 2022. Iron metabolism and immune regulation. Front. Immunol. 13, 816282. Niemelä, O., Parkkila, S., Britton, R.S., Brunt, E., Janney, C. and Bacon, B. 1999. Hepatic lipid peroxidation in hereditary hemochromatosis and alcoholic liver injury. J. Lab. Clin. Med. 133(5), 451–460. Nieto-Cerón, S. 2004. Molecular properties of acetylcholinesterase in mouse spleen. Neurochem. Int. 45(1), 129–139. Ohkawa, H., Ohishi, N. and Yagi, K. 1979. Assay for lipid peroxides in animal tissues by the thiobarbituric acid reaction. Anal. Biochem. 95(2), 351–358. Olivieri, N.F. 1999. The β-thalassemias. N. Engl. J. Med. 341, 341–399. Orbea, A., Ortiz-Zarragoitia, M., Solé, M., Porte, C. and Cajaraville, M.P. 2002. Antioxidant enzymes and peroxisome proliferation in relation to contaminant body burdens of PAHs and PCBs in bivalve molluscs, crabs and fish from the Urdaibai and Plentzia estuaries (Bay of Biscay). Aquat. Toxicol. 58(1-2), 75–98. Park, J.H., Lee, B.M. and Kim, H.S. 2021. Potential protective roles of curcumin against cadmium-induced toxicity and oxidative stress. J. Toxicol. Environ. Health. B. Crit. Rev. 24(3), 95–118. Pavlakou, P., Liakopoulos, V., Eleftheriadis, T., Mitsis, M. and Dounousi, E. 2017. Oxidative stress and acute kidney injury in critical illness: pathophysiologic mechanisms—biomarkers—interventions, and future perspectives. Oxid. Med. Cell. Longev. 1(1), 6193694. Pelucchi, S., Ravasi, G. and Piperno, A. 2021. Ceruloplasmin variants might have different effects in different iron overload disorders. J. Hepatol. 75(4), 1003–1004. Petrillo, S., Manco, M., Altruda, F., Fagoonee, S. and Tolosano, E. 2021. Liver Sinusoidal Endothelial Cells at the Crossroad of Iron Overload and Liver Fibrosis. Antioxid. Redox Signal. 35(6), 474–486. Pi, J. and Collins, S. 2010. Reactive oxygen species and uncoupling protein 2 in pancreatic β-cell function. Diabetes Obes. Metab. 12(2), 141–148. Pohanka, M. 2014. Copper, aluminum, iron, and calcium inhibit human acetylcholinesterase in vitro. Environ. Toxicol. Pharmacol. 37(1), 455–459. Puig, S., Ramos-Alonso, L., Romero, A.M. and Martínez-Pastor, M.T. 2017. Metallomics. Metallomics 9(11), 1483–1500. Punchai, S., Chaiyagot, N., Artkaew, N., Jusakul, A., Cha’On, U., Thanan, R., Vaeteewoottacharn, K. and Lert-Itthiporn, W. 2024. Iron-induced kidney cell damage: insights into molecular mechanisms and potential diagnostic significance of urinary FTL. Front. Mol. Biosci. 11, 1352032. Ru, Q., Li, Y., Chen, L., Wu, Y., Min, J. and Wang, F. 2024. Iron homeostasis and ferroptosis in human diseases: mechanisms and therapeutic prospects. Sig. Transduct. Target. Ther. 9(1), 271. Salvador, G.A., Uranga, R.M. and Giusto, N.M. 2011. Iron and mechanisms of neurotoxicity. Int. J. Alzheimer Dis. 1(1), 1–9. Sarkar, J., Potdar, A.A. and Saidel, G.M. 2018. Whole-body iron transport and metabolism: mechanistic, multi-scale model to improve treatment of anemia in chronic kidney disease. PLos Comput. Biol. 14(4), e1006060. Schallreuter, K.U., Elwary, S.M.A., Gibbons, N.C.J., Rokos, H. and Wood, J.M. 2004. Activation/deactivation of acetylcholinesterase by H2O2: more evidence for oxidative stress in vitiligo. Biochem. Biophys. Res. Commun. 315(2), 502–508. Scherz-Shouval, R. and Elazar, Z. 2011. Regulation of autophagy by ROS: physiology and pathology. Trends. Biochem. Sci. 36(1), 30–38. Shivarajashankara, Y.M., Shivashankara, A.R., Bhat, P.G. and Rao, S.H. 2003. Lipid peroxidation and antioxidant systems in the blood of young rats subjected to chronic fluoride toxicity. Indian J. Exp. Biol. 41(8), 857–860. Siddique, A. and Kowdley, K.V. 2012. The iron overload syndromes. Aliment. Pharmacol. Ther. 35(8), 876–893. Simcox, J.A. and Mcclain, D.A. 2013. Iron and diabetes risk. Cell. Metab. 17(3), 329–341. Sinenko, S.A., Starkova, T.Y., Kuzmin, A.A. and Tomilin, A.N. 2021. Physiological signaling functions of reactive oxygen species in stem cells: from flies to man. Front. Cell Dev. Biol. 9, 714370. Singhal, S.S., Godley, B.F., Chandra, A., Pandya, U., Jin, G.F., Saini, M.K., Awasthi, S. and Awasthi, Y.C. 1999. Induction of glutathione S-transferase hGST 5.8 is an early response to oxidative stress in RPE cells. Invest. Ophthalmol. Vis. Sci. 40(11), 2652–2659. Sripetchwandee, J., Pipatpiboon, N., Chattipakorn, N. and Chattipakorn, S. 2014. Combined therapy of iron chelator and antioxidant completely restores brain dysfunction induced by iron toxicity. PLos One 9(1), e85115. Takano, S., Aramaki, Y. and Tsuchiya, S. 2003. Physicochemical properties of liposomes affecting apoptosis induced by cationic liposomes in macrophages. Pharm. Res. 20(7), 962–968. Tian, C., Zhao, J., Xiong, Q., Yu, H. and Du, H. 2023. Secondary iron overload induces chronic pancreatitis and ferroptosis of acinar cells in mice. Int. J. Mol. Med. 51(1), 9. Tjalkens, R.B., Valerio, L.G., Awasthi, Y.C. and Petersen,, D.R. 1998. Association of glutathioneS-transferase isozyme-specific induction and lipid peroxidation in two inbred strains of mice subjected to chronic dietary iron overload. Toxicol. Appl. Pharmacol. 151(1), 174–181. Wang, C., Zheng, L., Liu, S., Guo, X., Qu, Y., Gao, M., Cui, X. and Yang, Y. 2020. A novel acidic polysaccharide from the residue of Panax notoginseng and its hepatoprotective effect on alcoholic liver damage in mice. Int. J. Biol. Macromol. 149, 1084–1097. Wang, C.Y. and Babitt, J.L. 2019. Liver iron sensing and body iron homeostasis. Blood 133(1), 18–29. Xie, T., Yao, L. and Li, X. 2024. Advance in iron metabolism oxidative stress and cellular dysfunction in experimental and human kidney diseases. Antioxidants 13, 659. Xing, G., Meng, L., Cao, S., Liu, S., Wu, J., Li, Q., Huang, W. and Zhang, L. 2022. PPARα alleviates iron overload‐induced ferroptosis in mouse liver. EMBO. Rep. 23, e52280. Xu, H., Jiang, H. and Xie, J. 2017. New insights into the crosstalk between NMDARs and iron: implications for understanding pathology of neurological diseases. Front. Mol. Neurosci. 10(10), 71. Yu, Y., Yan, Y., Niu, F., Wang, Y., Chen, X., Su, G., Liu, Y., Zhao, X., Qian, L., Liu, P. and Xiong, Y. 2021. Ferroptosis: a cell death connecting oxidative stress, inflammation and cardiovascular diseases. Cell. Death. Discovery. 7, 193. Zhang, Y. and Xie, J. 2024. Ferroptosis implication in environmental-induced neurotoxicity. Sci. Total. Environ. 15, 934. Zhang, Y., Tian, X., Jiao, Y., Wang, Y., Dong, J., Yang, N., Yang, Q., Qu, W. and Wang, W. 2022. Free iron rather than heme iron mainly induces oxidation of lipids and proteins in meat cooking. Food. Chem. 382, 132345. Zoller, H., McFarlane, I., Theurl, I., Stadlmann, S., Nemeth, E., Oxley, D., Ganz, T., Halsall, D.J., Cox, T.M. and Vogel, W., 2005. Hepatology. 42(2), 466–472. | ||
| How to Cite this Article |
| Pubmed Style Alzwawy AG, Khazri A, Kouki A, Ali MB, Fayala CB, Ben-attia M, Mahmoudi E, Sakly M, Marrouchi R, Tounsi-kettiti H. Subchronic comparative assessment of graded ferrous sulfate doses on biochemical, histological, and multiorgan micromorphological changes in wistar rats. Open Vet. J.. 2026; 16(3): 1893-1912. doi:10.5455/OVJ.2026.v16.i3.45 Web Style Alzwawy AG, Khazri A, Kouki A, Ali MB, Fayala CB, Ben-attia M, Mahmoudi E, Sakly M, Marrouchi R, Tounsi-kettiti H. Subchronic comparative assessment of graded ferrous sulfate doses on biochemical, histological, and multiorgan micromorphological changes in wistar rats. https://www.openveterinaryjournal.com/?mno=274309 [Access: June 22, 2026]. doi:10.5455/OVJ.2026.v16.i3.45 AMA (American Medical Association) Style Alzwawy AG, Khazri A, Kouki A, Ali MB, Fayala CB, Ben-attia M, Mahmoudi E, Sakly M, Marrouchi R, Tounsi-kettiti H. Subchronic comparative assessment of graded ferrous sulfate doses on biochemical, histological, and multiorgan micromorphological changes in wistar rats. Open Vet. J.. 2026; 16(3): 1893-1912. doi:10.5455/OVJ.2026.v16.i3.45 Vancouver/ICMJE Style Alzwawy AG, Khazri A, Kouki A, Ali MB, Fayala CB, Ben-attia M, Mahmoudi E, Sakly M, Marrouchi R, Tounsi-kettiti H. Subchronic comparative assessment of graded ferrous sulfate doses on biochemical, histological, and multiorgan micromorphological changes in wistar rats. Open Vet. J.. (2026), [cited June 22, 2026]; 16(3): 1893-1912. doi:10.5455/OVJ.2026.v16.i3.45 Harvard Style Alzwawy, A. G., Khazri, . A., Kouki, . A., Ali, . M. B., Fayala, . C. B., Ben-attia, . M., Mahmoudi, . E., Sakly, . M., Marrouchi, . R. & Tounsi-kettiti, . H. (2026) Subchronic comparative assessment of graded ferrous sulfate doses on biochemical, histological, and multiorgan micromorphological changes in wistar rats. Open Vet. J., 16 (3), 1893-1912. doi:10.5455/OVJ.2026.v16.i3.45 Turabian Style Alzwawy, Ateeqah Ghayth, Abdelhafidh Khazri, Ahmed Kouki, Manel Ben Ali, Chayma Ben Fayala, Mossadok Ben-attia, Ezzeddine Mahmoudi, Mohsen Sakly, Riadh Marrouchi, and Haïfa Tounsi-kettiti. 2026. Subchronic comparative assessment of graded ferrous sulfate doses on biochemical, histological, and multiorgan micromorphological changes in wistar rats. Open Veterinary Journal, 16 (3), 1893-1912. doi:10.5455/OVJ.2026.v16.i3.45 Chicago Style Alzwawy, Ateeqah Ghayth, Abdelhafidh Khazri, Ahmed Kouki, Manel Ben Ali, Chayma Ben Fayala, Mossadok Ben-attia, Ezzeddine Mahmoudi, Mohsen Sakly, Riadh Marrouchi, and Haïfa Tounsi-kettiti. "Subchronic comparative assessment of graded ferrous sulfate doses on biochemical, histological, and multiorgan micromorphological changes in wistar rats." Open Veterinary Journal 16 (2026), 1893-1912. doi:10.5455/OVJ.2026.v16.i3.45 MLA (The Modern Language Association) Style Alzwawy, Ateeqah Ghayth, Abdelhafidh Khazri, Ahmed Kouki, Manel Ben Ali, Chayma Ben Fayala, Mossadok Ben-attia, Ezzeddine Mahmoudi, Mohsen Sakly, Riadh Marrouchi, and Haïfa Tounsi-kettiti. "Subchronic comparative assessment of graded ferrous sulfate doses on biochemical, histological, and multiorgan micromorphological changes in wistar rats." Open Veterinary Journal 16.3 (2026), 1893-1912. Print. doi:10.5455/OVJ.2026.v16.i3.45 APA (American Psychological Association) Style Alzwawy, A. G., Khazri, . A., Kouki, . A., Ali, . M. B., Fayala, . C. B., Ben-attia, . M., Mahmoudi, . E., Sakly, . M., Marrouchi, . R. & Tounsi-kettiti, . H. (2026) Subchronic comparative assessment of graded ferrous sulfate doses on biochemical, histological, and multiorgan micromorphological changes in wistar rats. Open Veterinary Journal, 16 (3), 1893-1912. doi:10.5455/OVJ.2026.v16.i3.45 |

