


| Research Article | ||
Open Vet. J.. 2025; 15(9): 4716-4725 Open Veterinary Journal, (2025), Vol. 15(9): 4716-4725 Research Article Agreement between a point-of-care analyzer and a reference laboratory analyzer for plasma phenobarbital quantification in dogs and catsGrégoire Scherf1* and Nicolas Van Caenegem21Neurology Department, CHV AniCura Nordvet, La Madeleine, France 2Neurology Department, Referral Center AniCura TRIOVet, Rennes, France *Corresponding Author: Grégoire Scherf. Neurology Department, CHV AniCura Nordvet, La Madeleine, France. Email: gregoire.scherf [at] anicura.fr Submitted: 07/05/2025 Revised: 23/07/2025 Accepted: 13/08/2025 Published: 30/09/2025 © 2025 Open Veterinary Journal
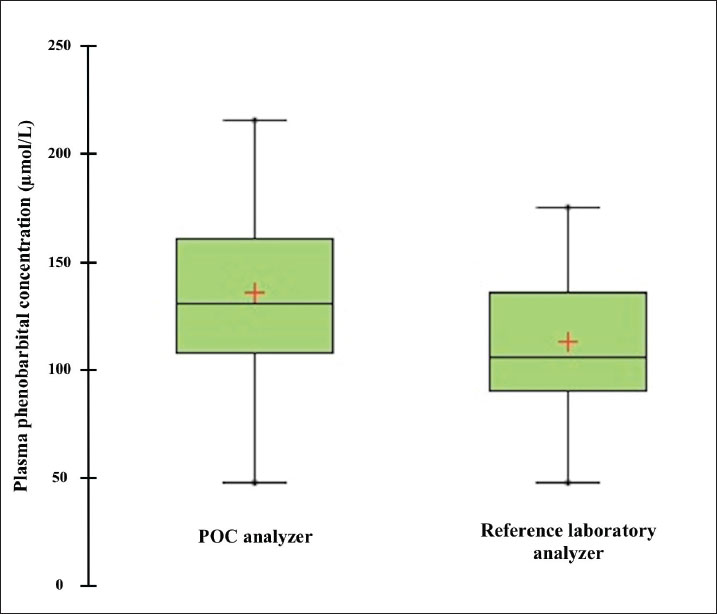
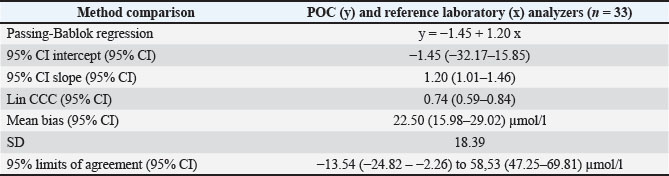
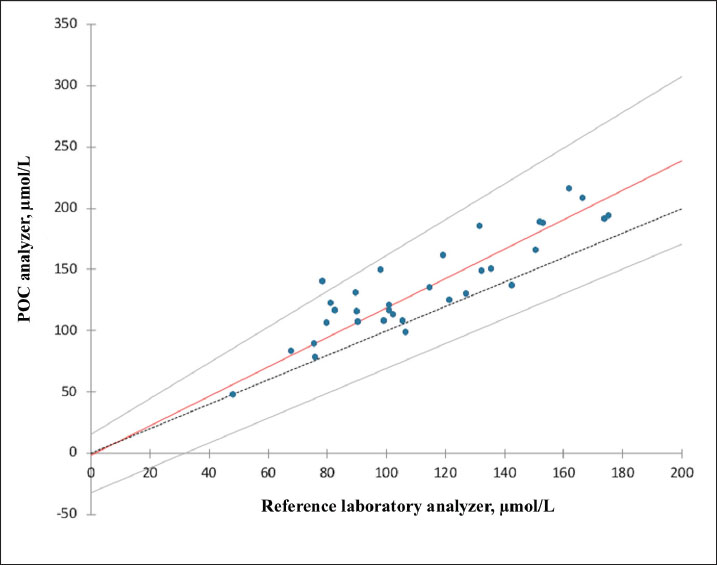
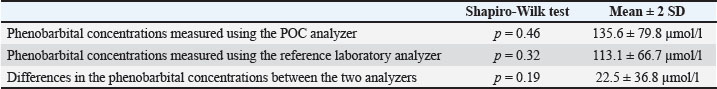
AbstractBackground: Accurate measurement of plasma phenobarbital concentration is essential to optimize seizure control while minimizing the risk of toxicity. Although both on-site point-of-care (POC) and off-site reference laboratory analyzers are commonly used in clinical practice, notable discrepancies between their results have been observed. Aim: The primary objective was to assess the agreement between an on-site POC analyzer (Catalyst One, IDEXX Laboratories) and an off-site reference laboratory analyzer (Cobas 6000 c501, Roche Diagnostics) for quantifying plasma phenobarbital concentrations in dogs and cats. A secondary objective was to investigate whether clinical or biological variables were associated with measurement discrepancies between the two analyzers. Methods: This dual-institutional retrospective study included dogs and cats with plasma phenobarbital concentrations measured concomitantly from the same blood sample, both on-site using a POC analyzer and off-site using a reference laboratory analyzer. Data were collected between September 2023 and December 2024. Agreement between analyzers was assessed using Passing–Bablok regression, Lin’s concordance correlation coefficient (CCC), and Bland–Altman analysis. Associations between clinical or biological variables and measurement discrepancies were evaluated using Spearman’s rank correlation and Student’s t-tests. Results: Thirty-three paired phenobarbital concentrations were measured using both analyzers. Passing–Bablok regression and Lin’s CCC showed that the two analyzers were not equivalent (systematic proportional bias) and demonstrated poor agreement (CCC=0.74). Bland–Altman analysis revealed a mean positive bias of +22.50 µmol/l (p < 0.0001) between the POC and reference laboratory analyzers, with limits of agreement ranging from −13.5 to +58.5 µmol/l. Discrepancies in medical interpretation occurred in 30.3% of cases when using manufacturer-specific thresholds. No significant association was found between measurement differences and any assessed clinical or biological variable. Conclusion: This study suggests that caution should be exercised when using both analyzers interchangeably in clinical practice. In most cases from this study’s population, the POC analyzer yielded higher phenobarbital concentrations. Clinicians should consider these discrepancies and interpret phenobarbital levels with caution, especially when switching analyzers during therapeutic drug monitoring. Further research is warranted to explore the causes of these differences and assess their clinical relevance in a broader population. Keywords: Method comparison, Phenobarbital, Point-of-care testing, Therapeutic drug monitoring, Veterinary neurology. IntroductionPhenobarbital has the longest history of chronic use among antiepileptic drugs in veterinary medicine (Podell et al., 2016). It is widely employed as a first-line treatment for epilepsy in dogs and cats due to its favorable pharmacokinetic profile, cost-effectiveness, and well-documented efficacy (Charalambous et al., 2014; Bhatti et al., 2015; Podell et al., 2016; Charalambous et al., 2018). In most cases, plasma phenobarbital concentration correlates with both therapeutic efficacy and risk of toxicity (Boothe 2011; Thungrat et al., 2025). However, phenobarbital pharmacokinetics exhibit substantial inter- and intra-individual variability, making it difficult to predict plasma levels based solely on the administered dose (Abramson 1988; Bhatti et al., 2015). Given the potential for serious clinical consequences associated with subtherapeutic or potentially toxic concentrations, routine measurement of plasma levels using accurate and reliable analytical methods is a critical component of therapeutic drug monitoring (TDM) (Thungrat et al., 2025). In a clinical setting, point-of-care (POC) and reference laboratory assays are commonly used for phenobarbital TDM. Point-of-care analyzers provide rapid, bedside results, offering clinicians immediate insights for treatment adjustments. However, these devices may be subject to calibration inconsistencies and variable analytical precision (Shaw, 2015; Chutipongtanate et al., 2020; Thungrat et al., 2025). In contrast, reference laboratory assays are highly standardized and validated but introduce delays and logistical challenges due to sample transport (Thungrat et al., 2025). The longer turnaround time compared with the POC analyzer may be problematic in patients with poor seizure control or when toxicity is suspected. A recent study conducted in a laboratory setting independently compared two automated analyzers—a POC analyzer and a Food and Drug Administration (FDA)-approved immunoassay analyzer—with high-performance liquid chromatography (HPLC), which is considered the gold standard for quantifying plasma phenobarbital concentrations (Thungrat et al., 2025). Their results showed that both automated analyzers agreed with the HPLC method, with results from the FDA-approved immunoassay analyzer being slightly better correlated than those from the POC analyzer [Lin concordance correlation coefficient (CCC) 0.96 and 0.94, respectively]. All plasma samples (n=45) were taken from the archived canine samples submitted to the laboratory and passed pre-analytical hemolysis, icterus, and lipemia interference examination by an integrated clinical chemistry system. For the POC analyzer, the manufacturer’s technician performed pre-analytical quality control (QC) test and routine instrument maintenance. Plasma phenobarbital concentrations were measured simultaneously by all three assays within a 2-week timeframe, with each assay performed by a trained laboratory technician. However, in the authors’ clinical experience, notable discrepancies have been observed between POC and reference laboratory phenobarbital measurements. In some cases, these differences could have affected therapeutic decisions, particularly as each analyzer applies slightly different therapeutic reference ranges and toxicity thresholds. The primary objective of this retrospective study was to document these clinically observed discrepancies and to assess the agreement between an on-site automated POC analyzer (Catalyst One, IDEXX Laboratories) and an off-site automated analyzer (Cobas 6000 c501, Roche Diagnostics) for the quantification of plasma phenobarbital concentrations. A secondary objective was to evaluate the effect of various clinical and biological variables on the difference in plasma phenobarbital concentrations measured by both analyzers. Materials and MethodsThis was a dual-institutional retrospective study. Medical records from AniCura Nordvet and AniCura TRIOVet were reviewed to identify cases that met the following a priori inclusion criteria: 1. Dog or cat with plasma phenobarbital concentrations measured concomitantly on the same blood sample, both on-site at one of the two institutions (same type of POC analyzer, Catalyst One, IDEXX Laboratories) and off-site at a single reference laboratory (same reference laboratory analyzer for both institutions, Cobas 6000 c501, Roche Diagnostics). 2. Paired phenobarbital measurements obtained as part of routine phenobarbital TDM between September 2023 and December 2024. One patient could be included several times if paired samples were obtained on different visit days. 3. Point-of-care assays performed according to the manufacturer’s instructions at each institution. 4. Plasma samples processed, stored, and sent to the reference laboratory according to the laboratory’s instructions. As this was a retrospective study, all phenobarbital measurements were performed in a blinded manner during the study period, as part of routine clinical practice (POC) or standard reference laboratory analysis. AnimalsClinical data were reviewed and included species, breed, sex, age, weight, diagnosis related to epileptic seizures, comorbidities, daily phenobarbital dosage, and any other medication the patient was receiving at the time of sampling. Plasma alkaline phosphatase (ALP) and alanine aminotransferase (ALT) values were recorded on the day of plasma phenobarbital measurements or within a 2-week window before or after the measurements. The dates of sample collection and reference laboratory analysis were carefully recorded, along with whether phenobarbital measurement on the POC analyzer was performed independently or concurrently with other biochemical parameters. Point-of-care assayThe POC assay (competitive binding immunoassay) was conducted on-site at each participating institution within 20 minutes of sample collection, using a Catalyst One analyzer and a commercial proprietary phenobarbital reagent kit (which includes a phenobarbital-peroxidase conjugate, specific antibodies, and chromogenic substrates, IDEXX Laboratories), following the manufacturer’s instructions (Idexx Laboratories, 2024). Maintenance and QC procedures are performed at each institution as described in the manufacturer’s operator’s guide (Idexx Laboratories, 2024). Quality control procedures are performed every 1–3 months. Care is taken at each institution to avoid analyzing visibly icteric, lipemic, or hemolyzed samples. The therapeutic index recommended by the POC analyzer is between 64.7 and 193.9 µmol/l. Concentrations below 64.7 µmol/l are considered subtherapeutic. Concentrations between 86.2 and 129.3 µmol/l are considered ideal. Concentrations above 129.3 µmol/l are considered potentially toxic. Reference laboratory assayThe reference laboratory assay was conducted off-site (Antech Laboratories). A minimum of 200 µl of lithium heparinized plasma was prepared, refrigerated within 30 minutes of sample collection, and shipped under refrigerated conditions to the reference laboratory within 24 hours. As with the POC assay, visibly icteric, lipemic, or hemolyzed samples are not submitted to each institution. Phenobarbital quantification was performed using an automated immunoassay analyzer (Cobas 6000 c501, Roche Diagnostics), using an FDA-approved method for human in vitro diagnostics. The same analyzer was used for both institutions. The assay is based on the kinetic interaction of microparticles in solution. Calibration was performed using a six-point curve based on the Roche Calibration Method, with Preciset TDM I calibrators. The calibration range of the analyzer is set for 2.4–60 μg/ml (10.3–258.6 µmol/l, conversion factor: µg/ml × 4.31 to µmol/l) concentrations. The analytical sensitivity is 1.2 µg/ml (5.2 µmol/l). Precision was assessed using multiple sample types, including pooled spiked human plasma. For repeatability, the coefficient of variation (CV) was 3.4% at 67.2 µmol/l and 2.7% at 163 µmol/l. For intermediate precision, the CV was 3.9% at 67.2 µmol/l and 3.0% at 163 µmol/l. The test results were returned by email, and the analysis date was recorded for each sample. The therapeutic index recommended by the reference laboratory analyzer is between 65.0 and 150.0 µmol/l. Concentrations below 65.0 µmol/l are considered subtherapeutic. Concentrations above 150.0 µmol/l are considered potentially toxic. International veterinary epilepsy task force (IVETF) recommendations (Bhatti et al., 2015)To provide additional context for the interpretation of our results, we also considered the IVETF-defined therapeutic index, which is consistent with the latest ACVIM consensus statement on seizure management in dogs (Podell et al., 2016). According to these guidelines, plasma phenobarbital concentrations between 64.7 and 150.9 µmol/l are considered therapeutic. Values below 64.7 µmol/l are considered subtherapeutic, and values above 150.9 µmol/l are considered potentially toxic. Statistical analysisAll statistical analyses were performed using XLSTAT (v2024.4.1). Our primary objective was to assess the agreement between an on-site automated POC analyzer (Catalyst One, IDEXX Laboratories) and an off-site automated analyzer (Cobas 6000 c501, Roche Diagnostics) in a reference laboratory (Antech Laboratories) for quantifying plasma phenobarbital concentrations. Passing–Bablok regression was performed first. The two-analyzer equivalence was assessed based on the 95% CI estimated parameters. Two analyzers are considered equivalent when the 95% CI parameters for the intercept contain 0, and the 95% CI parameters for the slope contain 1. The Lin CCC was then calculated to estimate the degree of agreement between the two analyzers (>0.99=almost perfect; 0.95–0.99=substantial; 0.90–0.95=moderate; and <0.90=poor). Finally, the Bland–Altman method was used to compute the mean bias and 95% limits of agreement. The normality of the differences in plasma phenobarbital concentrations between both analyzers was assessed prior to the Bland–Altman analysis using the Shapiro–Wilk test and visual inspection of the Q–Q plot. A secondary objective was to evaluate the effect of clinical and biological variables on the difference in plasma phenobarbital concentrations measured by both analyzers. Spearman’s rank correlation was used to evaluate the effect of weight, age, daily phenobarbital dosage, and ALP and ALT values. Student’s t-test was used to evaluate the effect of species, the institution where the POC analysis was performed, the concurrent analysis of other biochemical parameters alongside phenobarbital on the POC analyzer, and the presence of medications other than phenobarbital. The Shapiro–Wilk test and visual inspection of Q–Q plots were used to assess the normality of the continuous dependent variable within each group. Levene’s test was used to assess the equality of variances between the groups. Data for which normality was not rejected were presented as means (standard deviation, SD); otherwise, data were presented as medians [1st quartile–3rd quartile]. Ethical approvalThis retrospective study was based solely on clinical and biological data available in medical records. During the study period (September 2023 to December 2024), all phenobarbital measurements were obtained as part of routine TDM. Paired plasma phenobarbital concentrations were measured from the same blood sample on-site at one of the two institutions and off-site at the external reference laboratory. There was no direct contact with animals or owners during data collection or analysis, and all data were anonymized before analysis. For all the reasons outlined above and in accordance with institutional guidelines, formal ethical approval was not considered necessary. ResultsStudy populationThirty cases met the inclusion criteria. Among these, two had multiple plasma phenobarbital concentrations measured concomitantly on the POC and the reference laboratory analyzers, at different visit days, for a total of 33 paired plasma phenobarbital measurements. No cases or paired plasma samples were excluded. Among the 33 paired measurements included, 21 were retrieved from the AniCura Nordvet database and 12 from the AniCura TRIOVet database. There were 16 males (including 11 neutered) and 14 females (including 12 neutered). The median age at the time of blood sampling was 5.2 years [3.3–7.9]. The median body weight was 19.7 kg [5–32]. There were 23 dogs represented by the following breeds: Australian Shepherd (n=4), Husky (n=3), Chihuahua (n=2), French Bulldog (n=2), and one of each of the following breeds: Beagle, Beauceron, Border Collie, Brittany Spaniel, Dalmatian, English Bulldog, English Setter, German Shepherd, Miniature American Shepherd, Rottweiler, Shetland, and Spitz. Seven cats were also included, comprising domestic shorthair (n=4), and one of each of the following breeds: Bengal, Birman, and Norwegian. The main diagnosis was idiopathic epilepsy (n=25), followed by meningoencephalomyelitis of unknown origin (n=2), porencephalic lesions (n=2), and post head trauma (n=1, no advanced imaging performed). Concerning comorbidities, one cat was suspected of having idiopathic cystitis, and one cat had chronic kidney disease associated with systemic hypertension and proteinuria. The median daily phenobarbital dosage was 3.7 mg/kg [2.9–5.6] twice a day. Overall, 15 animals received medications other than phenobarbital (for a total of 18/33 samples), including levetiracetam (n=15), potassium bromide (n=6), prednisolone (n=3), imepitoin (n=1), zonisamide (n=1), amlodipine (n=1), cyclosporine (n=1), cytosine arabinoside (n=1), phenylpropanolamine (n=1), and selegiline (n=1). The plasma ALP and ALT values were available in 29 samples. The median values of plasma ALP and ALT were 160 U/L [57–532] and 72 U/L [46–98], respectively. Plasma phenobarbital was measured concurrently with other biochemical parameters on the POC analyzer in 22 samples. Comparison between the POC and the reference laboratory analyzersThirty-three paired plasma phenobarbital concentrations were measured using the POC and reference laboratory analyzers. The median plasma phenobarbital concentrations were 130.4 µmol/l [108.1–161.4] for the POC analyzer and 105.6 µmol/l [89.9–135.5] for the reference laboratory analyzer (Fig. 1). Passing–Bablok regression showed that the two analyzers were not equivalent. The 95% CI of the intercept included 0 (95% CI: -32.17–15.85 µmol/l), but the slope’s 95% CI did not include 1 (95% CI: 1.01–1.46 µmol/l, Table 1, Fig. 2). The Lin CCC showed poor concordance between the two analyzers (0.74, 95% CI: 0.59–0.84). The normality of the differences in plasma phenobarbital concentrations between the two analyzers was not rejected based on the Shapiro–Wilk test (Table 2) and visual inspection of the Q-Q plot (Fig. 3). Bland–Altman analysis revealed a positive bias between the POC and reference laboratory analyzers with a x̄ (mean bias) and SD of 22.50 ± 18.39 µmol/l (p < 0.0001) and 95% limits of agreements of −13.54 to 58.53 µmol/l (Table 1, Fig. 4). There was one outlier with a POC concentration of 139.9 µmol/l and a reference laboratory concentration of 78.5 µmol/l (difference of +61.4 µmol/l). For phenobarbital measurements by both analyzers, and for the differences in phenobarbital measurements between the two analyzers, the assumption of normal distribution was assessed using Shapiro–Wilk tests and visual inspection of Q–Q plots (Table 2 and Fig. 3). This assessment allowed us to additionally present these results as means ± 2 SD (Table 2). Medical interpretation of paired phenobarbital measurements (subtherapeutic, potentially toxic)Regarding the POC analyzer’s phenobarbital measurements and its corresponding therapeutic index recommendations, 1/33 results were interpreted as subtherapeutic, while 17/33 results were interpreted as potentially toxic (> 129.3 µmol/l). Regarding the reference laboratory measurements and their corresponding therapeutic index recommendations, 1/33 results were interpreted as subtherapeutic, while 7/33 results were interpreted as potentially toxic (> 150.0 µmol/l). Discrepancies in the medical interpretation of paired phenobarbital measurements between the POC and the reference laboratory analyzers were observed in 10/33 paired samples (30.3%). In all 10 discordant paired samples, the POC measurement indicated a potentially toxic level (> 129.3 µmol/l), while the corresponding paired reference laboratory measurement remained below its suggested toxicity threshold (≤ 150.0 µmol/l). When the IVETF therapeutic index recommendations were applied to the POC analyzer results (with the toxicity threshold set at > 150.9 µmol/l), discrepancies in interpretation were observed in only 2 of the 33 paired samples (6%). Effect of clinical and biological variablesNo significant effect was found for any of the assessed variables on the difference between paired plasma phenobarbital concentrations measured by the POC and reference laboratory analyzers. Species (p=0.98), weight (p=0.27), age (p=0.76), daily phenobarbital dosage (p=0.91), ALP (p=0.75), ALT (p=0.28), institution where the POC analysis was performed (p=0.14), concurrent analysis of other biochemical parameters on the POC analyzer (p=0.99), and administration of medications other than phenobarbital (p=0.29) did not significantly influence the observed differences. DiscussionThe results of our study showed that the POC and reference laboratory analyzers were not equivalent in our study population. A systematic proportional bias was identified between the two analyzers (Bland–Altman p < 0.0001; Lin CCC=0.74). On average, the POC analyzer yielded phenobarbital concentrations 22.5 µmol/l higher than those obtained from the reference laboratory analyzer, with differences ranging from −8.1 to +61.4 µmol/l. The magnitude of the discrepancy varied considerably between paired samples, with a tendency for larger differences at higher phenobarbital concentrations. A multiplying factor can be derived from the slope of the Passing–Bablok regression, which is provided in Table 1 (slope=1.20, 95% CI: 1.01–1.46). This value reflects the proportional bias between the two analyzers. However, due to the considerable variability around the regression line (Fig. 2), the wide limits of agreement in the Bland–Altman analysis, the Lin’s CCC of 0.74, and given our relatively small sample size, we do not recommend applying this conversion factor in clinical practice.
Fig. 1. Box plot comparing plasma phenobarbital concentrations measured by the point-of-care (POC) and reference laboratory analyzers. The red crosses indicate the mean phenobarbital concentration for each method. Table 1. Results of Passing–Bablok regression, Lin concordance correlation coefficient (CCC), and Bland–Altman plot bias analysis to assess the agreement between the POC and reference laboratory analyzers for quantifying canine and feline plasma phenobarbital concentrations.
Fig. 2. Passing–Bablok regression analysis comparing plasma phenobarbital concentrations obtained using the point-of-care (POC) and reference laboratory analyzers. The solid red line represents the regression line, and the dashed black line represents the line of identity. Grey lines indicate the 95% confidence intervals for the slope and intercept. Table 2. Assessment of normality and descriptive statistics (mean ± 2 SD) for plasma phenobarbital concentrations measured by both analyzers, and for phenobarbital concentrations differences between analyzers.
Discrepancies in the medical interpretation of paired plasma phenobarbital concentrations between the POC and reference laboratory analyzers were identified in 30% of our samples. Two main factors could account for these inconsistencies. First, the absolute differences between paired measurements were sometimes substantial, with a mean positive bias of 22.5 µmol/l for the POC analyzer and individual differences reaching as high as +61.4 µmol/l. Second, the use of distinct therapeutic reference ranges and toxicity thresholds recommended by each analyzer could also result in discrepancies in interpretation. Notably, when the POC results were interpreted using the IVETF recommendations (i.e., using 150.9 µmol/l instead of 129.3 µmol/l as the toxicity threshold), the rate of discrepant interpretations dropped to only 6%.
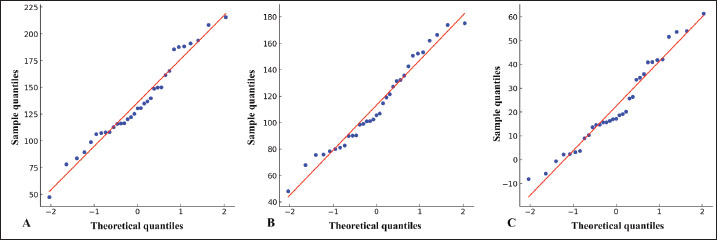
Fig. 3. Quantile-Quantile (Q-Q) plots for normality assessment. (A) Phenobarbital concentrations measured using the point-of-care analyzer. (B) Phenobarbital concentrations measured using the reference laboratory analyzer. (C) Differences in phenobarbital measurements between the two analyzers. In all three plots, the data points (blue dots) are compared with a theoretical normal distribution (red line). The linear distribution of points along the red line indicates approximate normality (supported by the results of the Shapiro-Wilk tests).
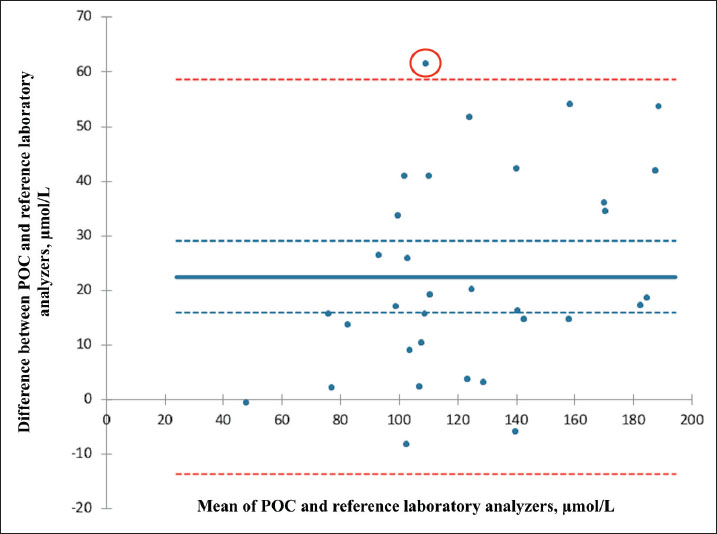
Fig. 4. Bland–Altman plot illustrating the agreement between plasma phenobarbital concentrations measured by the point-of-care (POC) and reference laboratory analyzers. The solid blue line represents the mean bias; the dashed blue lines represent the mean bias’s 95% confidence interval. The dashed red lines correspond to the limits of agreement (mean bias ± 1.96 SD). One outlier is circled in red. On average, the POC analyzer measured phenobarbital concentrations 22.5 µmol/l higher than the reference laboratory analyzer. The systematic proportional bias observed in our study was considered clinically relevant, given the wide 95% limits of agreement (−13.54 to 58.53 µmol/l) and the high rate of discrepant medical interpretations (30%), both of which may significantly influence clinical decision-making. For instance, in one case, the POC analyzer reported a phenobarbital concentration of 185.6 µmol/l, whereas the reference laboratory reported 131.5 µmol/l on the same plasma sample. Based on the POC result, even when applying the IVETF guidelines, the interpretation suggested potential toxicity and could have led to a decision to reduce the daily phenobarbital dosage. In contrast, the result from the reference laboratory remained within its own therapeutic range and below the recommended toxicity threshold, supporting a decision to maintain the current dosage. When not clinically indicated, reducing the dose in such a scenario could risk compromising seizure control without preventing actual toxicity. For all these reasons, our findings suggest that caution should be exercised when using both analyzers interchangeably in clinical practice. Although analytical precision was not independently assessed in our study for either analyzer, the observed systematic bias supports the consistent use of the same analyzer for phenobarbital TDM. Despite the absence of an independent peer-reviewed validation study for phenobarbital measurement on the Catalyst One analyzer, the assay is widely used in veterinary practice and marketed by IDEXX Laboratories as a validated in-clinic method. In addition, a recent method comparison study (Thungrat et al., 2025) demonstrated good agreement between the IDEXX Catalyst Dx analyzer (a closely related platform) and the reference HPLC method. These findings support the analytical reliability of this POC system for phenobarbital monitoring. Further studies evaluating the phenobarbital assay on the Catalyst One analyzer in dogs and cats would help confirm and strengthen its clinical use. Regarding the Cobas 6000 c501 analyzer, although the assay is FDA-approved for human in vitro diagnostics and not specifically validated for veterinary species, it is routinely employed in veterinary diagnostic laboratories for phenobarbital monitoring in dogs and cats, owing to its established analytical performance and broad dynamic range. A lack of agreement between POC and reference laboratory analyzers for various biological parameters has previously been documented in veterinary medicine (Baral et al., 2021; Zuercher et al., 2021; Halman et al., 2025). The underlying reasons for these discrepancies remain unclear and likely multifactorial. We found no significant effect of any assessed clinical or biological variable on the difference between paired plasma phenobarbital concentrations measured by the two analyzers, yet this conclusion should be interpreted with caution. The relatively small sample size may have limited our analyses’ statistical power and increased the influence of individual outliers—as illustrated by one notable case in our study (Fig. 4). Further investigations are warranted to investigate the factors contributing to discrepancies between POC and reference laboratory results under clinical conditions. Thirty-three paired samples from 30 individual dogs and cats were included in this study. Two dogs contributed multiple paired samples, which were retained in the analysis. Our objective was to report as many paired phenobarbital measurements as possible to characterize the overall agreement between both analyzers, without specifically aiming to distinguish between inter- and intra-individual variability. For the first dog, the differences in phenobarbital concentrations between the two analyzers were 18.7, 42.2, and 34.5 µmol/l across three time points. Differences for the second dog were 3.7 and 13.7 µmol/l. While these longitudinal data are too limited to draw generalizable conclusions about intra-individual consistency, it highlights an interesting area for future studies. This study has several limitations, the first being its retrospective design. Because data collection relied on existing medical records from two different institutions, standardization of certain pre-analytical variables—such as sample handling or storage duration—could not be fully ensured across all cases. Despite institutional protocols being consistently followed at both sites, minor variations in analytical procedures, calibration, maintenance, or QC of the POC analyzers, as well as operator-related factors, may have contributed to analytical variability. Notably, although QC of the POC analyzers was not consistently performed on a monthly basis as recommended by the manufacturer, all QC results obtained at both institutions during and after the study period were valid and remained within the acceptable reference ranges. Additionally, paired plasma samples were obtained, analyzed on-site, or sent to the reference laboratory under routine clinical conditions. Unlike in laboratory-based studies, pre-analytical assessment for hemolysis, icterus, and lipemia was not systematically performed using an integrated clinical chemistry system. Degrees of hemolysis, icterus, and lipemia may impact most clinical chemistry assays (Ho et al., 2021; Karin et al., 2023). However, according to both human literature and Cobas 6000 c501 method sheet, plasma phenobarbital concentrations are not significantly affected by hemolysis, icterus, or lipemia up to interference indices of 1,000 for hemolysis (≈1 g/dl of hemoglobin), 60 for icterus (≈60 mg/dl of total bilirubin), and 600 for lipemia (≈10 g/l of triglycerides), which are levels typically not encountered in macroscopically normal plasma samples (The University of Iowa Department of Pathology, 2013; Roche Diagnostics, 2015). Both institutions routinely avoid analyzing or submitting visibly abnormal samples, as described in the Materials and Methods section. Notably, no gross abnormalities were reported in any of the samples analyzed by the reference laboratory. Despite these limitations, the conditions under which samples were obtained, analyzed, or shipped are representative of routine veterinary practice. Another important limitation is the relatively small number of paired plasma samples, which may have influenced the width of the 95% confidence intervals (CIs) for both the mean bias and the limits of agreement (Bland and Altman, 1986). The 95% CI for the mean bias (22.50 µmol/l) ranged from 15.98 to 29.02 µmol/l. The 95% CIs for the lower and upper limits of agreement were −24.82 to −2.26 µmol/l and 47.25–69.81 µmol/l, respectively. These relatively wide intervals reflect both the limited sample size and the considerable variability in the observed differences. Nevertheless, these results indicate substantial discrepancies between the two analyzers even under the most optimistic interpretation. However, we acknowledge that the relatively small sample size of our study population weakens the strength of our conclusions, and that caution should be exercised before extrapolating these results to the general population. ConclusionIn our study population, the POC and reference laboratory analyzers were not equivalent for the quantification of plasma phenobarbital concentrations due to a systematic proportional bias. This bias was deemed clinically relevant, as it resulted in divergent medical interpretations—and potentially divergent clinical decisions—in 30% of paired measurements. Veterinary practitioners should consider these discrepancies and exercise caution when interpreting phenobarbital concentrations, particularly when different analyzers are used over the course of therapeutic drug monitoring. Further studies are warranted to explore the underlying causes of these variations and to assess their clinical impact on a broader population. Conflict of interestThe authors declare no conflict of interest. FundingThis study received no specific grant. Authors’ contributionsBoth authors equally contributed to the study design, data collection, and data analysis. Dr. Scherf wrote and submitted the manuscript. Dr. Van Caenegem reviewed and revised the manuscript and provided continuous support throughout the writing process. Data availabilityThe data supporting the findings of this study are available from the corresponding author upon reasonable request. ReferencesAbramson, F.P. 1988. Autoinduction of phenobarbital elimination in the dog. J. Pharm. Sci. 77, 768–770. Baral, R.M., Freeman, K.P. and Flatland, B. 2021. Comparison of serum and plasma SDMA measured with point-of-care and reference laboratory analysers: implications for interpretation of SDMA in cats. J. Feline Med. Surg. 23(10), 906–920. Bhatti, S.F., De Risio, L., Muñana, K., Penderis, J., Stein, V.M., Tipold, A., Berendt, M., Farquhar, R.G., Fischer, A., Long, S., Löscher, W., Mandigers, P.J., Matiasek, K., Pakozdy, A., Patterson, E.E., Platt, S., Podell, M., Potschka, H., Rusbridge, C. and Volk, H.A. 2015. International Veterinary Epilepsy Task Force consensus proposal: medical treatment of canine epilepsy in Europe. BMC Vet. Res. 11, 176. Bland, J.M. and Altman, D.G. 1986. Statistical methods for assessing agreement between two methods of clinical measurement. Lancet 1(8476), 307–310. Boothe, D.M. 2011. Anticonvulsant and other neurologic therapies. Small animal clinical pharmacology and therapeutics. Charalambous, M., Brodbelt, D. and Volk, H.A. 2014. Treatment in canine epilepsy--a systematic review. BMC. Vet. Res. 10, 257. Charalambous, M., Pakozdy, A., Bhatti, S.F.M. and Volk, H.A. 2018. Systematic review of antiepileptic drugs’ safety and effectiveness in feline epilepsy. BMC Vet. Res. 14(1), 64. Chutipongtanate, A., Yasaeng, C., Virankabutra, T. and Chutipongtanate, S. 2020. Systematic comparison of four point-of-care methods versus the reference laboratory measurement of hemoglobin in the surgical ICU setting: a cross-sectional method comparison study. BMC Anesthesiol. 20(1), 92. Halman, C., Courtman, N. and Stone, B. 2025. Comparison of 2 point-of-care analyzers and the Eurolyser assay with an IDEXX reference laboratory method for measurement of symmetric dimethylarginine in dogs. Am. J. Vet. Res. 86(3), ajvr.24.07.0204. Ho, C.K.M., Chen, C., Setoh, J.W.S., Yap, W.W.T. and Hawkins, R.C.W. 2021. Optimization of hemolysis, icterus and lipemia interference thresholds for 35 clinical chemistry assays. Pract. Lab. Med. 25, e00232. Idexx Laboratories. 2024. Catalyst One, chemistry analyzer, operator’s guide. Westbrook, Maine: Idexx Laboratories, Inc. Karin, A., Higgins, V., Miller, J., Brinc, D., Kulasingam, V. and Selvaratnam, R. 2023. Evaluation of hemolysis, lipemia, and icterus interference with common clinical immunoassays. Clin. Chem. Lab. Med. 61, 1035–1045. Podell, M., Volk, H.A., Berendt, M., Löscher, W., Munana, K., Patterson, E.E. and Platt, S.R. 2016. ACVIM small animal consensus statement on seizure management in dogs. J. Vet. Intern. Med. 30(2), 477–490. Roche Diagnostics. 2015. Cobas 6000 c501 analyzer, PHNO2 phenobarbital assay, method sheet V8.0. Mannheim, Germany: Roche Diagnostics GmbH. Shaw, J.L.V. 2015. Practical challenges related to point of care testing. Pract. Lab. Med. 4, 22–29. The University of Iowa Department of Pathology. 2013. Laboratory services handbook. Iowa city, IA: University of Iowa Hospitals and Clinics. Thungrat, K., Gibson, R., Jukier, T., Jenkins, A. and Cruz-Espindola, C. 2025. Comparison of 3 methods of quantification of phenobarbital in canine plasma: high-performance liquid chromatography, a point-of-care immunoassay, and the FDA-approved immunoassay analyzer. J. Vet. Diagn. Invest. 37(2), 272–277. Zuercher, J., Boes, K.M., Balogh, O., Helms, A.B. and Cecere, J.T. 2021. Comparison of a point-of-care analyzer with a chemiluminescent immunoassay for serum progesterone measurement in breeding management of the bitch. Front. Vet. Sci. 8, 660923. | ||
| How to Cite this Article |
| Pubmed Style Scherf G, Caenegem NV. Agreement between a point-of-care analyzer and a reference laboratory analyzer for plasma phenobarbital quantification in dogs and cats. Open Vet. J.. 2025; 15(9): 4716-4725. doi:10.5455/OVJ.2025.v15.i9.76 Web Style Scherf G, Caenegem NV. Agreement between a point-of-care analyzer and a reference laboratory analyzer for plasma phenobarbital quantification in dogs and cats. https://www.openveterinaryjournal.com/?mno=256829 [Access: January 25, 2026]. doi:10.5455/OVJ.2025.v15.i9.76 AMA (American Medical Association) Style Scherf G, Caenegem NV. Agreement between a point-of-care analyzer and a reference laboratory analyzer for plasma phenobarbital quantification in dogs and cats. Open Vet. J.. 2025; 15(9): 4716-4725. doi:10.5455/OVJ.2025.v15.i9.76 Vancouver/ICMJE Style Scherf G, Caenegem NV. Agreement between a point-of-care analyzer and a reference laboratory analyzer for plasma phenobarbital quantification in dogs and cats. Open Vet. J.. (2025), [cited January 25, 2026]; 15(9): 4716-4725. doi:10.5455/OVJ.2025.v15.i9.76 Harvard Style Scherf, G. & Caenegem, . N. V. (2025) Agreement between a point-of-care analyzer and a reference laboratory analyzer for plasma phenobarbital quantification in dogs and cats. Open Vet. J., 15 (9), 4716-4725. doi:10.5455/OVJ.2025.v15.i9.76 Turabian Style Scherf, Grégoire, and Nicolas Van Caenegem. 2025. Agreement between a point-of-care analyzer and a reference laboratory analyzer for plasma phenobarbital quantification in dogs and cats. Open Veterinary Journal, 15 (9), 4716-4725. doi:10.5455/OVJ.2025.v15.i9.76 Chicago Style Scherf, Grégoire, and Nicolas Van Caenegem. "Agreement between a point-of-care analyzer and a reference laboratory analyzer for plasma phenobarbital quantification in dogs and cats." Open Veterinary Journal 15 (2025), 4716-4725. doi:10.5455/OVJ.2025.v15.i9.76 MLA (The Modern Language Association) Style Scherf, Grégoire, and Nicolas Van Caenegem. "Agreement between a point-of-care analyzer and a reference laboratory analyzer for plasma phenobarbital quantification in dogs and cats." Open Veterinary Journal 15.9 (2025), 4716-4725. Print. doi:10.5455/OVJ.2025.v15.i9.76 APA (American Psychological Association) Style Scherf, G. & Caenegem, . N. V. (2025) Agreement between a point-of-care analyzer and a reference laboratory analyzer for plasma phenobarbital quantification in dogs and cats. Open Veterinary Journal, 15 (9), 4716-4725. doi:10.5455/OVJ.2025.v15.i9.76 |

