Open Veterinary Journal, (2025), Vol. 15(9): 4496-4504
Research Article
10.5455/OVJ.2025.v15.i9.55
Using biometric analysis to estimate body weight in Creole goats
Fritz Trillo-Zárate1,2*, Miguel Enrique Paredes-Chocce1, Jorge Salinas1, Víctor Alexander Temoche-Socola1, Lucinda Tafur Gutiérrez1, Emmanuel Alexander Sessarego2, Irene Acosta1, Walter Palomino-Guerrera2, Juancarlos Alejandro Cruz-Luis1 and Jose Antonio Ruiz-Chamorro1
1Dirección de Servicios Estratégicos Agrarios, Instituto Nacional de Innovación Agraria (INIA), Lima, Perú
2Departamento Académico de Producción Animal, Facultad de Zootecnia, Universidad Nacional Agraria La Molina, (UNALM), Lima, Perú
*Corresponding Author: Fritz Trillo-Zárate. Departamento Académico de Producción Animal, Facultad de Zootecnia, Universidad Nacional Agraria La Molina (UNALM), La Molina, Lima, Perú. Email: ftrillo [at] lamolina.edu.pe
Submitted: 11/04/2025 Revised: 10/08/2025 Accepted: 31/08/2025 Published: 30/09/2025
© 2025 Open Veterinary Journal
This is an Open Access article distributed under the terms of the Creative Commons Attribution-Non Commercial-No Derivatives License (http://creativecommons.org/licenses/by-nc-nd/4.0/), which permits non-commercial re-use, distribution, and reproduction in any medium, provided the original work is properly cited, and is not altered, transformed, or built upon in any way.
Abstract
Background: Creole goat husbandry for milk and meat improves food security in rural areas in Perú. Body weight (BW) is a key trait for selecting breeding stock, and it is estimated to be using algorithms. Likewise, BW is common in livestock farming.
Aim: This study aimed to compare BW prediction models using a data mining algorithm in Creole goats, considering their biometric measurements.
Methods: Data from 1,075 females aged between 1 and 4 years were used. Measurements of chest width, thoracic perimeter, wither height, sacrum height, rump width and length, body length, cannon bone perimeter, age, and region of the herd were recorded. The regression trees (classification and regression tree), support vector regression (SVR), and random forest regression (RFR) algorithms were used.
Results: The SVR was better at predicting BWs in Creole goat herds. Similarly, the results were stable during training (R2=0.765) and testing (R2=0.707). However, it should be noted that RFR performed better with training data (R2=0.942).
Conclusion: The proposed predictive models have demonstrated significant potential for accurately predicting BW based on biometric data. Finally, it contributes to better selection, feeding, and sanitary management of Creole goats.
Keywords: Algorithms, Creole, Machine learning, Predictive models, Morphometrics goats.
Introduction
Creole goats show a remarkable ability to adapt to desert, tropical, and mountainous steppes, where there is often a food shortage for both inhabitants and livestock (Silanikove, 2000; Urviola et al., 2016). However, people safeguard their food security through goats that provide milk and meat. The fat, protein, and mineral contents of these products are strongly related to the weight and age of goats (Mahgoub et al., 2004; Almeida et al., 2016).
Programs to improve animal genetics often consider body weight (BW) as a selection criterion. Therefore, it is crucial to collect this information from Creole goat herds. However, they are often found in wild agroecological zones managed by small farmers without experience in managing records and technology (Pathade et al., 2020; Datt et al., 2023). Therefore, methods such as predictive must be implemented to collect data on the BW of Creole goat herds.
A frequently used approach to predicting BW involves multiple linear regression using least squares, which requires the accomplishment of certain conditions to minimize the problems. However, to optimize the models, options based on learning algorithms (Tırınk, 2020). This method offers greater flexibility in terms of presuppositions before the modeling of the biometric variables measured in goats.
Data mining algorithms have been implemented as tools for modeling and predicting their ability to establish complex relationships with high predictive accuracy; they have been successful in their application in livestock farming. For example, we used the Chi-square interaction automatic detector (CHAID), exhaustive CHAID (ECHAID), classification and regression trees (CARTs), artificial neural networks (ANNs), support vector regression (SVR), change: random forest regression (RFR) and multivariate adaptive spline regression (MARS) (Ali E Eyduran et al., 2015; Tirink et al., 2023).
CART is an automatic learning algorithm used to construct binary decision trees by dividing a dataset into smaller subgroups based on the predictor variables. It was applied in the prediction of goat BW based on body length, thoracic girth, and height at withers advantage is that it does not require normally distributed data and can handle both and continuous variables, and it is easy to interpret (Mathapo et al., 2022).
However, if the depth of the tree is not controlled, it is prone to overfitting, so ANN is the most recommended algorithm because its networks can learn complex patterns of data were also used in body weight prediction from nonlinear zoometric measurements relationships, as long as there was a large amount of training data, but it must be taken into account that its interpretation is complex (Rodero et al., 2015; Mathapo et al., 2022).
The use of 3D imaging to estimate the BW of cattle is an emerging technology that can optimize the weighing process, accuracy, and animal welfare (Nir et al., 2018). However, to automatically recognize and classify biometric measurements using silhouette data, automated algorithms (Nir et al., 2018; Qiao et al., 2021; Hou et al., 2023). Creole goats are usually found in areas with limited access to 3D technology. Therefore, estimating the BW using biometric measurements will allow us to identify and train the algorithm.
In the past, biometric measurements were used to develop models for predicting BW goats, with the thoracic circumference being one of the most used because of its high correlation. Calibrated tapes are used today in goats and other species (Mohammed and Amin, 1997; De Villiers et al., 2009; Sebolai et al., 2012; Chacón-Hernández and Boschini-Figueroa, 2016). Currently, 3D computer vision systems have been validated in shape that has improved accuracy (Hou et al., 2023).
Adequate control of the BW of Creole goats is crucial for effective management of their selection, nutrition, and health, especially if you aspire to a comprehensive genetic improvement program. Therefore, this study aimed to collect biometric measurements of Peruvian Creole goats according to their region, sex, and to predict their BW using CART, SVR, and RFR algorithms. This was for determining the most effective algorithm for future applications in 3D images
Materials and Methods
Study area
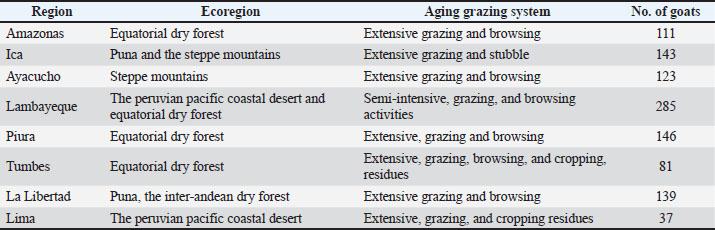
Research was conducted in collaboration with rural communities benefiting from the project “advancement of research services and technology transfer for the sustainable production of in Peru”, conducted by the National Institute of Agrarian Innovation. This project extended to eight regions where goat breeding predominated (Table 1). Technical management of these regions was limited, and most goat producers relied on traditional breeding methods.
Table 1. Goat herds according to region, ecoregion, breeding system, and type of livestock.
Dataset and variables
Data were collected from 1,075 female goats reared extensively in diverse ecosystems such as: dry forests, coastal valleys, mountain steppes, and Puna of the Peruvian highlands (Table 1). The grazing lasted 4–5 hours, with a few herds coming from feeding supplemented with concentrates feed or agricultural residues. To collect biometric data: Chest width (CW), thoracic perimeter (TP), wither height (WH), sacrum height (SH), rump width (RW), rump length (RL), body length (BL), and circumference of the canon (CC) were measured using a zoometric stick and measuring tape measure (Banerjee 2015; Getaneh et al., 2022; Melesse et al., 2022), and BW was measured using a 100-kg capacity digital Roman scale.
Statistical analysis
The biometric measurements of CW, TP, WH, SH, RW, RL, BL, and CC were descriptive analysis, according to the region, mean, standard deviation, and Pearson’s correlations were estimated for the entire population. They were then subjected to modeling where the BW was estimated using CARTs and the support vector regression (SVR), and RFR using R software version 4.3.1 (Cutler et al., 2012).
Random forest regression
Another algorithm we applied to develop predictive models for the body weight of goats was random tree regression; this method combines multiple simple algorithms into a robust model across multiple recovered decision trees. To reach a better decision, a complete analysis of uncorrelated random trees was performed (Iqbal et al. 2022).
Classification and regression trees
A decision tree is a recursive partitioning method that allows us to predict using categorical (classification problems) and continuous (regression problems) data to construct trees. Tree regression allowed us to predict the continuous values of the dependent variable (BW), with region, and age as categorical variables and continuous variables, such as the biometric measurements in Table 2. Iqbal et al. (2022)
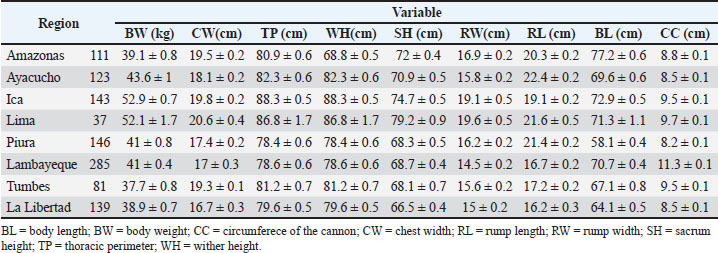
Table 2. Descriptive statistics of biometric measurements according to herd region.
Support vector regression
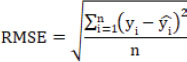
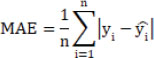
This algorithm allowed us to detect outliers in the high-dimensional spaces. Neural networks are used as multilayer perceptron classifiers (MLP) and radial base functions. A non-linear model was constructed between body weight and the predictor variables modeling. No nonlinearity problems were evident because of the large sample size and the minimal dimensionality of the data, Iqbal et al. (2022). The models were evaluated using the goodness of fit criteria of root mean square error (RMSE), coefficient of variation (CV), mean absolute error (MAE), mean absolute percentage error (MAPE), coefficient of determination (R2), and percentage of the mean square root of (RMSPE) and SD rate (SDR) (Grzesiak and Zaborski, 2012; Tatliyer and A, 2020).
Root mean square error
It was obtained from the mean square root of the error, which is known as the SD of the following: the predicted residuals. Smaller RMSE values are preferred because they indicate a better model.
Coefficient of variation
It measured the relative variability of the data relative to its mean over multiple data subsets. Observing whether the models were over-adjusted or uptight was key.
Mean absolute error
The errors of the predicted and absolute observed values were measured, not canceling out the positive and negative values of the errors small MAE indicates that the model was better adapted
Mean absolute percentage error
This indicated the size of the error in terms of percentages and was easy to interpret and understand. The lower the ASM, the better the model prediction
Coefficient of determination (R2)
The proportion of BW variation explained by region, age, and biometric measurements measured by R2 was estimated. Its range is from 0 to 1, and the values are close to 1 indicates a good fit.
R2=r × r
Pearson’s correlation coefficient (r) was estimated between the predicted and observed body weights in the database.
Percentage of the mean square root of error
The predictive capacity of the model was estimated by calculating the mean square root percentage of error. A lower RMSPE indicated a better model fit.
SD rate
The percentage change in the SD of the predicted dataset compared with the observed one was estimated. The lower the SDR, the better the fit of the model. Sm was where is the mean SD and Sd is the SD of the predicted values.

Cross-validation
An effective method for evaluating the efficiency of a machine learning-based model algorithms was cross-validated, where a limited random form data set was resampled into k of equal size. The first set was used for validation, and the method was adjusted to the remaining K-1 subsets, reducing overfitting, and determining the hyperparameters of the evaluated models. Repeated cross-validation was developed to provide us with a more solitary assessment score. In this study, 20 replications were performed. The database was split into 80% training data and 20% test data.
Ethical approval
This research relied on interviews with goat breeders, making the need for ethical approval unnecessary. Owners provided oral consent to record the qualitative and quantitative characteristics of animals. The authors affirm that the study adhered to the ethical guidelines that govern animal experiments.
Results
Biometric information taken from BW, CW, TP, WH, SH, RW, RL, BL, and CC by mean and SD, indicating that, according to the region, to small goats were kept (Table 2). The Ica goats were medium-sized with a body weight of 52.9 ± 0.7 kg, frequently grazed in puna and the steppe mountains; while the Tumbes small goats with a body weight of 37.7 ± 0.8 kg, grazed in equatorial dry forest.
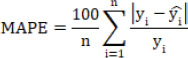
Pearson’s correlation coefficient was used to determine the degree of association between the biometric measurements. All coefficients were significant (p < 0.05), except for RW with CC. Figure 1 shows high positive correlation coefficients between SH and WH (0.76), and TP and BW (0.67). Meanwhile, moderate positive correlation (<0.40) coefficients were CW and BW, TP and CW, WH and BW, WH and CW, WH and TP, SH and BW, SH and CW, and SH and TP; RW and BW, RW and TP, RW and WH; BL and BW, BL and CW, BL and TP, BL and WH, and BL and SH; the other correlation coefficients were low positive, with the exception of RL, which was low negative.
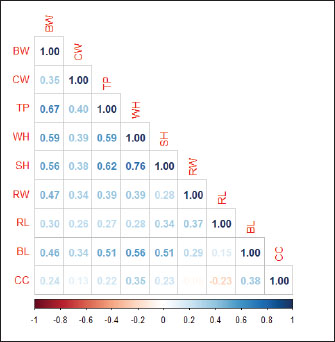
Fig. 1. Correlation matrix of the biometric measurements.
Using the RFR algorithm, the TP and region showed greater relative importance for the choice of model; the second group had WH and SH with greater relative importance. Conversely, CW and age were not important for RFR modeling (Fig. 2). Figure 3 shows the tree diagram using the CART algorithm, in which the 42 kg BW is the root node. In the case of TP, an initial depth <86 cm determined that the BW for Creole goats was 38 kg (70%). On the right side of the tree, the initial depth in of TP > 86 cm, the tree was divided into 2 parts. If TP was < 79 cm, the BW of 35 kg (36%) was determined, and the tree was divided according to the WH < 67 cm, the BW of 42 kg (33%) was determined. The mean BW was 52 kg (30%) if the TP was 86 cm in the first division, if region=Amazonas, La Libertad, Lambayeque, and Tumbes, BW=46 kg (13%); other regions, the mean BW was 56 kg (18%).
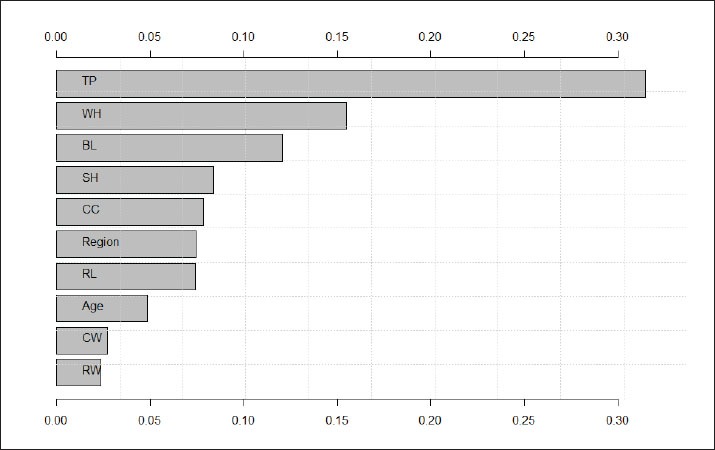
Fig. 2. Importance of predictor variables for BW using the RFR algorithm.
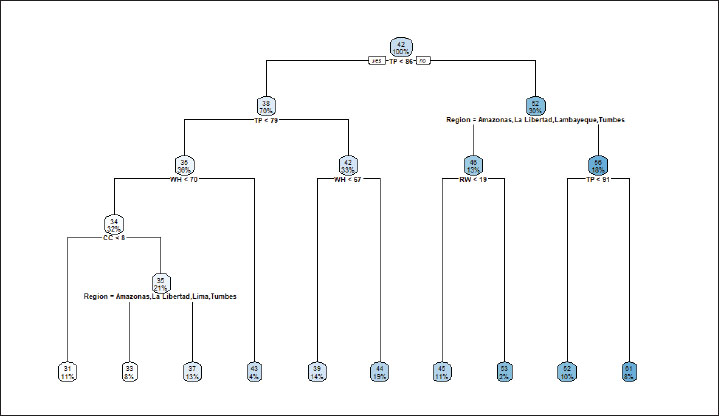
Fig. 3. CART diagram constructed with biometric measurements, sex, region, and age of Creole goats.
The analysis revealed significant differences in the evaluated parameters among the studied regions. Reduced values were observed in the regions of Amazonas, La Libertad, Lambayeque, and Tumbes RW (<19) and TP (<51) were observed. On the other hand, in Amazonas, La Libertad, Lima, and Tumbes, RW values were even lower (<17), accompanied by a pronounced decrease in TP (<8 and <7). Additionally, TP thresholds varied notably among the categories U22 (TP < 86), U23 (TP < 79), U24 (TP < 81), and U25 (TP < 91), suggesting that under the evaluated conditions. These results highlight the importance of regional differences in future studies and interventions.
First, the SVR procedure was performed using the training data. After the training procedure, the SVR predicted the BW of the Creole goats. The kernel function was estimated for the BW. The model was based on the epsilon cost (C), providing a highly reliable model.
Sensitivity analysis was used to estimate the model’s virtual significance for the BW explanatory variables (Fig. 4). The most significant variables were TP, WH, and region importance obtained after the sensitivity analysis. The explanatory variables that were less important were BL and age.
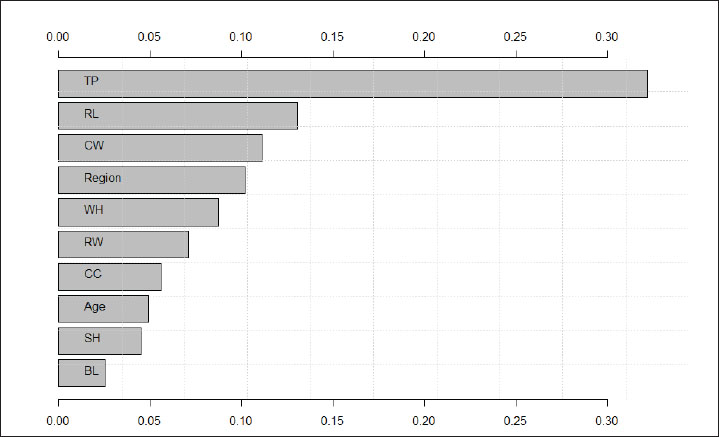
Fig. 4. Relative importance of body weight using the SVR algorithm.
Table 3 shows the performance of the RFR algorithm, where the sensitivity analysis performed well in predicting the significance of the explained variable BW in RFR (Fig. 2). The sensitivity analysis of TP, region, WH, and SH had a high significance >10% in RFR, whereas the highest sensitivity was obtained in SVR with TP, WH, CW, and region (Fig. 4). The lowest significance in both algorithms was found for the age variable, indicating that it does not influence the BW of Creole goats.
Table 3. Goodness-of-fit criteria for the CART, SVR, and RF algorithms used for the live simulation weight prediction.
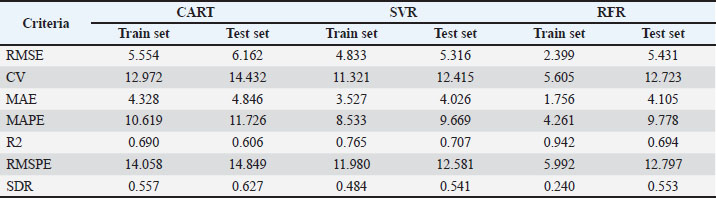
Table 3 compares all goodness-of-fit criteria of the algorithms used to predict BW. In all cases, the training and testing datasets were evaluated. The evaluation criteria were for the test dataset than for the training data. The best algorithm to predict using the test was SVR, although the most suitable was the RFR training set.
SVR was the most appropriate algorithm since its results were similar in both the training and verification sets, its R2 was not greater than that of the RFR for the training datasets. However, we prioritized the similarity of the goodness-of-fit criteria in both training and verification datasets.
Discussion
TP (76.87 ± 1.22 cm), BL (65.54 ± 3.49 cm), WH (60.97 ± 1.59 cm), SH (63.15 ± 1.54 cm), RW (13.78 ± 0.69 cm), and CW (16.36 ± 1.11 cm) of Cuban Creole goats (Torres-Hernández et al., 2022) were lower than those found in Peruvian Creole goats. On the other hand, goats of specialized breeds, such as those with hair in arid ecosystems, had slightly higher WH (73.13 ± 0.33–81.78 ± 0.77 cm), TP (72.47 ± 0.36–81.86 ± 0.51 cm), CW (18.10 ± 0.14–23.22 ± 0.32 cm), and BL (86.22 ± 0.36–98.89 ± 0.86) (Chacón-Hernández and Boschini-Figueroa, 2016). The results indicated that the Creole goats of Peru had different degrees of crossbreeding depending on the habitat’s region and altitude.
Hair goats in arid ecosystems showed an increase in BW of 47.35 ± 0.42, 52.2 ± 0.46, and 64.09 ± 0.34 kg per year, 2 years, and 4 years, respectively. Meanwhile, Creole goats from tropical ecosystems in Botswana had an increase of 18.8 ± 0.51, 33.8 ± 0.51, 48.8 ± 0.99, and 45.5 ± 1.91 kg per year, 2 years, 3 years, and more than 3 years, respectively, whereas females had a lower growth with significant differences (p < 0.05) after 2 years. The results of our study showed a higher BW in the puna and steppe mountains with 52.9 ± 0.7 kg, while the lowest BW in the equatorial dry forest with 37.7 ± 0.8 kg, indicating a wide variability for this characteristic of economic importance, as well as medium and small weight goats.
Morphometrics offers a viable and cost-effective alternative for predicting the live weight of small goats and local breeds (Cam et al., 2010; Sebolai et al., 2012). BW is a characteristic of economic importance controlled by many genes, many of which are linked to biometric measurements, with BL and TP standing out for their high degree of association (Mathapo and Tyasi, 2021; Mathapo et al., 2022).
The different statistical methods used for the prediction of BW in goats use biometric measurements, where the strength of the prediction is based on the degree of association of BW with TP, WH, SH, RW, CW, and BL that differ according to the ecosystem and breed (Pesmen and Yardimci, 2008; M. Iqbal et al., 2013; Çakmakçı, 2022; Tirink and C, 2022; Tırınk et al., 2023; Atta et al., 2024). The use of CART, SVR, and RFR algorithms helps to accurately estimate BW, which can be used in selection and improvement schemes (Tirink and C, 2022; Tırınk et al., 2023).
An algorithm based on multivariate adaptive spline regression (MARS) for predicting BW in goats showed that SH, WH, TP, and BL are the morphometric measures with the highest relationship; therefore, their predictive capacity was high, where their MAE (6.474) and R2 adj (0.915) show great strength for the model, even when the training dataset size was small (Rashijane et al., 2023). MARS is superior to the Bayesian regularized neural network, SVR, and RFR; the same study found that SVR was better than RFR. However, other studies have claimed that the RFR algorithm is better than SVR. Our findings indicate that RVS a better BW in goats, depending on the TP model selection (Cam et al., 2010; Tirink and C, 2022).
When comparing CART, MLP, CHAID, MARS, and comprehensive CHAID and RFR algorithms to predict BW in Mengali rams based on goodness-of-fit criteria as R2, RMSE, and SD ratio, they indicated a better estimate with the CART. In our study, the SVR and RFR algorithms were considered more appropriate, but the evaluated biometric measurement dataset must be considered (Celik et al., 2017). The SVR algorithm was used to predict the carcass weight of Asturian cattle, where measurements were performed in 144 animals, and the results indicated that the optimal prediction carcass weight was 150 days before beneficiation, with an MAE of 4.27 (Alonso et al., 2013). In our study, the goodness criteria and MAE were similar, with fewer errors in both the training dataset and in the verification of the biometric measurements.
When examining learning techniques such as CART, k nearest neighbors, MLP, SVR, and RFR with different datasets, the results indicated that RFR is the best algorithm; likewise, RFR was compared with SVR to predict useful solar thermal energy (USTE) systems, where RFR models more reliable predictions. The modeling in our study did not agree with the RFR algorithm had a greater predictive capacity, and it is worth mentioning that the database source is of regions (Ahmad et al., 2018; Marco et al., 2022).
Conclusion
This study found that the use of the SVR algorithm was more successful in recognizing biometric measurements that predict body weight with acceptable goodness-of-fit; likewise, thoracic circumference is highlighted in the model selection.
Acknowledgments
The authors thank the owners of the evaluated herds and the CUI 2506684 project "Improvement of research and technology transfer services for sustainable management” Goat Livestock in Dry Forest and Central Coast, Tumbes, Piura, Lambayeque, Amazonas, La Libertad, Ancash, Ayacucho, Ica, and Lima” of the National The Institute of Agrarian Innovation working group was responsible for data collection.
Conflict of interest
The authors declare no conflict of interest.
Funding
This study received financial support from the project entitled "Improvement of Research and Technology Transfer" Services for the Sustainable Management of Goat Livestock in Dry Forests and the Central Coast across the following departments: Tumbes, Piura, Lambayeque, Amazonas, La Libertad, Ancash, Ayacucho, Ica, and Lima, with CUI 2506684, facilitated by the National Institute of Agrarian Innovation.
Authors’ contributions
F.T-Z. and J.A.C-L.: Conceptualization, methodology, and revision of the manuscript. F.T-Z., E.A.S., M.P-CH., J.S., V.T-S., L.T-G., W.P-G., I.A.: Data collection, data analysis, and writing of the original manuscript. J.A.R-CH. and J.A.C-L.: Project management, fund acquisition, and revision of the manuscript.
All authors have read the manuscript.
Data availability
Data from this study are available on request from the corresponding author.
References
Ahmad, M.W., Reynolds, J. and Rezgui, Y. 2018. Predictive modelling for solar thermal energy systems: a comparison of support vector regression, random forest, extra trees, and trees. J. Cleaner Prod. 20(3), 810–821.
Ali, M., Eyduran., E., Tariq, C., Tirink, C., Abbas, M. AA., Bajwa, M. H., .,Nizamani, A. HB., Waheed, A., Awan, M.A., Shah, S.H., Ahmad, Z. and Jan, S. 2015. Comparison of artificial neural network and decision tree algorithms used for predicting live weight at post weaning period from some biometrical characteristics in Harnai sheep. Pak. J. Zool. 47(6), 1579–1585.
Almeida, A.K., KT Resende, K.T., .,Tedeschi, L.O., Fernandes, M., Regadas Filho, J.G.L. and Teixeira, R.F. 2016. Using body composition to determine weight at maturity of male and female Saanen goats. J. Anim. Sci. 94(6), 2564–2571.
Alonso, J., Castañón, Á.R. and Bahamonde, A. 2013. Support Vector Regression to weight in beef cattle slaughter. Comput. Electron. Agri. 91, 116–120.
Atta, M., Ali, A.B.S., Mohamed, M.B., Al-Dosari, H.M. and Al-Shamari, H.S. 2024. Prediction of body weight using body measurements in some sheep and goats in Qatar. J. Appl. Anim. Res. 52(1):2–6.
Banerjee, S. 2015. Morphometrical and production traits of Bengal sheep in West Bengal, India. Anim. Genetic Resour. 57, 57–71.
Çakmakçı, C. 2022. Live weight prediction in Norduz sheep using machine learning algorithms. Turkish J. Agric.-Food Sci. Technol. 10(4), 587–594.
Cam, M.A., Olfaz, M., Soydan, E. 2010. Possibilities of using morphometrics characteristics as a tool for body weight prediction in Turkish Hair Goats. J. Anim. Vet. Adv. 51, 52–59.
Celik, S., Eyduran, E., Karadas, K. and Tariq, M.M. 2017. Comparison of predictive performance of data mining algorithms in predicting body weight in Mengali rams of Pakistan. Rev. Brasil. De Zootecnia 46(11), 863–872.
Chacón-Hernández, P. and Boschini-Figueroa, C. 2016. Peso estimado en cabras con una cinta comercial de pesaje y perímetro torácico. Agron. Mesoamer. 28(1), 229.
Cutler, A., Cutler, D.R. and Stevens, J.R. 2012. Random forests.In The ensemble machine learning: methods and applications. Eds., Zhang, C. and Ma, Y. Berlin, Germany: Springer.
Datt, M., Bhateshwar,. V. and Rai, D.C. 2023. Importance of body weight, age, and condition in weaning of goat kids: a review. J. Livestock Sci. 14, 71–77.
De Villiers, J.F., Gcumisa, S.T., Gumede, S.A., Thusi, S.P., Dugmore, T.J., Cole, M., Du Toit, J.F., Vatta, A.F., Stevens, C. 2009. Estimation of live body weight from the heart girth measurement in KwaZulu-Natal goats. Appl. Anim. Husbandry Rural Develop. 12(1), 1–8.
Getaneh, M., Taye, M., Kebede, D. and Andualem, D. 2022. Structural indices of the indigenous reared under traditional management systems in the East Gojjam Zone, Ethiopia. Heliyon 8(3), 9180.
Grzesiak, W. and Zaborski, D. 2012. Examples of the use of data mining methods in animal breeding. In Data mining applications in engineering and medicine. Ed., Karahoca A. InTech, pp: 303–24.
Hou, Z., Huang, L., Zhang, Q. and Miao, Y. 2023. Body weight estimation of beef cattle with 3D deep learning model: pointNet++. Comput. Electron. Agri. 213, 108184.
Iqbal, F., Waheed, A., Zil-E-Huma. and Faraz. 2022. Comparison of the predictive ability of machine learning methods for predicting the live body weight of Beetal goats in Pakistan. Pak. J. Zool. 54(1), 231–238.
Iqbal, M., Javed, K., Ahmad, N. and Javed, K. 2013. Prediction of body weight through the body measurements in Beetal goats. Pak. J. Sci. 65(4), 458–461.
Mahgoub, O., Kadim, I.T., Al-Saqry, N.M. and Al-Busaidi, R.M. 2004. Effects of body weight and sex on carcass tissue distribution in goats. Meat Sci. 67(4), 577–585.
Marco, R., Ahmad, S.S.S. and Ahmad, S. 2022. Bayesian hyperparameter optimization and ensemble learning for machine learning models on software effort estimation. IJACSA. Int. J. Adv. Comput. Sci. Applications 13(3), 419.
Mathapo, M.C. and Tyasi, T.L. 2021. Prediction of body weight of yearling Boer goats from morphometric traits using classification and regression tree. Am. J. Anim. Vet. Sci. 16(2), 130–135.
Mathapo, M.C., Mugwabana, T.J. and Tyasi, T.L. 2022. Prediction of body weight from morphological traits of South African non-descript indigenous goats of Lepelle-Nkumbi Local Municipality using different data mining algorithm. Trop. Anim. Health Prod. 54(2), 102.
Melesse, A., Yemane, G., Tade, B., Dea, D., Kayamo, K., Abera, G., Mekasha, Y., Betsha, S. and Taye, M. 2022. Morphological characterization of indigenous goat population in Ethiopia using canonical discriminant analysis. Small Ruminant Res. 20(6), 20.
Mohammed, I.D. and Amin, J.D. 1997. Estimating body weight from morphometric measurements of Sahel Borno White goats. Small Ruminant Res. 24(1), 1–5.
Nir, O., Parmet, Y., Werner, D., Adin, G. and Halachmi, I. 2018. 3D computer-vision system for automatically estimating heifer height and body mass. Biosyst. Eng. 17(3), 4–10.
Pathade, S.S., Singh, B.P., Chander, M. and Bardhan, D. 2020. Profitability of dairy and goat products production system: a multivariate typology of farm households. Indian J. Anim. Sci. 90(2), 275–280.
Pesmen, G. and Yardimci, M. 2008. Estimating the live weight using some body measurements in Saanen goats. Archiva zootechnica. 11(4), 30–40.
Qiao, Y., Kong, H., Clark, C., Lomax, S., Su, D., Eiffert, S. and Sukkarieh, S. 2021. Intelligent perception for cattle monitoring: a review for cattle identification, body condition score evaluation, and weight estimation. Comput. Electron. Agri. 185, 106143.
Rashijane, L.T., Mokoena, K. and Tyasi, T.L. 2023. Using multivariate adaptive regression splines to estimate the body weight of savanna goats. Animals 13(7), 1146.
Rodero, E., González, M.A., Dorado-Moreno, M., Luque, M. and Hervás, C. 2015. Classification of goat genetic resources using morphological traits. Comparison of machine learning techniques with linear discriminant analysis. Livestock Sci. 180(14), 15–21.
Sebolai, B., Nsoso, S.J., Podisi, B. and Mokhutshwane, B.S. 2012. The estimation of live weight based on linear traits in indigenous Tswana goats at various ages in Botswana. Trop. Anim. Health Prod. 44(4), 899–904.
Silanikove, N. 2000. The physiological basis of adaptation in goats to harsh environments. Small Ruminant Res. 35(3), 181–193.
Tatliyer. And, A. 2020. The Effects of rRaising tType on pPerformances of sSome dData mMining aAlgorithms in Lambs. KSU J. Agric. Nat. 23, 772–780.
Tırınk, C. 2020. Estimating of birth weight using placental characteristics in the presence of multicollinearity. Black Sea J. Eng. Sci. 34, 138–145.
Tirink, C., Önder, H., Francois, D., Marcon, D., Şen, U., Shaikenova, K., Omarova, K., Louis, K. and Tyasi, T. 2023. Comparison of data mining and machine learning algorithms for predicting the final body weight for Romane sheep breed. PLos One 18(8), 289348.
Tırınk, C., Piwczyński, D., Kolenda, M. and Önder, H. 2023. Estimation of the body weight based on biometric measurements using random forest regression and support vector regression and CART algorithms. Animals 13(5), 798.
Tirink. And, C. 2022. Comparison of the bayesian regularized neural network and random forest regression, svr, and multivariate adaptive regression splines algorithms to predict body weight from biometrical measurements in Thalli sheep. Universitesi. Veteriner. Fakultesi. Dergisi. 28(3), 411–419.
Torres-Hernández, G., Maldonado-Jáquez, J.A., Granados-Rivera, L.D., Wurzinger, M. and Cruz-Tamayo, A.A. 2022. Creole goats in Latin America and the Caribbean: a priceless resource to ensure the well-being of rural communities. Int. J. Agricult. Sci. Sustainability 20(4), 368–380.
Urviola, N.C., Gómez-Urviola, J., Celi, I., Milán, M. and Jordana, J. 2016. La cabra criolla Peruana, situacion actual y perspectives conservationistas. Biodiversidad. Caprina. Iberoamericana. 1, 163–168.