


| Research Article | ||
Open Vet. J.. 2025; 15(9): 4601-4616 Open Veterinary Journal, (2025), Vol. 15(9): 4601-4616 Research Article Etlingera hemisphaerica modulates mercury chloride-induced alterations in Rattus norvegicus serum proteinsAceng Ruyani1,2*, Deni Parlindungan2,3, Dian Samitra4, Ziko Fahrur Rozi4, Abdul Rohim Tualeka5, Dimas Rahadian Aji Muhammad6 and Ari Diana Susanti61Graduate School of Science Education, Bengkulu University, Bengkulu, Indonesia 2Conservation Education for Sustainability of Bio-Resources (CESB-R), Bengkulu University, Bengkulu, Indonesia 3Department of Science Education, Bengkulu University, Bengkulu, Indonesia 4Department of Biology Education, Universitas PGRI Silampari, Lubuk Linggau, Indonesia 5Department of Occupational Health and Safety, Public Health Faculty, Airlangga University, Surabaya, Indonesia 6Department of Food Science and Technology, Faculty of Agriculture, Universitas Sebelas Maret, Surakarta, Indonesia *Corresponding Author: Aceng Ruyani. Graduate School of Science Education, Bengkulu University, Bengkulu, Indonesia. Email: ruyani [at] unib.ac.id Submitted: 27/03/2025 Revised: 29/07/2025 Accepted: 20/08/2025 Published: 30/09/2025 © 2025 Open Veterinary Journal
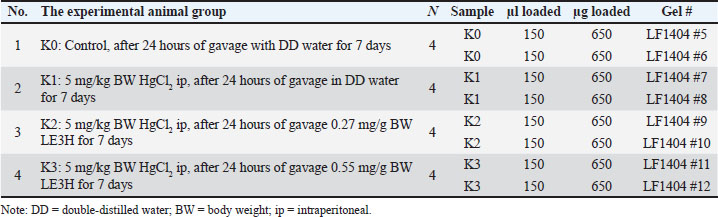
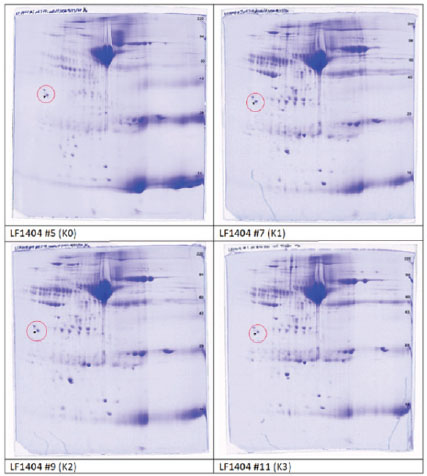
ABSTRACTBackground: The leaf ethanolic extract of Etlingera hemisphaerica (LE3H) changes the levels of eight protein bands in the blood serum impacted by mercury chloride (HgCl₂), making them closer to the normal state in Rattus norvegicus. Aim: This study aimed to understand the effect of LE3H on restoring the intensity of serum proteins in R. norvegicus previously induced by HgCl2. Methods: Male R. norvegicus (rats) were categorized into four groups (K0, K1, K2, and K3), each with four rats. K1, K2, and K3 were administered an intraperitoneal injection of 5 mg/kg body weight (BW) HgCl2. After 24 hours, K1 was gavaged daily with double-distilled (DD) water for 7 days, K2 was gavaged daily for 7 days at a rate of 0.27 mg/g BW LE3H, and K3 was gavaged daily for 7 days at a dose of 0.55 mg/g BW LE3H. Similarly, DD water was given to K0 as a control. On the ninth day, we used cervical dislocation to euthanize the animals and collected their blood from the heart to produce serum. Serum protein levels were quantified using the Lowry method, followed by protein isolation via two-dimensional sodium dodecyl sulfate-polyacrylamide gel electrophoresis. The 2D electropherograms were computerized comparisons, molecular weight and pI measurements, protein digestion and peptide extraction, nano-liquid chromatography-tandem mass spectrometry, data processing, and protein identification. Results: The 2D electropherograms successfully separated 72 spot proteins. The presence of 16 (A, B, C, D, E, F, G, H, I, J, K, L, M, N, O, and P) protein spots significantly increased or decreased influenced by HgCl2 treatment, and then LE3H administration restored the presence of these proteins to close to control conditions. Four selected protein spots with National Center for Biotechnology Information (NCBI) D[gi|37805241], F[gi|295916], H[gi|155369696; gi|60551611], and K [gi|149056721] were significantly increased influenced by HgCl2, and then LE3H restored these proteins to close to control conditions. Four selected protein spots with NCBI L[gi|149043886; gi|116597], M[gi|121041], O[gi|231468], and P[gi|546056; gi|6981010] significantly decreased influenced by HgCl2, and then LE3H restored these proteins to close to control conditions. Conclusion: LE3H may serve as a potential herbal agent to mitigate mercury-induced systemic toxicity via serum protein expression modulation. Keywords: Etlingera hemisphaerica, Mercury chloride, Two-dimensional protein, Blood serum, Rattus norvegicus. IntroductionMercury (Hg) exposure can lead to various health issues, affecting multiple systems in the body. Here are some of the potential health effects. Neurological effects are as follows: (a) Cognitive impairment: Hg exposure can affect memory, attention, and problem-solving skills; (b) Motor dysfunction: tremors, muscle weakness, and coordination problems can occur; and (c) Sensory disturbances: numbness, tingling, or pain in the hands and feet. Developmental effects are as follows: (a) Neurodevelopmental delays: prenatal exposure can impact fetal brain development, leading to cognitive and behavioral issues and (b) Learning disabilities: children exposed to Hg may experience learning difficulties. Other health effects are as follows: (a) Kidney damage: Hg can accumulate in the kidney, leading to damage or disease; (b) Cardiovascular issues: some studies indicate a link between Hg exposure and cardiovascular disease; and (c) Immune system suppression: Hg can weaken the immune system, making individuals more susceptible to infections. One environmental contaminant, Hg, is hazardous to both humans and animals (Curle et al., 1987). Hg poisoning incidents may occur in both affluent and developing countries. In Indonesia, particularly in Bengkulu, Hg poisoning is caused by insufficient understanding of the hazards of mercury, inadequate governmental regulation, and, notably, gold mining operations (Ruyani et al., 1997). Gold mining is also a major source of Hg poisoning incidents in Latin America, which can have negative health and social effects such as immune system compromise, neurological damage, reduced intelligence quotient, and blood cell damage (Olivero-Verbel et al., 2021). In North Carolina, USA, a study involving 221 pregnant women revealed that 63.8% had Hg, and all participants (100%) had Pb in their bloodstream. This exposure was linked to the use of cosmetics, pesticides, and electronic products (Sanders et al., 2012). The fatal dosage of mercuric chloride (HgCl2) for humans is estimated to range from 1 to 4 g. Acute renal failure, circulatory collapse, gastrointestinal issues, corrosive damage, and ultimately death can all be brought on by HgCl2 (Beasley et al., 2014). The central and peripheral nervous systems are especially vulnerable to the serious neurotoxic effects of Hg and its derivatives (Sun et al., 2018). Various ethnic groups in Bengkulu, Indonesia, use Honje hutan (Etlingera hemisphaerica; http://www.theplantlist.org/tpl1.1/record/kew-243067) as an herbal medicine. E. hemisphaerica, also known as “honje” or “kecombrang”, is a plant from the Zingiberaceae family. Some of the properties of E. hemisphaerica are as follows: (1) Anti-inflammatory: This plant has anti-inflammatory properties that can help reduce inflammation; (2) Antibacterial: E. hemisphaerica has antibacterial activity that can help fight infections; (3) Antioxidant: This plant contains antioxidants that can help protect the body from oxidative stress; and (4) Traditional medicine: E. hemisphaerica is used to treat a variety of conditions, such as headaches, fevers, and digestive problems. An investigation into ethnomedicinal plants found that administering ethanolic leaf extract of E. hemisphaerica (LE3H) at a dose of 0.39 mg/g BW to mice reduced blood glucose levels by 36.2% and triglyceride levels by 21.19% in subjects experiencing hyperglycemia and hypertriglyceridemia, respectively (Ruyani et al., 2014). Additionally, research on Hg detoxification indicates that administering LE3H at a dose of 0.39 mg/g BW in mice can provide hepatoprotective effects, thereby reducing the harmful impact of HgCl₂ exposure at 5 mg/kg BW (Ruyani et al., 2017). A previous study found that HgCl2 injection increased leukocyte levels while decreasing erythrocyte counts; however, the blood cell quantities and the control remained stable when HgCl2 administration was followed by LE3H therapy. The 48-kDa protein was overexpressed, and a new 125-kDa protein appeared as a result of HgCl2 treatment; however, LE3H therapy was able to maintain this protein profile similarly to the control condition. LE3H appears to offer possible protective advantages against HgCl₂ toxicity in mouse blood. Further investigation using appropriate methodologies is necessary to evaluate this one-dimensional serum protein profile. Consequently, dietary supplements containing LE3H may provide potential benefits for individuals exposed to HgCl₂ (Ruyani et al., 2019). The estimated oral lethal dose 50% (LD50) of HgCl₂ in rats is 32 mg/kg BW. Rattus norvegicus protein expression can be greatly impacted by HgCl₂ exposure, which can result in a number of health problems. Additionally, LE3H brings the levels of eight protein bands in blood serum that are impacted by HgCl₂ closer to the normal levels seen in R. norvegicus (Ruyani et al., 2023). Does LE3H reverse HgCl₂-induced protein dysregulation? This toxicoproteomics study aimed to understand the effect of LE3H on restoring the intensity of serum proteins in R. norvegicus previously induced by HgCl2. Materials and MethodsExtract preparationThe stem bases of E. hemisphaerica leaves were collected as plant material in Curup City, Rejang Lebong District, Bengkulu Province, Indonesia, with permission from the Indonesian Institute of Sciences, Research Center for Plant Conservation, and Botanic Garden, Bogor, Indonesia (http://lipi.go.id/; Reference No. B-1750/IPH.3./KS/V/2019). Before being cut into small pieces, the leaves were cleaned. Fresh E. hemisphaerica leaves were air-dried and ground into 3,000 to 800 g of dried leaves. The supply of material was deemed sufficient for ongoing research. A concentrated extract weighing 3 g was obtained by macerating the powder for 7 days in 2 L of 96% ethanol and then condensing the filtrate with a rotary evaporator (Sopi and Khan, 2013). After the evaporation of ethanol from the concentrated extract, 2 g of crude extract was used as the test sample (Ruyani et al., 2019, 2020, 2021). Dosage determination and conversionPrevious studies have reported that mice received an effective dose of LE3H at 0.39 mg/g BW (Ruyani et al., 2019, 2020, 2021). Since this study employed R. norvegicus weighing approximately 200 g, as experimental animals, a dose adjustment from 20 g mice to 200 g rats was necessary, using a conversion factor of 7 (Nair and Jacob, 2016). For Dose 1, LE3H was initially administered at 0.39 mg/g BW in mice, equivalent to 7.8 mg per 20 g BW. When converted for rats, this became 7.8 mg × 7=54.6 mg per 200 g BW, or 0.27 mg/g BW. For Dose 2, the mouse dose was doubled to 0.78 mg/g BW, equal to 15.6 mg per 20 g BW, which translates to 15.6 mg × 7=109.2 mg per 200 g BW in rats, or 0.55 mg/g BW. Finally, two LE3H working dosages of 0.27 and 0.55 mg/g BW were established for rats. Experimental animalThe Sprague–Dawley strain of R. norvegicus was used as the experimental subject. Sixteen male rats were categorized into four groups (K0, K1, K2, and K3), each with four rats. K1 rats were injected with 5 mg/kg BW HgCl2 after 24 hours of gavage in double-distilled (DD) water for 7 days. Following an injection of K2 in HgCl2 (5 mg/kg BW), the rats received daily gavages of LE3H (0.27 mg/g BW) for 7 days. After receiving a K3 injection via HgCl2 (5 mg/kg BW), the rats were gavaged with LE3H (0.55 mg/g BW) daily for 7 days. DD water was administered to K0 as a control in the same manner. On day 9, the test animals were given ketamine injections (40–80 mg/kg BW) to put them to sleep (American Veterinary Medical Association, 2013) and to reduce pain. On the same day, they were euthanized through cervical dislocation. Blood samples were collected directly from the cardiac region for further analysis. The samples were mixed with SDS sample buffer (comprising 5.0% SDS, 60 mM Tris at pH 6.8, and 10% glycerol) in a 1:2 ratio (serum to buffer; Nowakowski et al., 2014) to ensure safety and inactivation of potential pathogens. The mixture was then heated in a boiling water bath for 5 minutes. Until they were required for the next stage, blood serum samples were stored frozen at −40°C. Analysis of protein content and electrophoresisProteins are functional gene products; therefore, their presence will better reflect the actual condition of the isolated cells or tissues (Sarto et al., 1999). Because the results of gene transcription (mRNA) in eukaryotic organisms are not directly translated into proteins (Turner et al., 1997), certain pathological conditions or toxicities are more effectively studied from differences in protein appearance (Anderson et al., 2000) than mRNA (Syed and Hecht, 1998). The serum samples were thawed on ice and centrifuged at 2,000 X g for 15 minutes at 4°C. The supernatant was collected into Eppendorf tubes and subjected to a second round of centrifugation at 14,000×g for 15 minutes at the same temperature. The clarified supernatants were then transferred to pre-labeled Eppendorf tubes for further processing. The BCA test method is used to determine protein concentration (Smith et al., 1985; Guttman et al., 2021). Following quantification, the samples were diluted in 1:1 SDS to reach a final protein concentration of 4.33 mg/ml. Reducing agents were added to the urea sample buffer (boiling buffer; Camacho et al., 2019) before gel loading. We used the carrier ampholine isoelectric focusing method developed by Kendrick Labs, Inc. (Madison, WI) to conduct two-dimensional electrophoresis (Table 1). The isoelectric focusing step was performed within a glass tube (3.3 mm inner diameter) using 2.0% pH 3–10 Isodalt Servalytes (Serva, Heidelberg, Germany) and completed over 20,000 volt-hours. Tropomyosin, an internal standard for isoelectric focusing (IEF), was added to each sample in a silver amount of 100 ng. This standard migrates as a doublet, with the lower spot having a molecular weight (MW) of 33,000 and a pI of 5.2; an arrow on the stained gel indicates its location. A surface pH electrode was used to confirm the pH gradient within the enclosed gel tube. A surface pH electrode was used to confirm the pH gradient within the enclosed gel tube. After equilibration for 10 min in buffer “O”—a solution containing 10% glycerol, 50 mM dithiothreitol, 2.3% SDS, and 0.0625 M Tris at pH 6.8—each tube gel was mounted onto a stacking gel located above a 10% acrylamide slab gel (1.0 mm thick). Then, SDS-PAGE was conducted for approximately 5 hours at a constant current of 25 mA per gel. The molecular weight markers included proteins such as myosin (220 kDa), phosphorylase A (94 kDa), catalase (60 kDa), actin (43 kDa), carbonic anhydrase (29 kDa), and lysozyme (14 kDa) (MilliporeSigma). These markers were visualized as distinct bands on the basic end of the 10% acrylamide gels stained using the silver staining method (Oakley et al., 1980). The gels were dried between cellophane sheets following electrophoresis, with the acidic edge aligned to the left. The red circles on the left side of each 2D polyacrylamide gel indicate the IEF internal standard, tropomyosin, with a MW of 33 000 kDa and pI of 5.2 (Fig. 1). Table 1. Two-dimensional sodium dodecyl sulfate-polyacrylamide gel electrophoresis (2D SDS-PAGE) separated R. norvegicus serum protein samples K0, K1, K2, and K3.
Computerized comparisonsEach set of samples yielded duplicate Coomassie blue-stained gels. GE Image Scanner III, a quantitative densitometer (GE Healthcare, Piscataway, NJ, USA), was used to scan the gels. Before scanning, the linearity of the scanner was examined using a step tablet calibrated by NIST (GE Healthcare, Piscataway, NJ). Progenesis SameSpots (version 4.5, 2011, TotalLab, UK) and Progenesis PG240 (version 2006, TotalLab, UK) applications were used for image analysis. Each gel was subjected to a general computerized analysis process that included spot identification, background quantification, and background subtraction (average on boundary) supplemented by thorough manual verification. The spot percentage is calculated by dividing the integrated density of the spot over the background (volume) by the overall density of all observed spots above the background. The difference represents the fold change in percentages of spots. When equivalent protein spots from distinct samples (such as mutant versus wild type) exhibit identical spot percentages, the difference field will indicate 1.0; conversely, if the spot percentage of the mutant is twice that of the wild type, the difference field will reflect 2.0, signifying twofold upregulation. If the spot percentage from the mutant is reduced by 50%, the difference field will indicate −2.0, denoting a two-fold downregulation. Keep in mind that you cannot separately contrast the montage panels, and they can occasionally appear too dark. However, any level of picture contrast has no bearing on any Computations or spot percentage statistics. MW and pI measurementsThe isoelectric point (pI) values for this ampholine group are estimations and are derived from the pH gradient plots for 9 M urea at room temperature (22oC) shown on the next page. The sample itself can change the pH gradient; hence, an internal pI standard should be employed if a more accurate pI measurement is needed. The reference figure’s algorithm generates pI and MW for every site.
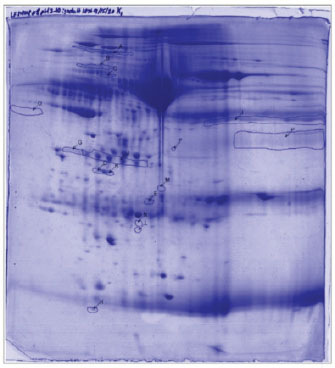
Fig. 1. Two-dimensional sodium dodecyl sulfate-polyacrylamide gel electrophoresis separated R. norvegicus blood serum samples K0, K1, K2, and K3 (2-D SDS-PAGE). The red circles on the left side of each 2D polyacrylamide gel indicate the location of the IEF internal standard, tropomyosin with a MW of 33 000 kDa and pI of 5.2. Protein digestion and peptide extractionProteins were separated by 2D SDS-PAGE and were then removed from the gel, cleaned, and processed in accordance with standard protocols (Aslebagh et al., 2018; Wormwood et al., 2018). The excised gel pieces were first rinsed briefly using high-purity HPLC-grade water, then dehydrated, cut into smaller segments, and destained through sequential washes in 50 mM ammonium bicarbonate, a 1:1 solution of 50 mM ammonium bicarbonate and 50% acetonitrile, followed by 100% acetonitrile, all while gently agitated and then dried using a speed vacuum concentrator. To rehydrate the dried gels, 50 mM ammonium bicarbonate was added and repeated twice. Samples were incubated at 56 °C for 45 minutes in 50 mM ammonium bicarbonate containing 10 mM dithiothreitol (DTT). Subsequently, 50 mM ammonium bicarbonate containing 100 mM iodoacetamide was added to the DTT solution and left in the dark for 45 minutes, occasionally swirling. The gel fragments were dehydrated using the same destaining solution sequence, followed by another drying step using a speed vacuum. Trypsin digestion was initiated by rehydrating the gels in 50 mM ammonium bicarbonate containing 10 ng/µl trypsin, and the samples were incubated with gentle agitation overnight at 37°C. Peptides were extracted by shaking in 100% acetonitrile once, followed by two extractions using a 5% formic acid solution: acid, 50 mM ammonium bicarbonate, and 50% acetonitrile. The combined extracts were dried using a speed vacuum and reconstituted in 20 µl of 0.1% formic acid with 2% acetonitrile. Nano LC-MS/MSThe peptide mixture was analyzed using reversed-phase nano-liquid chromatography (nano-LC) coupled with tandem mass spectrometry (LC-MS/MS), conducted with a Nano Acuity UPLC system (Micromass/Waters, Milford, MA) linked to a Q-TOF Xevo G2 mass spectrometer (Micromass/Waters, Milford, MA), following established procedures. Utilizing nano-liquid chromatography-tandem mass spectrometry (nano-LC-MS/MS) in conjunction with two-dimensional polyacrylamide gel electrophoresis (2D PAGE), we examined which proteins in the serum are dysregulated compared with the control (Lux et al., 2019). Samples were loaded onto a 100 µm × 10 mm Nano Acuity BEH130 C18 1.7 µm UPLC column (Waters, Milford, MA), and elution was performed at a constant flow rate of 400 nl/minute, applying a linear gradient from 2% to 80% acetonitrile with 0.1% formic acid (FA) over a 60-minute run. The aqueous phase comprised HPLC-grade water containing 0.1% FA. A Picotip Emitter Silicatip nanoelectrospray needle (New Objective, Woburn, MA, USA) was used to interface the column. Mass spectrometry data acquisition employed a survey scan mode, selecting the top six most intense ions with charge states of 2+, 3+, or 4+ for DDA. Fragmentation using collision-induced dissociation was triggered when ion intensities exceeded 250 counts per second, with each of the three mostintense precursor ions subjected to MS/MS analysis for up to 6 seconds or until a cumulative ion count of 10,000 was reached. The entire analytical workflow was described in detail previously (Mihăşan et al., 2018). The calibration of both precursor and product ions was performed using 1 pmol of standard GluFib peptide (Glu1-Fibrinopeptide B), which has a monoisotopic doubly charged peak at m/z 785.84, and the sequence EGVNDNEEGFFSAR. Data processing and protein identificationAfter gel electrophoresis, proteins can be identified using various methods, including (1). Protein staining: To visualize proteins, they are stained with dyes, such as Coomassie blue or silver stain (Ruyani et al., 2003). (2). Fluorescent labeling: Proteins are labeled with fluorescent tags for detection and analysis (Lukyanov, 2022). (3). Mass spectrometry: Proteins are analyzed using mass spectrometry to determine their mass-to-charge ratio and identify them (Ruyani et al, 2005). (4). Protein sequencing: Proteins are sequenced using techniques such as Edman degradation or tandem mass spectrometry (Ruyani et al., 2003). (5) Western blotting: Proteins are transferred to a membrane and detected using specific antibodies (Cruz-Walma and Collins, 2019). Protein Lynx Global Server (PLGS, version 2.4) software was used to process the raw data (Channaveerappa et al., 2017). Two smoothings using a three-channel window in Savitzky–Golay mode, background subtraction of polynomial order 5 adaptive with a 30% threshold, and centroid calculation of the top 80% of peaks based on a minimum peak width of four channels at half height were employed. The following parameters were employed to submit the resultant pol files to the in-house Mascot server (www.matrixscience.com, Matrix Science, London, UK) for database searching and protein identification: trypsin as the enzyme, three missed cleavages, propionamide as a fixed modification for cysteine, a parent mass error of 0.5 Da with 1 13C, a product ion error of 0.8 Da, and databases sourced from the NCBI (Rodents). We used other criteria, including various databases or organisms, a reduced error range for parent mass error, as follows: (1.2 and subsequently 0.2 Da), product ion error (0.6 Da), and allowed up to two missed cleavage sites for trypsin to ascertain the false negative results. Additionally, the pol files were queried using analogous search parameters as the Mascot search against the internal PLGS database version 2.4 (www.waters.com). Compilation of proteins corresponding to each gel band was acquired from Mascot and PLGS database queries. After eliminating false positive results, the MS/MS spectra were validated corresponding to a Mascot score below 25 or proteins identified by a single peptide.
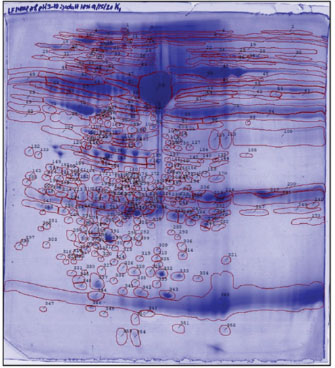
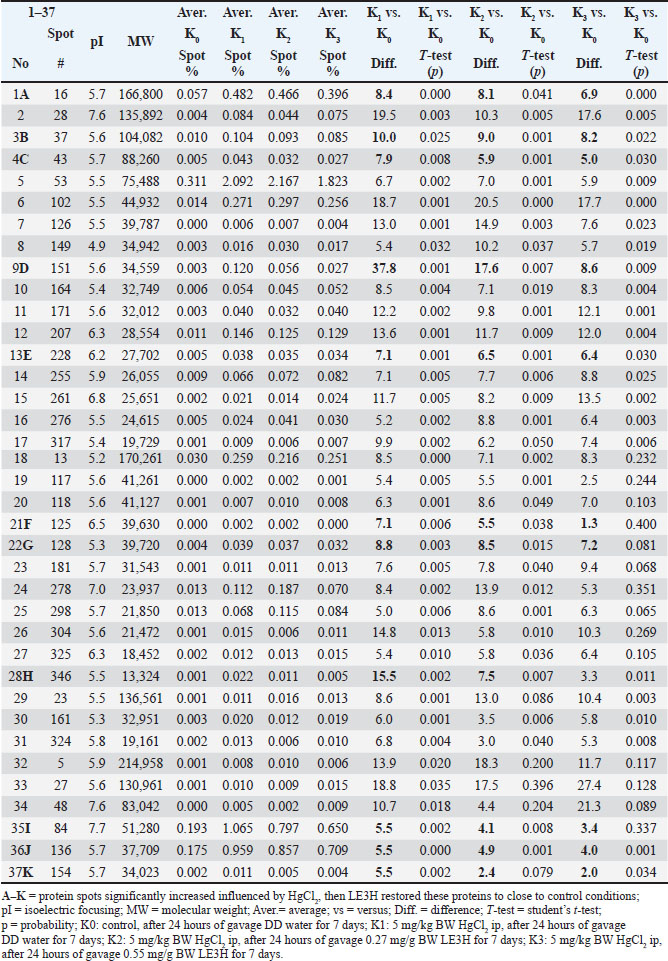
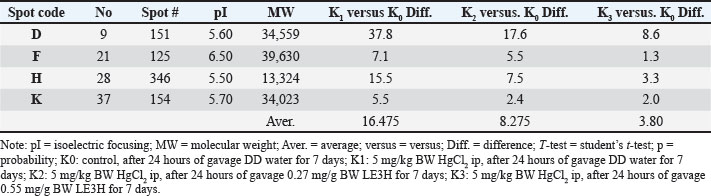
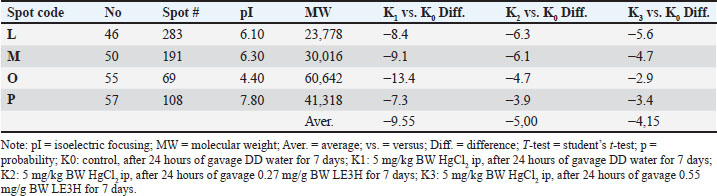
Fig. 2. The reference gel shows all spot numbers. All spot data, including pI and MW, can be found in Tables 2 and 3. Statistical analysisProtein spot intensity K0 (control, after 24 hours gavage DD water for 7 days), K1 (5 mg/kg BW HgCl2 ip, after 24 hours gavage DD water for 7 days), K2 (5 mg/kg BW HgCl2 ip, after 24 hours gavage 0.27 mg/g BW LE3H for 7 days), and K3 (5 mg/kg BW HgCl2 ip, after 24 hours gavage 0.55 mg/g BW LE3H for 7 days) (Table 1) are the main studies in this toxicoproteomics research. There are three types of protein spot intensity comparisons: (a) K1 versus K0 (K1/K0), (b) K2 versus K0 (K2/K0), and (c) K3 versus K0 (K3/K0 (Tables 2–4). Example for protein spot code D: K1/K0=37.8, K2/K0=17.6, and K3/K0=8.6 (Table 5). Example for Protein Spot code L: K1/K0=−8.4, K2/K0=−6.3, K3/K0=−5.6 (Table 6). The results of this study were extrapolated through several comparisons, leading to the determination of the least significant difference (Tables 2, 3, and 4) (Steel and Torrie, 1981). Table 2. Summary of results for 2D gel comparison of K1, K2, and K3 vs. K0. Reference spot numbering (1-37), pI, and MW are given for changing polypeptide spots analyzed in samples K1 (LF1404 #7-8), K2 (LF1404 #9-10), K3 (LF1404 #11, LF1406 #3), and K0 (LF1404 #5-6). Also shown are fold increases or decreases (difference) of the polypeptides for K1, K2, and K3 vs. K0.
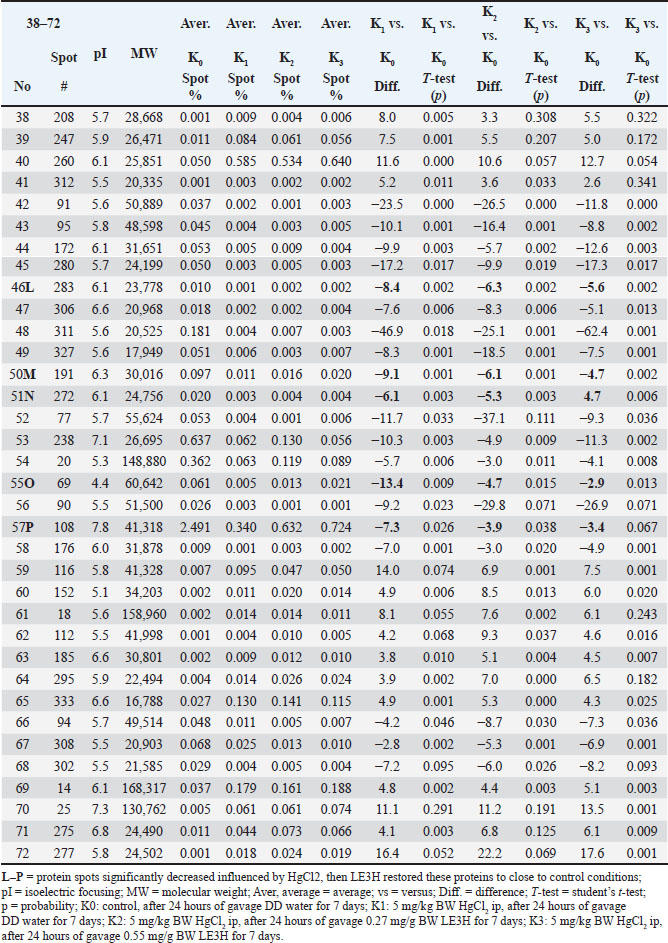
Table 3. Summary of results for 2D gel comparison of K1, K2, and K3 vs. K0. Reference spot numbering (38–72), pI, and MW are given for changing polypeptide spots analyzed in samples K1 (LF1404 #7–8), K2 (LF1404 #9–10), K3 (LF1404 #11, LF1406 #3), and K0 (LF1404 #5–6). Also shown are fold increases or decreases (difference) of the polypeptides for K1, K2, and K3 vs. K0.
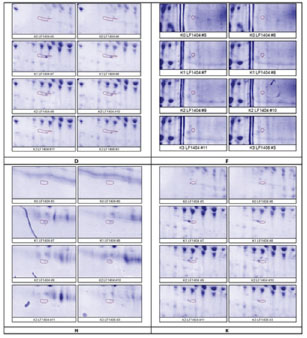
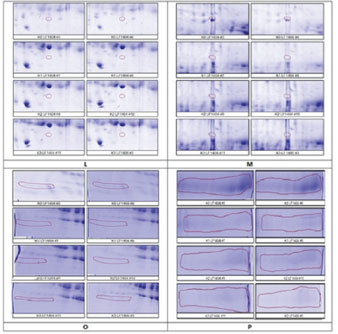
Ethical approvalThis work was conducted in compliance with the Guide for the Care and Use of Laboratory Animals of the National Institutes of Health. The implementation of the Five Freedoms was ensured, including (a) provision of adequate food and water; (b) maintenance of comfortable living conditions; (c) prevention of pain, injury, and illness; (d) minimization of fear and prolonged distress; and (e) allowance for natural behaviors, provided that appropriate space and facilities were available (Ruyani et al., 2019; Arnason, 2020). The Animal Experiment Ethics Committee at the University of Bengkulu approved the protocol (No. 107/UN30.14.9/LT/2020, March 31, 2020). ResultsTwo-dimensional sodium dodecyl sulfate-polyacrylamide gel electrophoresis (2-D SDS-PAGE) was conducted twice for each group: K0 (Control; received DD water and continued with daily oral gavage of DD water for 7 days), K1 (received 5 mg/kg BW HgCl₂ intraperitoneally, followed by DD water gavage for 7 days), K2 (received 5 mg/kg BW HgCl₂ intraperitoneally, followed by 0.27 mg/g BW LE3H gavage for 7 days), and K3 (received 5 mg/kg BW HgCl₂ intraperitoneally, followed by 0.55 mg/g BW LE3H gavage for 7 days). Figure 1 shows one of the two successful 2-D electropherogram results. Two-dimensional electropherograms successfully isolated 72 spot proteins, and each spot is numbered (Fig. 2). The proportion of spot intensity at K0, K1, K2, and K3 was successfully ascertained using a quantitative densitometer. pI, MW, and reference spot numbering (1–72) are provided for the changing polypeptide spots that were examined in samples K0 (LF1404 #5–6), K1 (LF1404 #7–8), K2 (LF1404 #9–10), and K3 (LF1404 #11, LF1406 #3). The fold increases or decreases (differences) of the polypeptides for K1, K2, and K3 compared with those for K0 are also displayed (Tables 2 and 3). The first pattern observed in the protein response to HgCl₂ exposure typically involves changes in protein expression, structure, and function. The results of this study reveal that 11 protein spots (A, B, C, D, E, F, G, H, I, J, and K) whose intensity increased due to HgCl2 treatment, but then the intensity of these protein spots decreased approaching the control condition after receiving LE3H. On the other hand, there were five protein spots (L, M, N, O, and P) whose intensity diminished as a result of HgCl2 treatment, but then the intensity of these protein spots increased approaching the control. Condition after receiving LE3H treatment (Fig. 3; Table 4). Four of the 11 protein spots (D, F, H, and K) were selected (Fig. 4; Table 5), and four of the 5 protein spots (L, M, O, and P) were assigned (Fig. 5; Table 6) to be characterized and identified. LE3H restores the negative effects of HgCl₂. This study successfully characterized and identified eight protein spots (Table 7). The eight serum protein spots with NCBI accessions, namely D [gi|37805241], F[gi|295916], H[gi|155369696; gi|60551611], K[gi|149056721], L[gi|149043886; gi|116597], M[gi|121041], O[gi|231468], and P[gi|546056; gi|6981010] are proteins that have been identified to be affected by HgCl2 treatment and can be restored by LE3H administration (Table 7). DiscussionRole of LE3HCompared with the control group, the HgCl₂-treated group showed a significant increase in serum creatinine, blood urea nitrogen, and aspartate aminotransferase levels. However, pretreatment with quercetin (QC) prior to HgCl₂ exposure significantly reduced the levels of several urinary biomarkers, including neutrophil gelatinase-associated lipocalin, clusterin, kidney injury molecule-1, monocyte chemoattractant protein-1, vascular endothelial growth factor, and tissue inhibitor of metalloproteinases 1 (Shin et al., 2015). A natural flavonoid-like QC has been recognized for its therapeutic and anti-mercurial properties (Orji et al., 2020; Mohammadi et al., 2021). These findings suggest that (a) HgCl₂ exposure alters the expression of specific proteins compared to controls; (b) both LE3H and QC share protective characteristics against mercury-induced toxicity; and (c) QC, as identified in Shin et al. (2015), is a flavonoid also present in the crude extract of LE3H as part of its secondary metabolites (Ruyani et al., 2019). The concentration of QC in LE3H has been measured at 7.47 ± 0.2 µg/ml, as confirmed by recent studies (Riyanti et al., 2022). Moreover, in mice administered with 5 mg/kg BW HgCl₂, urea and creatinine levels were significantly increased compared with controls. However, treatment with the fruit ethanolic extract of E. hemisphaerica (FE3H) at doses of 0.52 and 0.65 mg/g BW effectively restored both urea and creatinine concentrations to near-control levels. FE3H has been reported to contain 98.92 ± 12.88 µg/g of QC. The high flavonoid content, particularly QC, in FE3H is believed to reduce uremia by 29.04%–33.06% and hypercreatininemia by 49.52%–54.28% in mice (Ruyani et al., 2024).
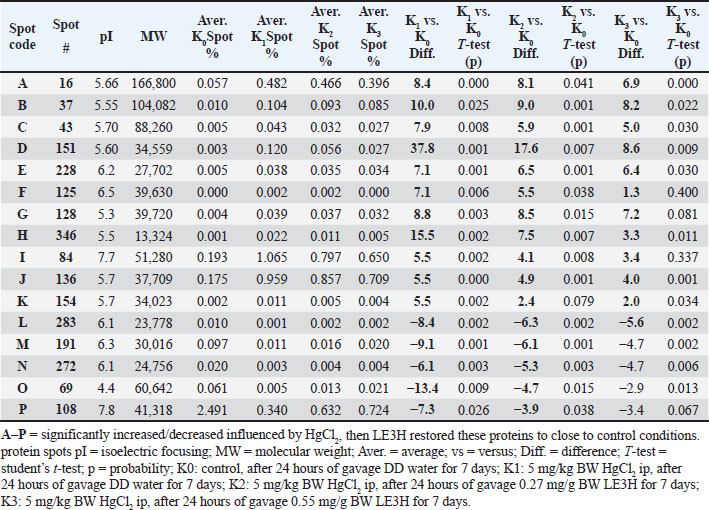
Figure 3. Sixteen initial protein spots selection (A, B, C, D, E, F, G, H, I, J, K, L, M, N, O, and P) presence significantly increased or decreased influenced by HgCl2 treatment, and then LE3H administration returned the presence of these proteins to close to control conditions. Toxicity of HgCl₂Previous research showed that HgCl₂ injection elevated leukocyte levels while diminishing erythrocyte counts; however, following the injection of HgCl₂ with LE3H therapy, the quantity of blood cells and the control were maintained. LE3H therapy was able to maintain this protein profile in the same manner as it was in the control condition, despite the 48-kDa protein being overexpressed and a new 125-kDa protein emerging as a result of the HgCl2 treatment. Mouse blood reveals that LE3H might offer some defense against HgCl2 poisoning. For this one-dimensional blood serum protein profile, more research employing proper techniques is necessary. Therefore, those who have been exposed to HgCl2 may benefit from taking dietary supplements that include LE3H (Ruyani et al., 2019). Furthermore, four bands with measurements of 264.77, 219.53, 98.57, and 37.29 kDa were observed in the electropherograms. After treatment with HgCl2, the strength of these bands increased noticeably. When LE3H was administered, the intensity dropped to almost the control condition. In addition, four bands—31.95, 28 06, 26, 29, and 15.09 kDa—were found in the results. The HgCl2 treatment caused these bands’ intensities to rise substantially, and when LE3H was profiled closer to control conditions, they started to resemble the control state. According to Ruyani et al. (2023), the LE3H change profile of the eight blood serum protein bands caused by HgCl2 substantially represents the control condition in R. norvegicus. Following the conclusion that HgCl2 can alter the protein profile, administering LE3H may alter the protein profile to more closely resemble control conditions. A flavonoid called QC is also found in LE3H, and LE3H raises protein levels close to the control level. Table 4. K1 vs. K0, K2 vs. K0, and K3 vs. K0 of the 16 initial protein spots selection (A, B, C, D, E, F, G, H, I, J, K, L, M, N, O, and P) were significantly increased or decreased influenced by HgCl2 treatment, and then LE3H administration returned the presence of these proteins to close to control conditions.
Protein separationThe two-dimensional sodium dodecyl sulfate-polyacrylamide gel electrophoresis (2-D SDS-PAGE) technique applied in this research effectively resolved the rat serum proteins into a total of 72 distinct spots, as presented in Figure 1, Figure 2, Table 2, and Table 3. Each spot with MW and isoelectric focusing (pI) is thought to describe one protein with a specific function. The protein spots in the control group (K0) are standard under normal conditions. The impact of HgCl2 on protein spot intensity expression is represented by the ratio of K1 to K0 (K1 vs. K0), while the recovery effect of 0.27 mg/g BW LE3H on mercury toxicity is represented by the ratio of K2 to K0 (K2 vs. K0). The dose of 0.55 mg/g BW LE3H on mercury toxicity is the ratio of K3 to K0 (K3 vs. K0). There are two interesting protein profile patterns in K1versusK0, K2versusK0, and K3versusK0 in this study: (1) HgCl2 treatment increases the intensity of real protein spots more than the control; then, administration of two doses of LE3H decreases the intensity of protein spots approaching control conditions (Fig. 3; Table 4; spot codes A, B, C, D, E, F, G, H, I, J, and K); and (2) HgCl2 treatment decreases the intensity of real protein spots less than the control; then, administration of two doses of LE3H increases the intensity of protein spots approaching control conditions (Fig. 3; Table 4; spot codes L, M, N, O, and P). Proteins whose expression rises or falls in response to HgCl₂ and then returns to levels around the control because of LE3H.
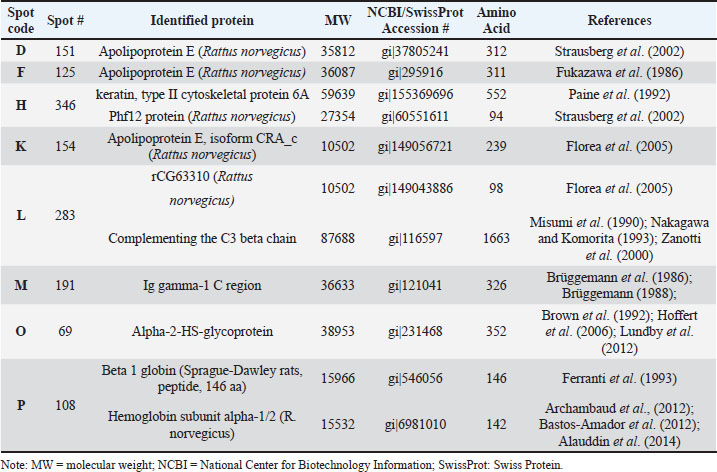
Figure 4. Four selected protein spots (D, F, H, and K) presence significantly increased influenced by HgCl2 treatment, and then LE3H administration returned the presence of these proteins to close to control conditions. The red circles indicate the selected protein spots. Identified proteinIn this study, four of the 11 protein spots (D, F, H, and K) were selected (Fig. 4; Table 5), and four of the 5 protein spots (L, M, O, and P) were assigned (Fig. 5; Table 6) to be characterized and identified. This study successfully characterized and identified eight protein spots. The eight serum protein spots with NCBI Accessions, namely D [gi|37805241; apolipoprotein E (R. norvegicus), Strausberg et al., 2002], F[gi|295916; apolipoprotein E (R. norvegicus), Fukazawa et al., 1986], H[gi|155369696; keratin, type II cytoskeletal 6A, Paine et al., 1992; gi|60551611, Phf12 protein (R. norvegicus), Strausberg et al., 2002], K[gi|149056721, Apolipoprotein E, isoform CRA_c (R. norvegicus), Florea et al., 2005], L[gi|149043886, rCG63310 (R. norvegicus), Florea et al., 2005; gi|116597, Complement C3 beta chain, Nakagawa and Komorita, 1993, Misumi et al., 1990, Zanotti et al., 2000], M[gi|121041, Ig gamma-1 chain C region, 351 Brüggemann et al., 1986; Brüggemann, 1988], O[gi|231468, Alpha-2-HS-glycoprotein, Brown et al., 1992, Hoffert et al., 2006, Lundby et al., 2012], and P[gi|546056; Beta 1 globin [rats, Sprague-Dawley, Peptide, 146 aa, Ferranti et al., 1993; gi|6981010, Hemoglobin subunit alpha-1/2 (R. norvegicus), Archambaud et al., 2012, Bastos-Amador et al., 2012; Alauddin et al., 2014] are proteins that have been identified as affected by HgCl2 treatment and can be restored by LE3H administration (Table 7). Elevated LE3H dosages will bring HgCl₂-sensitive proteins closer to control levels.
Figure 5. Four selected protein spots (L, M, O, and P) presence significantly decreased influenced by HgCl2 treatment, and then LE3H administration returned the presence of these proteins to close to control conditions. The red circles indicate the selected protein spots. Table 5. K1 versus K0, K2 versus K0, and K3 versus K0 of the four protein spots (L, M, O, and P) for protein identification in accordance with the experimental hypothesis.
Table 6. K1 versus K0, K2 versus K0, and K3 versus K0 of the four protein spots (L, M, O, and P) for protein identification in accordance with the experimental hypothesis.
Table 7. Results of identifications of eight selected protein spots, National Center for Biotechnology Information (NCBI; https://pubmed.ncbi.nlm.nih.gov), or Swiss Protein (SwissProt; https://www.expasy.org/resources/uniprotkb-swiss-prot) Accession, Amino acid, and Related references.
Address limitationsThe eight serum protein spots (D, F, H, K, L, M, O, and P) obtained from this toxicoproteomics research should be further verified with antibodies using western blotting (Ruyani et al., 2003; Ruyani et al, 2005; Cruz-Walma and Collins, 2019). Western blotting is a scientific technique used to identify and examine proteins in a sample. It is sometimes referred to as immunoblotting or protein blotting. ConclusionMercury chloride (HgCl2) increased the intensity of four serum protein spots—D [gi|37805241, Apolipoprotein E (R. norvegicus)], F [gi|295916, Apolipoprotein E (R. norvegicus)], H [gi|155369696, keratin, type II cytoskeletal 6A; gi|60551611, Phf12 protein (R. norvegicus)], and K [gi|149056721, Apolipoprotein E, isoform CRA_c (R. norvegicus)]—intensity increased before, leaf ethanolic extract of Etlingera hemisphaerica (LE3H) caused the protein profiles to drop to almost control levels. On the other hand, the four serum protein spots are L [gi|149043886, rCG63310 (R. norvegicus); gi|116597, Hemoglobin subunit alpha-1/2 (R. norvegicus)], M [gi|121041, Ig gamma-1 chain C region], O [gi|231468, Alpha-2-HS-glycoprotein], and P [gi|546056, Beta 1 globin (rats, Sprague-Dawley, Peptide, 146 aa); gi|6981010, Hemoglobin subunit alpha-1/2 (R. norvegicus)]. These spots were reduced in intensity as a result of HgCl2, and subsequently LE3H caused the protein profiles to rise toward control levels. LE3H may serve as a potential herbal agent to mitigate mercury-induced systemic toxicity via the modulation of serum protein expression. AcknowledgmentsThe Directorate General of Higher Education, Government of the Republic of Indonesia, supported this research under “Hibah Penelitian Dasar 2019”. The authors would like to thank Dr. Bhakti Karyadi (Department of Biological Education, Bengkulu University, Indonesia), Kendrick Laboratories Inc (1202 Ann St., Medison WI 53713, USA), Dr. Costel Darie (Department of Chemistry and Biomolecule, Clarkson University, 8Clarkson Avenue, Box 5810, Potsdam, NY 13699, USA) for the esteemed suggestions in conducting the study, Nurus Sa’adiyah for the statistical examination, and Shafira R. Ruyani for the grammatical advice in writing this work. Conflict of interestThe authors reported that they have no conflicts of interest. FundingThis study was supported by the Republic of Indonesian Government’s Directorate General of Higher Education’s “Hibah Penelitian Dasar 2019” (Nomor 779/U30.15/LT/2019). Authors’ contributionsThe final draft of the manuscript has been read, examined, and approved by all authors. AR: a research idea creator, a research funding receiver, a publishing paper finalizer, and a corresponding author; DP, DS, and ZFR: E. hemisphaerica leaf ethanolic extract (LE3H) production, experimental animal research, and data gathering; ATR and DRAM: Statistical tests for generalization; DP and ADS: Research project manager and report writer. Data availabilityThe data underpinning this study’s conclusions are not publicly available due to sensitivity issues, but may be acquired from the corresponding author upon a fair request. ReferencesAlauddin, H., Jaapar, N.A., Azma, R.Z., Ithnin, A., Razak, N.F.A., Loh, C.K., Alias, H., Abdul-Latiff, Z. and Othman, A. 2014. A case series of α-thalassemia intermedia due to compound heterozygosity for Hb Adana HBA2: c179Gu003eA (or HBA1); p. Gly60Asp with other α-thalassemias in Malay families. Case Rep. Hemoglobin. 38(4), 277–281; doi:10.3109/03630269.2014.916720 American Veterinary Medical Association. (2013). AVMA–Guidelines for the euthanasia of animals: 2013 Edition. Illinois, IL: American Veterinary Medical Association, p: 4.8 Anderson, N.L., Matheson, A.D. and Steiner, S. 2000. Proteomics: application in basic and applied biology. Curr. Appl. Biol. 11(00), 408–412. Archambaud, C., Nahori, M.N., Soubigou, G., Bécavin, C., Laval, L., Lechat, P., Smokvina, T., Langella, P., Lecuit, M. and Cossart, P. 2012. Effect of lactobacilli on orally acquired listeriosis. Proc. Natl. Acad. Sci. U. S. A. 109(41), 16684–16169; doi:10.1073/pnas.1212809109 Arnason, G. 2020. The emergence and development of animal research ethics: a review with a focus on nonhuman primates. Sci. Eng. Eth. 26, 2277–2293; doi:10.1007/s11948-020-00219-z Aslebagh, R., Channaveerappa, D., Arcaro, K.F. and Darie, C.C. 2018. Comparative two‐dimensional polyacrylamide gel electrophoresis (2D‐PAGE) of human milk to identify dysregulated proteins in breast cancer. Electrophoresis 39, 1723–1734. Bastos-Amador, P., Royo, F., Gonzalez, E., Conde-Vancells, J., Palomo-Diez, L., Borras, F.E. and Falcon-Perez, J.M. 2012. Proteomic analysis of microvesicles from plasma of healthy donors reveals high individual variability. J. Proteomics. 2012;75(12):3574–3584; doi:10.1016/j.jprot.2012.03.054 Beasley, D.M., Schep, L.J., Slaughter, R.J., Temple, W.A. and Michel, J.M. 2014. Full recovery from a potentially lethal dose of MC. Med. Toxicol. 10, 40–44. Brown, W.M., Christie, D.L., Dziegielewska, K.M., Saunders, N.R. and Yang, F. 1992. The rat protein encoded by clone pp63 is a fetuin/albha 2-HS glycoprotein-like molecule, but is it the tyrosine kinase inhibitor pp63? Comparative Study Cell. 68(1), 7–8; doi:10.1016/0092-8674(92)90200-v Brüggemann, M. 1988. Evolution of the rat immunoglobulin gamma heavy-chain gene family. Comparative Study Gene. 74(2), 473–482; doi:10.1016/0378-1119(88)90180-1 Brüggemann, M., Free, J., Diamond, A., Howard, J., Cobbold, S. and Waldmann, H. 1986. Immunoglobulin heavy chain locus of the rat: striking homology to mouse antibody genes Comparative Study. Proc. Natl. Acad. Sci. U. S. A. 83(16), 6075–6079; doi:10.1073/pnas.83.16.6075 Camacho, L.F., Silva, T.E., Palma, M.N.N., Assunção, A.S., Rodrigues, J.P., Silva, L.F.C.E. and Detmann, E. 2019. J. Anim. Sci. 97(2), 922–931; doi:10.1093/jas/sky464 Channaveerappa, D., Lux, J.C., Wormwood, K.L., Heintz, T.A., McLerie, M., Treat, J.A., King, H., Alnasser, D., Goodrow, R.J., Ballard, G., Decker, R., Darie, C.C. and Panama, B.K. 2017. Atrial electrophysiological and molecular remodeling induced by obstructive sleep apnea. J. Cell. Mol. Med. 21(9), 2223–2235; doi:10.1111/jcmm.13145 Cruz-Walma, D.A. and Collins, J.W. 2019. Western blotting with solutions containing nanoliter antibody volumes. Curr. Protoc. Cell Biol. 84(1), e87; doi:10.1002/cpcb.87 Curle, D.C., Ray, M. and Persaud, T.V. 1987. Evaluation of teratogenesis and cytogenetic changes following methylmercuric chloride treatment. Anat. Rec. 219, 286–295; doi:10.1002/ar.1092190309 Ferranti, P., Carbone, V., Sannolo, N., Fiume, I. and Malorni, A. 1993. Mass spectrometric analysis of rat hemoglobin using FAB-overlapping The primary structure of the alpha-major and four beta constitutive chains. Int. J. Biochem. 25(12), 1943–1950; doi:10.1016/0020-711x(88)90329-1 Florea, L., Francesco, VD., Miller, J., Turner, R., Yao, A., Harris, M., Walenz, B., Mobarry, C., Merkulov, GV., Charlab, R., Dew, I., Deng, Z., Istrail, S., Li, P. and Sutton, G. 2005. Gene and alternative splicing annotation with AIR. Genome Res. 15(1), 54–66; doi:10.1101/gr.2889405 Fukazawa, C., Matsumoto, A. and Taylor, JM. 1986. Complete nucleotide sequence of the gene encoding the rat apolipoprotein E. Nucleic Acids Res. 14(23), 9527–9528; doi:10.1093/nar/14.23.9527 Guttman, A., Filep, C. and Karger, B.L. 2021. Fundamentals of capillary electrophoretic migration and separation of SDS proteins in borate cross-linked dextran gels. Anal. Chem. 93(26), 9267–9276; doi:10.1021/acs.analchem.1c01636 Hoffert, J.D., Pisitkun, T., Wang, G., Shen, R.F. and Knepper, M.A. 2006. Quantitative phosphoproteomics of vasopressin-sensitive renal cells: regulation of aquaporin-2 phosphorylation at two sites. Proc. Natl. Acad. Sci. U. S. A. 103(18), 7159–7164; doi:10.1073/pnas.0600895103 Lukyanov, K. 2022. Fluorescent proteins for brighter science. Biochem. Biophysical Res. Commun. 633, 29–23; doi:10.1016/j.bbrc.2022.08.089 Lundby, A., Secher, A., Lage, K., Nordsborg, N.B., Dmytriyev, A., Lundby, C. and Olsen, J.V. 2012. Quantitative maps of protein phosphorylation sites across 14 different organs and tissues of rats. Nat. Commun. 3, 876; doi:10.1038/ncomms1871 Lux, J.C., Channaveerappa, D., Aslebagh, R., Heintz, T.A., McLerie, M., Panama, B.K. and Darie, C.C. 2019. Identification of dysregulation of atrial proteins in rats with chronic obstructive apnea using two‐dimensional polyacrylamide gel electrophoresis and mass spectrometry. J. Cell. Mol. Med. 23(4), 3016–3020; doi:10.1111/jcmm.14131 Mihăşan, M., Babii, C., Aslebagh, R., Channaveerappa, D., Dupree, E. and Darie, C.C. 2018. Proteomics-based analysis of nicotine catabolism in P. nicotinovorans pAO1. Sci. Rep. 8(1), 16239; doi:10.1038/s41598-018-34687-y Misumi, Y., Sohda, M. and Ikehara, Y. 1990. Nucleotide and deduced amino acid sequence of rat complement C3. Nucleic Acids Res. 18(8), 2178; doi:10.1093/nar/18.8.2178 Mohammadi, S., Pourakbar, L., Moghaddam, S.S. and Popović-Djordjević, J. 2021. The effect of EDTA and citric acid on biochemical processes and changes in phenolic compounds profile of okra (Abelmoschus esculentus L.) under mercury stress. Ecotoxicol. Environ. Saf. 208, 111607; doi:10.1016/j.ecoenv.2020.111607 Nair, A.B. and Jacob, S. 2016. Simple practice guide for dose conversion between animals and humans. J. Basic Clin. Pharma. 7, 27–31; doi:10.4103/0976-0105.177703 Nakagawa, H. and Komorita, N. 1993. C3-derived neutrophil chemotactic factors purified from the exudate of rat carrageenin-induced inflammation. Biochem. Biophys. Res. Commun. 194(3), 1181–1187; doi:10.1006/bbrc.1993.1947 Nowakowski, A.B., Wobig, W.J. and Petering, D.H. 2014. Native sodium dodecyl sulfate-polyacrylamide gel electrophoresis: high-resolution electrophoretic separation of proteins with retention of native properties including bound metal ions. Metallomics 6(5), 1068–1078; doi:10.1039/c4mt00033a Oakley, B.R., Kirsch, D.R. and Morris, N.R. 1980. A simplified ultrasensitive silver stain for detecting proteins in polyacrylamide gels. Anal. Biochem. 105(80), 361–363; doi:10.1016/0003-2697(80)90470-4 Olivero-Verbel, J., Alvarez-Ortega, N., Alcala-Orozco, M. and Caballero-Gallardo, K. 2021. Population exposure to Pb and mercury in Latin America. Curr. Opinion Toxicol. 27, 27–37. Orji, O.U., Awoke, J.N., Harbor, C., Igwenyi, I.O., Obasi, O.D., Ezeani, N.N. and Aloke, C. 2020. Ethanol leaf extract of Psychotria microphylla rich in quercetin restores heavy metal induced redox imbalance in rats. Heliyon 6, e04999; doi:10.1016/j.heliyon.2020.e04999 Paine, M.L., Gibbins, J.R., Chew, K.E., Demetriou, A. and Kefford, R.F. 1992. Loss of keratin expression in anaplastic carcinoma cells due to posttranscriptional down-regulation acting in trans. Cancer Res. 52(23), 6603–6611. Riyanti, S., Windyaswari, A.S., Syam, A.K., Karlina, Y., Anjelista, D., Faramayuda, F., Aulia N. and Ratnawati J. 2022. Phytochemical content and antioxidant activity of forest hone leaf (Etlingera hemisphaerica (Blume) R.M. Sm). IOP Conf. Ser.: Earth Environ. Sci. 1104, 012022; doi: 10.1088/1755-1315/1104/1/012022 Ruyani, A., Sudarwati, S., Sutasurya, L.A., Sumarsono, S.H. and Gloe, T. 2003. The laminin binding protein p40 is involved in inducing limb abnormality of mouse fetuses as the effects of methoxyacetic acid treatment. Toxicol. Sci. 75, 148–153; doi:10.1002/bdra.20146 Ruyani, A., Kadir, A. and Yulson, D. 1997. Analisis tingkat toksisitas merkuri pada penambang emas rakyat (tanpa izin) di kawasan Taman Nasional Kerinci Seblat (TNKS). Jurnal Kedokteran dan Farmakologi 11, 883–887. Ruyani, A., Kartika, E., Putra, R.J., Parlindungan, D., Sundaryono, A. and Susanta, A. 2021. Leaf ethanolic extract of Etlingera hemisphaerica Blume mitigates defects in fetal anatomy and endochondral ossification due to mercuric chloride during the post-implantation period in Mus musculus. PLoS One 16(3), 247467; doi:10.1371/journal.pone.0247467 Ruyani, A., Muthmainnah, D., Putri, R.Z.E., Yulisa, T. and Sundaryono, A. 2017. Hepatoprotective effect of the leaf ethanolic extract of E. hemisphaerica Blume on recovery of mercuric chloride toxicity in mice Prosid. Banda Aceh, Indonesia: Program Pascasajana Universitas Syiah Kuala, pp 136–147. Ruyani, A., Parlindungan, D., Kartika, E., Putra RJ. Sundaryono A. and Susanta, A. 2020. Ethanolic leaf extract of Etlingera hemisphaerica Blume alters mercuric chloride teratogenicity in Mus musculus during the postimplantation period. Toxicol. Res. 36, 131–138; doi:10.1007/s43188-019-00010-8 Ruyani, A., Parlindungan, D., Samitra, D., Rozi, Z.F., Fauziah, U.M., Umar, L.A. and Sari, K. 2023. Etlingera hemisphaerica alters the one-dimensional profile of serum proteins due to mercury chloride in rats (Rattus norvegicus). Pak. J. Biol. Sci. 26, 482–492; doi:10.3923/pjbs.2023.482.492 Ruyani, A., Rendi Zulni Eka Putri, R.Z.E., Jundara, P., Gresinta, E., Ansori, I. and Sundaryono, A. 2018. Protective effect of leaf ethanolic extract Etlingera hemisphaerica blume against mercuric chloride toxicity in blood of mice. J. Diet. Suppl. 16(1), 51–65; doi:10.1080/19390211.2018.1429516 Ruyani, A., Sinta, B.D., Emilia., Zulfikar, F. Anansyah, S.R. Sundaryono. and Putriand, A. 2019. Preliminary studies on therapeutic effect of ethanolic extract of Tylophora villosa leaves against paracetamol-induced hepatotoxicity in mice. J. Tradit. Complementary Med. 4(4), 285–296. Ruyani, A., Sudarwati, S., Sutasurya, L.A., Sumarsono, S.H., Kim, D.J. and Chung, J.H. 2005. A teratoproteomics analysis: heat shock protein 70 is upregulated in mouse forelimb bud by methoxyacetic acid treatment. Birth Defects Res. A. Clin. Mol. Teratol. 73, 517–521; doi:10.1093/toxsci/kfg159 Ruyani, A., Sundaryono, A., Rozi, Z.F., Samitra, D. and Gresinta, E. 2014. Potential assessment of leaf ethanolic extract honje (Etlingera hemisphaerica) in regulating glucose and TG levels in mice (Mus musculus). Int. J. Sci. 1, 70–76. Ruyani, A., Suswati, E., Pratiwi, D.P., Elvia, R., Oktoviani, O. and Parlindungan, D. 2024. The potential of fruit ethanolic extract Etlingera hemisphaerica as a solution for hyperglycemia, uremia, and hypercreatininemia in mice (Mus musculus). Open Vet. J. 14(12), 3296–3308; doi:10.5455/OVJ.2024.v14.i12.14 Sanders, A.P., Flood, K., Chiang, S., Herring, A.H., Wolf, L. and Fry, R.C. 2012. Toward prenatal biomonitoring in North Carolina: assessing arsenic, cadmium, mercury, and lead levels in pregnant women: a systematic review. PLoS One 7, 31354. Sarto, C., Frutiger, S., Cappelano, F., Sanchez, J.C., Dono, G., Catanzaro, F., Hughes, G.J., Hochstrasser, D.F. and Mocarelli, P. 1999. Modified expression of plasma glutathione peroxidase and manganese superoxidase dismutase in human renal cell carcinoma. Electrophoresis 20(19991101), 3458–3466. Shin, Y.J., Kim, J.J., Kim, Y.J., Kim, W.H., Park, E.Y. and et al. 2015. Protective effects of quercetin against HgCl-induced nephrotoxicity in Sprague-Dawley rats. J. Med. Food 18, 524–534. Smith, P.K., Krohn, R.I., Hermanson, G.T., Mallia, A.K., Gartner, F.H., Fruvenzano, M.D., Fujimoto, E.K., Goeke, N.M., Olson, B.J. and Klenk, C. 1985. Protein measurement using bicinchoninic acid. Anal. Biochem. 19, 76–85. Sopi, R.B. and Khan, M.F.H. 2013. Bronchodilatory effect of ethanolic extract of the leaves of N. bortristis. Pharmacognosy Res. 5(3), 169–172; doi:10.4103/09748490.112422 Steel RGD, Torrie JH. (1981). The principles and procedures of statistics. A Biometrical Approach. Singapura: Mc Graw-Hill International Book Company. Strausberg, R.L., Feingold, E.A., Grouse, L.H., Derge, J.G. and Klausner, R.D. 2002. Generation and initial analysis of > 15,000 full-length human and mouse cDNA sequences. Proc. Natl. Acad. Sci. U. S. A. 99(26), 16899–16903; doi:10.1073/pnas.242603899 Sun, B., Fan, S., Yao, K., Li, Y. and Huang, X. 2018. Changes in intraepidermal nerve fiber and Langerhans cell densities in the plantar skin of rats after mercuric chloride exposure. J. Peripher. Nerv. Syst. 23, 17–22. Syed, V. and Hecht, N.B. 1998. Rat pachytene spermatocytes down-regulate a polo-like kinase and up-regulate a thiol-specific antioxidant protein, whereas sertoli cells down-regulate a phosphodiesterase and up-regulate an oxidative stress protein after exposure to methoxyethanol and methoxyacetic acid. Endocrinology 139(8), 3503–3511; doi:10.1210/endo.139.8.6123 Turner, P.C., McLennan, A.G., Bates, A.D. and White, M.R.H. 1997. Instant notes in molecular biology. Liverpool: Bios Scientific Publisher, pp: 235–60. Wormwood, K.L., Wetie, A.G.N., Gomez, M.V., Ju, Y., Kowalski, P., Mihasan, M. and Darie, C.C. 2018. Structural Characterization and Disulfide Assignment of Spider Peptide Phα1β by Mass Spectrometry. J. Am. Soc. Mass Spectrom. 29(5), 827–841; doi:10.1007/s13361-018-1904-3 Zanotti, G., Bassetto, A., Battistutta, A.R., Folli, C., Arcidiaco, P., Stoppini, M. and Berni, R. 2000. Structure at 1.44 resolution of an N-terminally truncated form of the rat serum complement C3d fragment. Biochim. Biophys. Acta. 1478(2), 232–238; doi:10.1016/s0167-4838(00)00040-6 | ||
| How to Cite this Article |
| Pubmed Style Ruyani A, Parlindungan D, Samitra D, Rozi ZF, Tualeka AR, Muhammad DRA, Susanti AD. Etlingera hemisphaerica modulates mercury chloride-induced alterations in Rattus norvegicus serum proteins. Open Vet. J.. 2025; 15(9): 4601-4616. doi:10.5455/OVJ.2025.v15.i9.66 Web Style Ruyani A, Parlindungan D, Samitra D, Rozi ZF, Tualeka AR, Muhammad DRA, Susanti AD. Etlingera hemisphaerica modulates mercury chloride-induced alterations in Rattus norvegicus serum proteins. https://www.openveterinaryjournal.com/?mno=249661 [Access: January 25, 2026]. doi:10.5455/OVJ.2025.v15.i9.66 AMA (American Medical Association) Style Ruyani A, Parlindungan D, Samitra D, Rozi ZF, Tualeka AR, Muhammad DRA, Susanti AD. Etlingera hemisphaerica modulates mercury chloride-induced alterations in Rattus norvegicus serum proteins. Open Vet. J.. 2025; 15(9): 4601-4616. doi:10.5455/OVJ.2025.v15.i9.66 Vancouver/ICMJE Style Ruyani A, Parlindungan D, Samitra D, Rozi ZF, Tualeka AR, Muhammad DRA, Susanti AD. Etlingera hemisphaerica modulates mercury chloride-induced alterations in Rattus norvegicus serum proteins. Open Vet. J.. (2025), [cited January 25, 2026]; 15(9): 4601-4616. doi:10.5455/OVJ.2025.v15.i9.66 Harvard Style Ruyani, A., Parlindungan, . D., Samitra, . D., Rozi, . Z. F., Tualeka, . A. R., Muhammad, . D. R. A. & Susanti, . A. D. (2025) Etlingera hemisphaerica modulates mercury chloride-induced alterations in Rattus norvegicus serum proteins. Open Vet. J., 15 (9), 4601-4616. doi:10.5455/OVJ.2025.v15.i9.66 Turabian Style Ruyani, Aceng, Deni Parlindungan, Dian Samitra, Ziko Fahrur Rozi, Abdul Rohim Tualeka, Dimas Rahadian Aji Muhammad, and Ari Diana Susanti. 2025. Etlingera hemisphaerica modulates mercury chloride-induced alterations in Rattus norvegicus serum proteins. Open Veterinary Journal, 15 (9), 4601-4616. doi:10.5455/OVJ.2025.v15.i9.66 Chicago Style Ruyani, Aceng, Deni Parlindungan, Dian Samitra, Ziko Fahrur Rozi, Abdul Rohim Tualeka, Dimas Rahadian Aji Muhammad, and Ari Diana Susanti. "Etlingera hemisphaerica modulates mercury chloride-induced alterations in Rattus norvegicus serum proteins." Open Veterinary Journal 15 (2025), 4601-4616. doi:10.5455/OVJ.2025.v15.i9.66 MLA (The Modern Language Association) Style Ruyani, Aceng, Deni Parlindungan, Dian Samitra, Ziko Fahrur Rozi, Abdul Rohim Tualeka, Dimas Rahadian Aji Muhammad, and Ari Diana Susanti. "Etlingera hemisphaerica modulates mercury chloride-induced alterations in Rattus norvegicus serum proteins." Open Veterinary Journal 15.9 (2025), 4601-4616. Print. doi:10.5455/OVJ.2025.v15.i9.66 APA (American Psychological Association) Style Ruyani, A., Parlindungan, . D., Samitra, . D., Rozi, . Z. F., Tualeka, . A. R., Muhammad, . D. R. A. & Susanti, . A. D. (2025) Etlingera hemisphaerica modulates mercury chloride-induced alterations in Rattus norvegicus serum proteins. Open Veterinary Journal, 15 (9), 4601-4616. doi:10.5455/OVJ.2025.v15.i9.66 |

