| Review Article | ||
Open Vet. J.. 2025; 15(8): 3428-3438 Open Veterinary Journal, (2025), Vol. 15(8): 3428-3438 Review Article B-mode and Doppler ultrasound in the gastrointestinal evaluation of catsCarolle Vieira Muterlle Sprícigo1, José Felipe Warmling Spricigo1, Daniel Vieira Costa2, Iago Martins Oliveira2*, Wanessa Patrícia Rodrigues da Silva1, Carolina Castro Lyra da Silva1, Ana Paula Araújo Costa2 and Naida Cristina Borges31Programa de Pós-graduação em Ciência Animal, Escola de Veterinária e Zootecnia, Universidade Federal de Goiás, Goiânia, Brazil 2Escola de Ciências Médicas e da Vida, Pontifícia Universidade Católica de Goiás, Goiânia, Brazil 3Departamento de Medicina Veterinária, Escola de Veterinária e Zootecnia, Universidade Federal de Goiás, Goiânia, Brazil *Corresponding Author: Iago Martins Oliveira. Escola de Ciências Médicas e da Vida, Pontifícia Universidade Católica de Goiás, Goiânia, Brazil. Email: iago.vetufg [at] gmail.com Submitted: 26/02/2025 Revised: 20/06/2025 Accepted: 03/07/2025 Published: 31/08/2025 © 2025 Open Veterinary Journal
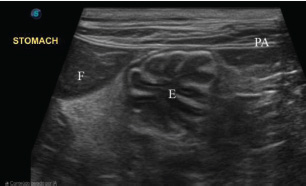
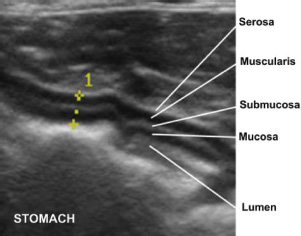
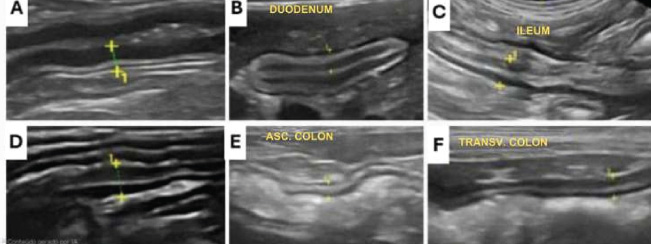
ABSTRACTUltrasound (USG) is a valuable diagnostic tool for evaluating the gastrointestinal tract of cats, providing noninvasive and dynamic information. B-mode USG allows evaluation of intestinal wall thickness, stratification, motility, and adjacent structures, such as lymph nodes and peritoneum. The stomach and intestinal segments can be differentiated based on their location, wall stratification, and relationships with surrounding organs. Normal ultrasound parameters, including gastric and intestinal wall thickness, peristaltic activity, and luminal content appearance, have been established for cats. Doppler ultrasound was used to assess vascular flow in the celiac and cranial mesenteric arteries and detect hemodynamic changes associated with gastrointestinal diseases. Alterations in flow velocity, resistivity index, and pulsatility index provide insights into vascular resistance and parenchymal function. Doppler velocimetry can also differentiate normal from pathological flow patterns, thereby aiding in the diagnosis of inflammatory, neoplastic, and ischemic conditions. Ultrasound findings of feline chronic enteropathy include wall thickening, loss of layering, and altered vascular supply. Lymphoplasmacytic enteritis and alimentary lymphoma, which are common in cats, present overlapping USG features, requiring histopathology for definitive diagnosis. Doppler alterations in the mesenteric arteries reflect gastrointestinal inflammation and ischemia, highlighting their potential as complementary diagnostic tools. Although B-mode and Doppler ultrasound are effective in identifying gastrointestinal abnormalities, further studies are needed to establish reference values and refine their clinical applications. The integration of these techniques enhances the noninvasive assessment of feline enteropathies and contributes to improved diagnosis and management. This review explores the use of B-mode and Doppler ultrasound for assessing the stomach and intestines in healthy and diseased felines. Keywords: Enteropathy, Feline, Hemodynamics, Ultrasonography, Vascularization. IntroductionFeline chronic enteropathy (FCE) is a common gastrointestinal disorder in older adult cats, and its incidence has been increasing in recent decades (Marsilio, 2021). The condition is characterized by the presence of gastrointestinal signs for more than 3 weeks, without evidence of infectious or obstructive diseases (Jergens et al., 2003; Simpson and Jergens, 2011). Anatomically, the gastrointestinal tract (GIT) consists of the mouth, esophagus, stomach, small intestine, large intestine, anus, gallbladder, liver, and pancreas (König and Liebich, 2021). The digestive system performs functions such as digestion, nutrient absorption, enzyme secretion, hydroelectrolyte reabsorption, immune function, and acts as a mechanical barrier against bacterial translocation (Jalava et al., 1998; Cunningham, 2015). The stomach and intestines of cats can be affected by inflammatory, infectious, parasitic, neoplastic, ulcerative, proliferative, and infiltrative lesions (Jalava et al., 1998; Ramos et al., 2011). The management of these diseases is challenging because of the variety of diagnostic possibilities (Ramos et al., 2011). The causes may be related to dietary indiscretion, food hypersensitivity, metabolic and endocrine diseases, foreign bodies, segmental dilations, pathogenic microorganisms, immune-mediated processes, and neoplastic processes (Nacif et al., 2004; Amorim et al., 2016). Clinical signs can be diverse, and in some animals, they can be asymptomatic, highlighting the importance of more sensitive diagnostic methods (Jalava et al., 1998). The choice of complementary tests for diagnosing GIT disorders is based on clinical suspicion, the segment affected, and the availability of available tests (Nacif et al., 2004). Radiography with a positive contrast medium is still used to assess the small intestine, but more modern techniques, such as ultrasound and computed tomography, offer greater precision (Nacif et al., 2004). Ultrasound (USG) is a modality that, when combined with other complementary tests, can help to substantiate the diagnosis. It is minimally invasive and provides information in a dynamic way, as it assesses motility, relationships with adjacent structures, and characteristics related to the wall of the stomach and intestines (Malancus and Malancus, 2017). In this context, this literature review aims to explore the B-mode and Doppler ultrasound aspects applied to the evaluation of the stomach and intestines of healthy cats and those affected by gastrointestinal diseases. Our hypothesis is that the information obtained in this review shows that B-mode and Doppler ultrasound are effective in differentiating between healthy cats and those with gastrointestinal diseases. It is assumed that, in sick cats, the most frequent ultrasound findings are structural changes in the intestinal wall, whereas Doppler evaluation of the main arteries supplying the small intestine shows changes in vascular flow because tissue inflammation is associated with hemodynamic changes. B-mode abdominal ultrasoundPerforming ultrasound examinations requires the correct positioning of the patient in relation to the operator, equipment, and transducer, ensuring consistent images and comfort for the animal and the examiner (Nautrup et al., 2000; Carvalho, 2004). Scans should be performed in the longitudinal and transverse planes (Silva et al., 2013; Griffin, 2019). Preparation of the animal is essential for image quality. Atrichotomy in the ventral region of the abdomen, from the seventh intercostal space to the inguinal region and up to the side of the transverse processes of the vertebrae, avoids artifacts caused by air trapped in the hair, ensuring intimate contact between the skin and the transducer (King, 2006). Acoustic gel and 70% isopropyl alcohol are applied to eliminate air and fat from the skin surface (Carvalho, 2004). An 8-hour food fast without water restriction is recommended to reduce the presence of gases in the gastrointestinal tract, which can interfere with the assessment (Mattoon and Nyland, 2015). Water helps form an acoustic window for better visualization (Carvalho, 2004). If necessary, antipyretics can be prescribed before the examination to reduce gas, with doses administered strategically in the hours before the procedure (Penninck et al., 1990). The positioning of the animal varies according to the examination: the dorsal decubitus position is ideal for better anatomical distribution of the organs, while the right lateral decubitus position is preferred for Doppler hemodynamic examinations of the aorta and its branches, facilitating contact with the vessels and minimizing gas interference (Nelson et al., 2010; Mattoon and Nyland, 2015). During the examination, the order of assessment usually starts with the stomach and duodenum, moving on to the intestinal segments (jejunum, ileum, cecum, ileocecocolic junction, and colon) and lymph nodes. All structures should be assessed comprehensively and systematically (Mattoon and Nyland, 2015). Chemical restraint is rarely necessary but can be used in some cases (Penninck et al., 1990; Spaulding, 1997; Garcia, 2021). Abdominal ultrasound provides dynamic and detailed information on the physiology and anatomy of the structures being assessed and is particularly useful in diagnosing gastrointestinal alterations, such as layer thickness, motility, and the condition of the lymph nodes and peritoneum (Larson and Biller, 2009; Malancus and Malancus, 2017). Despite artifacts such as reverberation and comet tail caused by gases, the examination remains widely used because it is non-invasive, painless, and informative (Larson and Biller, 2009; Silva et al., 2013). For cats, high-frequency transducers (7.5 to 10 MHz) and linear models are recommended, which offer better resolution and detail of the gastroduodenal layers (Penninck et al., 1990). Normal ultrasound appearance of the stomach and intestines in catsAll figures included in this manuscript were produced by the authors using original ultrasonographic images obtained during routine clinical evaluations of cats. The images were acquired using a SAEVO® FT422 ultrasound device coupled with a microconvex or linear transducer operating at frequencies between 7.5 and 10 MHz selected according to the body condition score of the cat being evaluated. Minor adjustments were made to the images for contrast and clarity without altering diagnostic features. The stomach is ultrasounded caudally to the liver, close to the xiphoid process, slightly to the right (Larson and Biller, 2009). The stomach is identified by its size, regular peristalsis (four to five contractions per minute), and folds in the wall that, when empty, create a characteristic “wagon wheel” appearance (Penninck et al., 1990). The gastric wall has five distinct layers: mucosa, submucosa, muscularis, serosa, and luminal surface (König and Liebich, 2021). The mucosa and muscularis are hypoechogenic, whereas the other layers are hyperechogenic (Fig. 1) (Penninck et al., 1990; Burk and Ackerman, 1996). To measure gastric thickness, it is important to avoid folds in the stomach, which can cause a false impression of enlargement due to contractions or image artifacts, and the measurement is no more than 0.29 cm (Fig. 2) (Irom et al., 2014; Griffin, 2019). Assessment includes the analysis of thickness, stratification of layers, peristaltic activity, intraluminal content, and perigastric structures, such as lymph nodes, omentum, and the presence of gas or free fluid (Larson and Biller, 2009).
Fig. 1. Ultrasound (linear transducer, 8 MHz) of the stomach of an adult cat in a cross-section. Stomach (S) with the appearance of a wagon wheel, liver (L) cranial to the stomach, and abdominal wall (AW) ventral to the stomach. Source: Personal archive, 2025.
Fig. 2. Ultrasound (linear transducer, 8 MHz) of the body of the stomach of a cat in the longitudinal section. Gastric wall (between cursors) with a thickness of 0.29 cm, preservation of stratification, slightly rough aspect. Source: Personal archive, 2025.
Fig. 3. Ultrasonography of intestinal segments in felines (linear transducer, 10 MHz) with wall thickness assessment (between the cursors). (A) Proximal duodenum measuring 0.23 cm; (B) Proximal jejunum measuring 0.20 cm; (C) Distal ileum measuring 0.30 cm; (D) Cecum measuring 0.24 cm; (E) Ileocolic junction (ICJ) measuring 0.42 cm; (F) Ascending colon measuring 0.12 cm; (G) Transverse colon measuring 0.15 cm; (H) ascending colon measuring 0.11 cm. Source: Personal archive, 2025. The duodenum is located in the right cranial abdominal quadrant between the last ribs and the abdominal wall. Evaluation of the intestinal segments involves systematic movements of the transducer, allowing sagittal, transverse, and oblique cuts (Penninck et al., 1990; Mattoon and Nyland, 2015). The ileum is located craniomedially close to the ascending colon and cecum, whereas the fasting colon occupies a large part of the abdominal cavity and requires detailed scanning for complete analysis (Goggin et al., 2000). The colon presents diagnostic challenges owing to the variable consistency of its intraluminal content. In its transverse segment, it is located caudally to the stomach and duodenum, while the descending colon is visualized dorsally to the urinary vesicle (Di Donato et al., 2014; Winter et al., 2014). The wall of the intestine also has five layers: lumen-mucosa interface (hyperechogenic), mucosa (hypoechogenic), submucosa (hyperechogenic), muscularis (hypoechogenic), and serosa (hyperechogenic) (Griffin, 2019). The degree of filling and distension can affect the wall measurements, where there should be no dilation in loops and wall thickness between the luminal interface and the serosa of 0.24–0.27 cm in the duodenum and jejunum, 0.23–0.36 cm in the ileum, 0.29–40 cm in the cecum, and colon up to 0.25 cm (Griffin, 2019), as illustrated in Figure 3. Intestinal motility is assessed by the number of peristaltic waves, with a reference of three to five movements per minute (Husnik and Gaschen, 2021). The small intestine is assessed under different filling conditions, such as gas, liquid, or solid material. The ultrasound appearance varies according to the content, usually filled with little content of a mucous pattern with a hyperechogenic nucleus surrounded by a hypoechogenic halo (Mattoon and Nyland, 2015; Garcia, 2021). Ultrasound alterations of the stomach and intestines of catsGastritis is characterized by stomach inflammation and can be associated with dietary, autoimmune, infection, poisoning, and idiopathic causes. Ultrasound revealed diffuse or focal thickening of the gastric wall (Fig. 4), loss of layering, and peripheral lymphadenopathy (Husnik and Gaschen, 2021). However, these changes are not specific and do not accurately distinguish between inflammation and neoplasia (Marsilio, 2021; Angelou et al., 2023). Gastrointestinal ulcers can be identified as focal thickening with interruption of the mucosal layer, associated with hyperechogenic spots representing clots or gas (Irom et al., 2014). Changes such as perforations, hemorrhages, and obstructions can be observed, but direct detection of erosion and ulcers requires high-resolution equipment and experienced professionals. Gastroscopy remains the most sensitive and specific diagnostic method (Gaschen et al., 2008; Angelou et al., 2023). Thickening of the intestinal wall is frequently observed in enteritis and can be diffuse or localized (Fig. 5). Intestinal edema occurs in conditions such as hypoalbuminemia, right-sided congestive heart failure vasculopathies. In generalized enteritis, mild thickening is observed (1–2 mm more than normal) with preservation of the stratification (Gaschen, 2011; Griffin, 2019). Chronic, neoplastic, and infiltrative changesFeline chronic enteropathy is common in older adult cats, characterized by persistent gastrointestinal signs (over 3 weeks) without evidence of infectious or obstructive disease (Rissetto et al., 2011; Marsilio, 2021). The main differential diagnoses were lymphoplasmacytic enteritis and lymphocytic alimentary lymphoma. The differential diagnosis between small cell lymphoma and chronic inflammatory enteropathy requires biopsy, which is often complemented by immunohistochemistry and clonality tests because of the coexistence of inflammatory and neoplastic lesions (Barrs and Beatty, 2012; Jergens, 2012; Moore, et al., 2012).
Fig. 4. Gastric ultrasonography in a longitudinal section of a feline (microconvex transducer, 8 MHz). (A) Gastric wall thickness between the cursors measuring 0.62 cm and (B) 0.53 cm. Both thickened. Source: Personal archive, 2025.
Fig. 5. Abdominal ultrasonography in felines (linear transducer, 10 MHz) in a longitudinal section with wall thickness assessment (between cursors). (A) Duodenum measuring 0.29 cm; (B) Duodenum measuring 0.30 cm; (C) Ileum measuring 0.55 cm; (D) Jejunum measuring 0.41 cm; (E) Ascending colon measuring 0.24 cm; (F) Transverse colon measuring 0.29 cm. Source: Personal archive, 2025. Table 1. Schematic relationship between ultrasound patterns of the intestinal wall in cats and suggested diagnosis.
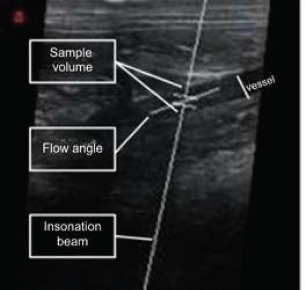
Gastrointestinal neoplasms are most frequently represented by lymphoma, followed by adenocarcinomas, mastocytoma, and gastrointestinal stromal tumors (Gieger, 2011; Willard, 2012). Lymphoma commonly presents as transmural segmental thickening, loss of layer definition, and increased vascular supply with aberrant patterns on color Doppler (Quinci et al., 2023). USG is effective in identifying abnormal patterns in the stomach and intestines, but it cannot accurately distinguish between inflammatory, infectious, and neoplastic diseases. Additional tests, such as histopathology, immunohistochemistry, and molecular analysis, are necessary for a conclusive diagnosis. Table 1 summarizes the ultrasound patterns and possible diagnostic associations (Gaschen, 2011). Basic concepts and principles of ultrasoundB-mode ultrasound (brightness or two-dimensional)In B mode, the return echoes are converted into digital signals displayed as two-dimensional grayscale images (Peixoto et al., 2010). The intensity of the brightness on the screen varies according to the echogenicity: highly reflective structures appear brighter (Carvalho, 2004). In the longitudinal plane, blood vessels are visualized as tubular structures with hyperechogenic and parallel walls. In the transverse plane, they have an oval or circular shape. This mode makes it possible to detect alterations such as shunts, thickening of the vascular walls, or the presence of thrombi and tumors (Szatmári, et al., 2001; Carvalho, et al., 2008a, b). Doppler modeThe Doppler effect verifies changes in the frequency of reflected sound waves when blood or another moving structure interacts with the transducer beam (Carvalho et al., 2008a, b). It is used in the assessment of blood flow by differentiating dilated bile ducts from veins and detecting thrombosis and changes in flow (Mattoon and Nyland, 2015). The difference between the transmitted (Ft) and reflected (Fr) frequencies, which is called the Doppler shift frequency (Fd), is calculated using the formula: Fd=(2 . Ft . V . cosѲ) / C, where V is the flow velocity, cosѲ is the angle between the ultrasound beam and the flow, and C is the speed of sound in soft tissue (1,540 minute/second) (Szatmári, et al., 2001; Carvalho, et al., 2008a, b). Flows toward the transducer have a positive Fd; flows in the opposite direction have a negative Fd (Carvalho et al., 2008a, b).
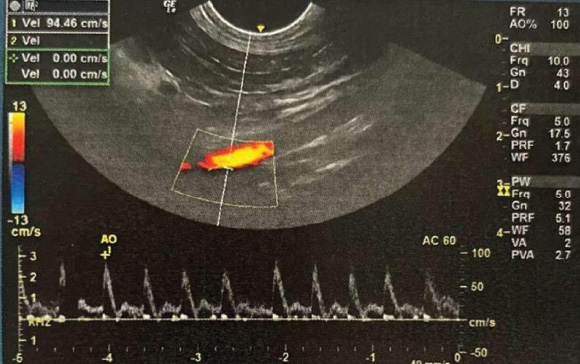
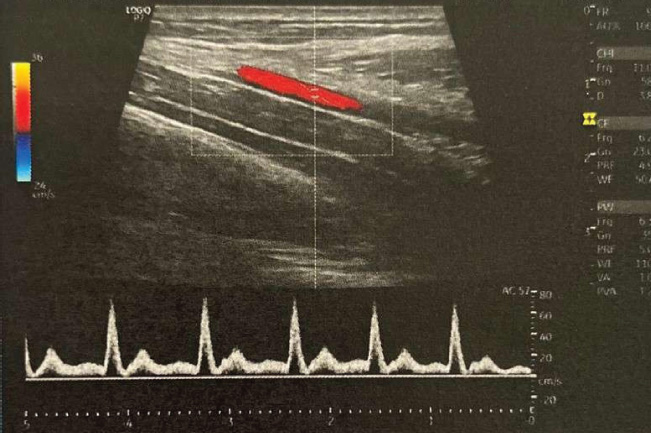
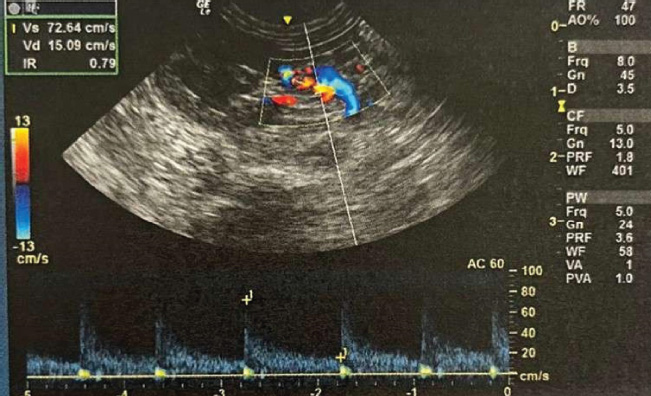
Fig. 6. Image of the abdominal aorta of a cat, showing the sample volume, ultrasound beam, and main flow vector, with the latter overlaid and parallel to the vessel being evaluated with spectral Doppler. Source: Personal archive, 2025. The Doppler mode has different techniques: Spectral Doppler: displays a graph of the flow over time; Color Doppler: maps the flow with colors, red for flows toward the transducer and blue for opposite flows (Carvalho et al., 2008a); Continuous Doppler: detects high flow frequencies, but without exact location of the depth; Amplitude Doppler: more sensitive to weak flows, but without indication of flow direction (Carvalho et al., 2008b). Pulsed spectral Doppler signalsThis technique measures flow velocity using piezoelectric crystals that emit ultrasound sound pulses and analyze the reflected signal. The sample volume (or “gate”) was adjusted in B mode to locate the area of interest (Szatmári, et al., 2001; Carvalho et al., 2008a). The accuracy of the Doppler decreases with angles close to 90°, and the data are processed via Fourier transform to generate graphs with Fd on the vertical axis and time on the horizontal (Carvalho et al., 2008b), as illustrated in Figure 6. The duplex image combines Doppler and B-mode images in real time, facilitating interpretation (Carvalho et al., 2008a). Color DopplerColor Doppler overlays the B-mode image with color-coded frequency shift mapping. Flows toward the transducer appear in red and opposing flows in blue. The intensity of the colors varies with the flow speed (Thomas et al., 1993; Szatmári, et al., 2001). This technique can quickly assess the presence, direction, and quality of flow in large areas, even when B-mode detection does not identify vessels (Carvalho et al., 2008a). Ultrasound with spectral Doppler mappingThe color mode detects the presence or absence of flow in the vessels, whereas the spectral mode makes it possible to observe variations in velocity throughout the cardiac cycle. The latter provides qualitative and quantitative information in graphic format, with time represented on the horizontal axis and speed or frequency of movement on the vertical axis (Carvalho et al., 2008, b). The spectral wave reflects intravascular blood flow variations and is influenced by cardiac output, vascular tone, and microvasculature resistance. The intensity of the glow in the spectrum indicates the amount of blood cells moving at a given speed within the sample volume (Szatmári et al., 2001; Chavhan et al., 2008). Spectral analysis provides morphological and hemodynamic information on factors affecting blood flow (Raisis et al., 2000). The writing committee (Kim et al., 2020) classified spectral waves in humans, and in the absence of a veterinary consensus committee, we followed the same terminology and classifications. Therefore, the waves can be multiphasic: when they cross the baseline (zero flow), showing forward and backward velocity components, or monophasic, which do not cross the baseline, indicating flow in a single direction throughout the cardiac cycle (Kim et al., 2020). The flow can be anterograde, following the expected direction in the circulatory system and appearing above or below the baseline. Retrograde flow, which occurs in the opposite direction, as in portal hypertension and or absent, with no flow detected (Jenderka and Delorme, 2015; Kim et al., 2020). In the morphological analysis of arterial spectral waves, classification can be based on the velocity profile and the resistance of the flow. In terms of velocity profile, flows can be laminar, where the blood moves in concentric layers, or turbulent. Within laminar flows, there are the following classifications (Jenderka and Delorme, 2015; Kim et al., 2020): Flat flow (Fig. 7): in large arteries (e.g., aorta), where the velocity is uniform, forming a spectrum with a wide spectral window (Chavhan et al., 2008; Miño et al., 2008; Jenderka and Delorme, 2015). Semi-parabolic flow (Fig. 8): in intermediate arteries (e.g., celiac artery), with intermediate characteristics between flat and parabolic flow, and a reduced spectral window (Carvalho et al., 2008b; Jenderka and Delorme, 2015).
Fig. 7. Spectral Doppler of the aorta, characterized by flattened and high-resistance flow. A thin line is observed in systole surrounding a clear space, known as the spectral window. Source: Personal archive, 2025. Parabolic flow (Fig. 9): in smaller arteries (e.g., renal artery), where the velocity is higher in the center of the vessel, eliminating the spectral window (Szatmári et al., 2001; Jenderka and Delorme, 2015) High-resistance waves show sharp peaks and rapid downward flow, whereas low-resistance waves show continuous flow throughout diastole without systolic notches (Kim et al., 2020). Venous flow is generally laminar and is influenced by factors such as cardiac pulsation and respiratory phase. Changes in the vascular bed of each organ affect the flow patterns of the corresponding vessels. Identifying abnormal variations in the spectral waveform aids diagnosis, even when the underlying causes are not fully understood (Chavhan et al., 2008; Jenderka and Delorme, 2019). Doppler velocimetric and hemodynamic evaluation of the spectral waveThe parameters obtained by Doppler velocimetry include: peak systolic velocity (PSV), end diastolic velocity (EnDV), mean maximum velocity (TAMAX), mean average velocity (TAMEAN), as well as resistivity (IR), and pulsatility (IP) indices (Jenderka and Delorme, 2019). The PSV represents the maximum arterial distension during systole and is a reliable parameter for assessing the degree of stenosis (Szatmári et al., 2001; Coley, 2004; Jenderka and Delorme, 2019). It increases in situations such as increased flow volume, stenosed area, or proximity to the stenosis, and decreases in cases of poststenosis flow limitation or reduced cardiac output (Jenderka and Delorme, 2019). EnDV measures the flow immediately before a new systole, thereby reflecting vascular resistance. A decrease indicates vasoconstriction, whereas an increase suggests vasodilation (Coley, 2004). The TAMAX and TAMEAN values were calculated by the USG device software based on the integral of the spectral wave velocity. TAMAX delineates the maximum velocities of the spectrum (yellow line), and TAMEAN reflects the average velocities (blue line). The indices are derived from PSV, EnDV, and TAMAX, neutralizing variations in insonation angle and vessel size, while providing information on flow and vascular resistance (Gaschen and Kircher, 2007; Chavhan et al., 2008). The IR is calculated as (PSV—EnDV)/PSV, reaching a maximum value of 1 when EnDV is zero. It is an indirect marker of vascular resistance but can show normal values even when systolic and diastolic velocities increase simultaneously (Novellas et al., 2007; Novellas et al., 2010; Ferrandis et al., 2013; Lee, 2013). The IP calculated by (PSV—EnDV)/TAMAX complements the IR by including the average of the maximum velocity throughout the cycle and is more sensitive to differentiating abnormal waves (Ferrandis et al., 2013).
Fig. 8. Spectral Doppler of the celiac artery, characterized by semiparabolic flow, showing a thin line in systole surrounding a clear space, known as the spectral window. Source: Personal archive, 2025.
Fig. 9. Spectral Doppler images of the renal artery. There is no spectral window, the systolic peaks are broad and continuous, and there is high diastolic flow velocity with a gradual decrease in speed. Source: Personal archive, 2025. Changes in PSV, EnDV, IR, and IP indicate vascular stenosis, changes in vascular bed compliance, parenchymal dysfunctions, malignant diseases, and implant rejection (Carvalho et al., 2008a). An increase in peripheral resistance, such as in obstructions or vasoconstrictions, reduces EnDV more than PSV, resulting in high IR and IP values. These indices correlate strongly with arterial capacitance, thereby aiding hemodynamic assessment (Novellas et al., 2007; Dos Reis et al., 2014). Ultrasound of the celiac artery and cranial mesenteric arteryCeliac arteryThe best image of the celiac artery is obtained with the patient in the right dorsal or lateral decubitus position, close to the right kidney (Carvalho et al., 2008a). The transducer is positioned ventrally to the lumbar processes and tilted dorsally to locate the aorta. With the aorta in a longitudinal plane, the transducer is moved cranially until the celiac artery and the cranial mesenteric artery are identified above the origin of the renal arteries. The celiac artery has a semiparabolic flow velocity profile and an intermediate resistance pattern. A broad systolic peak is observed with a well-defined mean spectral window and absence of reverse diastolic flow (Szatmári et al., 2001; Carvalho et al., 2008a). Cranial mesenteric arteryLocated below the celiac artery and above the right renal artery, the cranial mesenteric artery forms a “V” in the sagittal plane with the celiac artery when the patient is in the supine position. In the right lateral decubitus position, both directions follow parallel paths until they approach this point (Carvalho et al., 2008a). In spectral Doppler mapping, the cranial mesenteric artery shows a flow pattern of intermediate resistance with a broad systolic peak and small spectral window. After the systolic peak, the flow velocity decreases abruptly, accelerates, and then decelerates again. During fasting, the flow is of high resistance and of low resistance in the postprandial period due to increased blood flow to the stomach, duodenum, and pancreas after food intake (Carvalho et al., 2008b). The combined assessment of the celiac and cranial mesenteric arteries is useful for detecting and quantifying hemodynamic alterations in diseases of the digestive system, such as portal hypertension, inflammatory bowel disease, mesenteric ischemia, and liver neoplasms (Carvalho et al., 2008a; Miño et al., 2008). In humans, these arteries are also used to predict the severity of acute pancreatitis (Sakagami et al., 2002; Topal et al., 2008). In animals, they are potentially valuable for assessing portosystemic shunts and abdominal neoplasms (Carvalho et al., 2008a). ConclusionThe high prevalence of chronic enteropathies in cats, combined with the nonspecific clinical signs associated with these conditions, underscores the need for diagnostic tools. In this context, B-mode and Doppler ultrasound play a fundamental role in the noninvasive assessment of intestinal morphology and vascular flow dynamics. These techniques allow for a more detailed evaluation of the stomach and intestines and help differentiate between inflammatory, neoplastic, and ischemic diseases. However, despite their diagnostic value, ultrasound findings alone are often insufficient to establish a definitive diagnosis, especially in conditions with overlapping sonographic features, such as lymphoplasmacytic enteritis and alimentary lymphoma. The combination of Doppler velocimetric parameters with histopathology and immunohistochemistry remains essential for accurate classification. Further research is needed to standardize reference values for feline intestinal ultrasonography and to validate the clinical applications of Doppler ultrasound in diagnosing and monitoring feline chronic enteropathies. The integration of these techniques into routine veterinary practice enhances the early detection and characterization of gastrointestinal disorders, ultimately improving patient management and therapeutic decision-making. AcknowledgmentsNone. Conflicts of interestThe authors declare no conflicts of interest in this study. FundingThis research did not receive any specific grant. Authors’ contributionConceptualization: I. M. O., C. C. L. S., N. C. B., W. P. R. S., C. V. M. S., D. V. C., A. P. A. C.; methodology: I. M. O., W. P. R. S., C. V. M. S., D. V. C.; formal analysis: N. C. B., A. P. A. C.; data curation: I. M. O., W. P. R. S., C. V. M. S., D. V. C.; drafted the manuscript: N. C. B., I. M. O., A. P. A. C.; revised the manuscript: I. M. O., C. C. L. S., N. C. B., C. V. M. S., D. V. C.; translated the manuscript: I. M. O., N. C. B., A. P. A. C. All authors have read and agreed with the published version of the manuscript. Data availabilityAll data supporting the findings of this study are available in the manuscript. ReferencesAmorim, I., Taulescu, M.A., Day, M.J., Catoi, C., Reis, C.A., Carneiro, F. and Gärtner, F. 2016. Canine gastric pathology: a review. J. Comp. Pathol. 154, 9–37. Angelou, V., Fiska, A., Tsingotjidou, A., Patsikas, M. and Papazoglou, L.G. 2023. Surgical anatomy of the gastrointestinal tract in cats. Animals 13, 2670. Barrs, V. and Beatty, J. 2012. Feline alimentary lymphoma: 2. Further diagnostics, therapy and prognosis. J. Feline Med. Surg. 14, 191–201. Burk, R.L. and Ackerman, N. 1966. Small animal radiology and ultrasonography: a diagnostic atlas and text. Philadelphia, PA: W.B. Saunders. Carvalho, C.F. 2004. Ultrassonografia em pequenos animais. São Paulo, Brazil: Editora Roca, 320 p. Carvalho, C.F., Chammas, M.C. and Cerri, G.G. 2008a. Morfologia duplex Doppler dos principais vasos sanguíneos abdominais em pequenos animais. Ciênc. Rural 38, 880–888. Carvalho, C.F., Chammas, M.C. and Cerri, G.G. 2008b. Princípios físicos do Doppler em ultra-sonografia. Ciênc. Rural 38, 872–879. Chavhan, G.B., Parra, D.A., Mann, A. and Navarro, O.M. 2008. Normal Doppler spectral waveforms of major pediatric vessels: specific patterns. Radiographics 28, 691–706. Coley, B.D. 2004. Pediatric applications of abdominal vascular Doppler imaging: part I. Pediatr. Radiol. 34, 757–771. Cunningham, J.G. 2015. Tratado de fisiologia veterinária, 5th ed. Rio de Janeiro, Brazil: Elsevier. Di Donato, P., Penninck, D., Pietra, M., Cipone, M. and Diana, A. 2014. Ultrasonographic measurement of the relative thickness of intestinal wall layers in clinically healthy cats. J. Feline Med. Surg. 16, 333–339. Dos Reis, G.F., Nogueira, R.B., Silva, A.C., Oberlender, G., Muzzi, R.A. and Mantovani, M.M. 2014. Spectral analysis of femoral artery blood flow waveforms of conscious domestic cats. J. Feline Med. Surg. 16, 972–978. Ferrandis, I., Jakovljevic, S., Aprea, F. and Corletto, F. 2013. Effect of two sedative protocols and hepatosplenic disease on Doppler indices of splenic arteries in dogs: a preliminary study. Vet. J. 197, 712–716. Garcia, D.A.A. 2021. Ultrassonografia em cães e gatos: trato gastrointestinal - mapa mental com diagnósticos diferenciais. Curitiba, Brasil: Editora Aurora, 140 p. Gaschen, L. 2011. Ultrasonography of small intestinal inflammatory and neoplastic diseases in dogs and cats. Vet. Clin. North Am. Small Anim. Pract. 41, 329–344. Gaschen, L. and Kircher, P. 2007. Two-dimensional grayscale ultrasound and spectral Doppler waveform evaluation of dogs with chronic enteropathies. Clin. Tech. Small Anim. Pract. 22, 122–127. Gaschen, L., Kircher, P., Stüssi, A., Allenspach, K., Gaschen, F., Doherr, M. and Gröne, A. 2008. Comparison of ultrasonographic findings with clinical activity index (CIBDAI) and diagnosis in dogs with chronic enteropathies. Vet. Radiol. Ultrasound. 49, 56–64. Gieger, T. 2011. Alimentary lymphoma in cats and dogs. Vet. Clin. North Am. Small Anim. Pract. 41, 419–432. Goggin, J., Biller, D.S., Debey, B.M., Pickar, J.G. and Mason, D. 2000. Ultrasonographic measurement of gastrointestinal wall thickness and the ultrasonographic appearance of the ileocolic region in healthy cats. J. Am. Anim. Hosp. Assoc. 36, 224–228. Griffin, S. 2019. Feline abdominal ultrasonography: what’s normal? what’s abnormal? The liver. J. Feline Med. Surg. 21, 1039–1046. Husnik, R. and Gaschen, F. 2021. Gastric motility disorders in dogs and cats. Vet. Clin. North Am. Small Anim. Pract. 51, 43–59. Irom, S., Sherding, R., Johnson, S. and Stromberg, P. 2014. Gastrointestinal perforation associated with endoscopy in cats and dogs. J. Am. Anim. Hosp. Assoc. 50, 322–329. Jalava, K., On, S.L., Vandamme, P.A., Happonen, I., Sukura, A. and Hänninen, M.L. 1998. Isolation and identification of Helicobacter spp. from canine and feline gastric mucosa. Appl. Environ. Microbiol. 64, 3998–4006. Jenderka, K.V. and Delorme, S. 2015. Verfahren der Dopplersonographie. Der. Radiologe. 7, 593–610. Jenderka, K.V. and Delorme, S. 2019. Quantitative Verfahren in der Sonographie. Der. Radiologe. 59, 1019–1034. Jergens, A.E. 2012. Feline idiopathic inflammatory bowel disease: what we know and what remains to be unraveled. J. Feline Med. Surg. 14, 445–458. Jergens, A.E., Schreiner, C.A., Frank, D.E., Niyo, Y., Ahrens, F.E., Eckersall, P.D., Benson T.J. and Evans, R. 2003. A scoring index for disease activity in canine inflammatory bowel disease. J. Vet. Intern. Med. 17, 291–297. Kim, E.S., Sharma, A.M., Scissons, R., Dawson, D., Eberhardt, R.T., Gerhard-Herman, M., Hughes, J.P., Knight, S., Kupinski, A.M., Mahe, G., Neumyer, M., Poe, P., Shugart, R., Wennberg, P., Williams, D.M. and Zierler, R.E. 2020. Interpretation of peripheral arterial and venous Doppler waveforms: a consensus statement from the Society for Vascular Medicine and Society for Vascular Ultrasound. Vasc. Med. 25, 484–506. King, A.M. 2006. Development, advances and applications of diagnostic ultrasound in animals. Vet. J. 171, 408–420. König, H.E. and Liebich, H.G. 2021. Anatomia dos animais domésticos: texto e atlas colorido, 7th ed. Porto Alegre, Brasil: Editora Artmed, 832 p. Larson, M.M. and Biller, D.S. 2009. Ultrasound of the gastrointestinal tract. Vet. Clin. North Am. Small Anim. Pract. 39, 747–759. Lee, J. 2013. Image-based evaluation of vascular function and hemodynamics. Pulse 1, 108–122. Malancus, R.N. and Malancus, C.M. 2017. Assessment of ultrasonographic and endoscopic changes in dogs with gastrointestinale disorders. Arq. Bras. Med. Vet. Zootec. 69, 1451–1455. Marsilio, S. 2021. Feline chronic enteropathy. J. Small Anim. Pract. 62, 409–419. Mattoon, J.S. and Nyland, T.G. 2015. Small animal diagnostic ultrasound, 3rd ed. St. Louis, MO: Elsevier, 652 p. Miño, N., Espino, L. and Barreiro, A. 2008. Effects of medetomidine on Doppler variables of major abdominal arteries in normal dogs. Vet. Res. Commun. 32, 175–186. Moore, P.F., Rodriguez-Bertos, A. and Kass, P.H. 2012. Feline gastrointestinal lymphoma: mucosal architecture, immunophenotype, and molecular clonality. Vet. Pathol. 49, 658–668. Nacif, M.S., Rocha, V.D.M.B., Mello, R.A.F.D., Jauregui, G.F., Couto, L.S., Gonçalves, J.R.D.O. and dos Santos, A.A.S. 2004. Análise retrospectiva do trânsito do delgado em um serviço de radiologia de hospital geral. Radiol. Bras. 37, 179–183. Nautrup, C.P. and Tobias, R. 2000. An atlas and textbook of ultrasonography of the dog and cat. London, UK: Manson Publishing. Nelson, N.C., Drost, W.T., Lerche, P. and Bonagura, J.D. 2010. Noninvasive estimation of central venous pressure in anesthetized dogs by measurement of hepatic venous blood flow velocity and abdominal venous diameter. Vet. Radiol. Ultrasound. 51, 313–323. Novellas, R., Espada, Y. and De Gopegui, R.R. 2007. Doppler ultrasonographic estimation of renal and ocular resistive and pulsatility indices in normal dogs and cats. Vet. Radiol. Ultrasound. 48, 69–73. Novellas, R., Ruiz de Gopegui, R. and Espada, Y. 2010. Assessment of renal vascular resistance and blood pressure in dogs and cats with renal disease. Vet. Rec. 166, 618–623. Peixoto, G.C. X., Lira, R.A., Alves, N.D. and Silva, A.R. 2010. Bases físicas da formação da imagem ultrassonográfica. Acta Vet. Bras. 4, 15–24. Penninck, D.G., Nyland, T.G., Kerr, L.Y. and Fisher, P.E. 1990. Ultrasonographic evaluation of gastrointestinal diseases in small animals. Vet. Radiol. Ultrasound. 31, 134–141. Quinci, M., Pey, P., Diana, A., De Jesus, A. and Penninck, D. 2023. B-mode ultrasound and colour Doppler findings in cats with gastric lymphoma. J. Feline Med. Surg. 25, 1098612X221150174. Raisis, A.L., Young, L.E., Meire, H.B., Taylor, P.M., Walsh, K. and Lekeux, P. 2000. Variability of Doppler ultrasound measurements of hindlimb blood flow in conscious horses. Equine Vet. J. Suppl. 32, 125–132. Ramos, A.H., Santos, L.M., Miglino, M.A., Peres, J.A. and Guerra, R.R. 2011. Biometria, histologia e morfometria do sistema digestório do cachorro-do-mato (Cerdocyon thous) de vida livre. Biotemas. 24, 111–119. Rissetto, K., Villamil, J.A., Selting, K.A., Tyler, J. and Henry, C.J. 2011. Recent trends in feline intestinal neoplasia: an epidemiologic study of 1,129 cases in the veterinary medical database from 1964 to 2004. J. Am. Anim. Hosp. Assoc. 47, 28–36. Sakagami, J., Kataoka, K., Sogame, Y., Usui, N. and Mitsuyoshi, M. 2002. Ultrasonographic splanchnic arterial flow measurement in severe acute pancreatitis. Pancreas. 24, 357–364. Silva, L.C.D., Belotta, A.F., Machado, V.M.V. and Vulcano, L.C. 2013. Avaliação ultrassonográfica gástrica em pequenos animais. Vet. e Zootec. 20, 567–575. Simpson, K.W. and Jergens, A.E. 2011. Pitfalls and progress in the diagnosis and management of canine inflammatory bowel disease. Vet. Clin. North Am. Small Anim. Pract. 41, 381–398. Spaulding, K.A. 1997. A review of sonographic identification of abdominal blood vessels and juxtavascular organs. Vet. Radiol. Ultrasound 38, 4–23. Szatmári, V., Sótonyi, P. and Vörös, K. 2001. Normal duplex Doppler waveforms of major abdominal blood vessels in dogs: a review. Vet. Radiol. Ultrasound. 42, 93–107. Thomas, W.P., Gaber, C.E., Jacobs, G.J., Kaplan, P.M., Lombard, C.W., Vet, M., Moise N.S. and Moses, B.L. 1993. Recommendations for standards in transthoracic two‐dimensional echocardiography in the dog and cat. J. Vet. Intern. Med. 7, 247–252. Topal, N.B., Kaya, E., Ercan, I., Pourbagher, M.A. and Topal, U. 2008. The role of Doppler sonography in predicting severity of acute pancreatitis. J. Clin. Ultrasound. 36, 141–147. Willard, M.D. 2012. Alimentary neoplasia in geriatric dogs and cats. Vet. Clin. North Am. Small Anim. Pract. 42, 693–706. Winter, M.D., Londono, L., Berry, C.R. and Hernandez, J.A. 2014. Ultrasonographic evaluation of relative gastrointestinal layer thickness in cats without clinical evidence of gastrointestinal tract disease. J. Feline Med. Surg. 16, 118–124. | ||
| How to Cite this Article |
| Pubmed Style Sprícigo CVM, Spricigo JFW, Costa DV, Oliveira IM, Silva WPRD, Silva CCLD, Costa APA, Borges NC. B-mode and Doppler ultrasound in the gastrointestinal evaluation of cats. Open Vet. J.. 2025; 15(8): 3428-3438. doi:10.5455/OVJ.2025.v15.i8.6 Web Style Sprícigo CVM, Spricigo JFW, Costa DV, Oliveira IM, Silva WPRD, Silva CCLD, Costa APA, Borges NC. B-mode and Doppler ultrasound in the gastrointestinal evaluation of cats. https://www.openveterinaryjournal.com/?mno=244672 [Access: December 07, 2025]. doi:10.5455/OVJ.2025.v15.i8.6 AMA (American Medical Association) Style Sprícigo CVM, Spricigo JFW, Costa DV, Oliveira IM, Silva WPRD, Silva CCLD, Costa APA, Borges NC. B-mode and Doppler ultrasound in the gastrointestinal evaluation of cats. Open Vet. J.. 2025; 15(8): 3428-3438. doi:10.5455/OVJ.2025.v15.i8.6 Vancouver/ICMJE Style Sprícigo CVM, Spricigo JFW, Costa DV, Oliveira IM, Silva WPRD, Silva CCLD, Costa APA, Borges NC. B-mode and Doppler ultrasound in the gastrointestinal evaluation of cats. Open Vet. J.. (2025), [cited December 07, 2025]; 15(8): 3428-3438. doi:10.5455/OVJ.2025.v15.i8.6 Harvard Style Sprícigo, C. V. M., Spricigo, . J. F. W., Costa, . D. V., Oliveira, . I. M., Silva, . W. P. R. D., Silva, . C. C. L. D., Costa, . A. P. A. & Borges, . N. C. (2025) B-mode and Doppler ultrasound in the gastrointestinal evaluation of cats. Open Vet. J., 15 (8), 3428-3438. doi:10.5455/OVJ.2025.v15.i8.6 Turabian Style Sprícigo, Carolle Vieira Muterlle, José Felipe Warmling Spricigo, Daniel Vieira Costa, Iago Martins Oliveira, Wanessa Patrícia Rodrigues Da Silva, Carolina Castro Lyra Da Silva, Ana Paula Araújo Costa, and Naida Cristina Borges. 2025. B-mode and Doppler ultrasound in the gastrointestinal evaluation of cats. Open Veterinary Journal, 15 (8), 3428-3438. doi:10.5455/OVJ.2025.v15.i8.6 Chicago Style Sprícigo, Carolle Vieira Muterlle, José Felipe Warmling Spricigo, Daniel Vieira Costa, Iago Martins Oliveira, Wanessa Patrícia Rodrigues Da Silva, Carolina Castro Lyra Da Silva, Ana Paula Araújo Costa, and Naida Cristina Borges. "B-mode and Doppler ultrasound in the gastrointestinal evaluation of cats." Open Veterinary Journal 15 (2025), 3428-3438. doi:10.5455/OVJ.2025.v15.i8.6 MLA (The Modern Language Association) Style Sprícigo, Carolle Vieira Muterlle, José Felipe Warmling Spricigo, Daniel Vieira Costa, Iago Martins Oliveira, Wanessa Patrícia Rodrigues Da Silva, Carolina Castro Lyra Da Silva, Ana Paula Araújo Costa, and Naida Cristina Borges. "B-mode and Doppler ultrasound in the gastrointestinal evaluation of cats." Open Veterinary Journal 15.8 (2025), 3428-3438. Print. doi:10.5455/OVJ.2025.v15.i8.6 APA (American Psychological Association) Style Sprícigo, C. V. M., Spricigo, . J. F. W., Costa, . D. V., Oliveira, . I. M., Silva, . W. P. R. D., Silva, . C. C. L. D., Costa, . A. P. A. & Borges, . N. C. (2025) B-mode and Doppler ultrasound in the gastrointestinal evaluation of cats. Open Veterinary Journal, 15 (8), 3428-3438. doi:10.5455/OVJ.2025.v15.i8.6 |


