


| Research Article | ||
Open Vet. J.. 2025; 15(4): 1719-1733 Open Veterinary Journal, (2025), Vol. 15(4): 1719-1733 Research Article Diagnostic significance of clinical scoring system and serum lipid profiles as recovery indicators in ketotic dairy cattle using hormonal-steroids-carbohydrates therapeutic protocolArafat Khalphallah1, Abdulaziz H. Almuhanna2, Abdulrahman Abdulkarim3*, Khaled A. Khesruf4, Enas A. Abdelhafez5, Wael El-Deeb2, Ragab H. Mohamed6, Adel I. Almubarak2, Sabry A. Mousa7, Mahmoud Saber8, Ebtsam S. Abdel-lah9, and Enas Elmeligy101Division of Internal Medicine, Department of Animal Medicine, Faculty of Veterinary Medicine, Assiut University, Assiut, Egypt 2Department of Clinical Sciences, College of Veterinary Medicine, King Faisal University, Al-Ahsa, Saudi Arabia 3Department of Theriogenology, Faculty of Veterinary Medicine, Omar Almukhtar University, Bayda, Libya 4Department of Animal Diseases, Faculty of Veterinary Medicine, Aleppo University, Aleppo, Syria 5Department of Cell and Tissues, Faculty of Veterinary Medicine, Assiut University, Assiut, Egypt 6Department of Theriogenology, Obstetrics, and Artificial Insemination, Faculty of Veterinary Medicine, Aswan University, Aswan, Egypt 7Department of Veterinary Clinical Sciences, Faculty of Veterinary Medicine, Jordan University of Science and Technology, Irbid, Jordan 8Division of Internal Medicine, Department of Medicine and Infectious Disease, Faculty of Veterinary Medicine, Cairo University, Giza, Egypt 9Department of Pharmacology, Faculty of Veterinary Medicine, Assiut University, Assiut, Egypt 10Veterinary Teaching Hospital, Faculty of Veterinary Medicine, Assiut University, Assiut, Egypt *Corresponding Author: Abdulrahman Abdulkarim. Faculty of Veterinary Medicine, Omar Almukhtar University, Bayda, Libya. Email: abdulrahman.tahir [at] omu.edu.ly Submitted: 6/1/2025 Accepted: 14/3/2025 Published: 30/04/2025 © 2025 Open Veterinary Journal
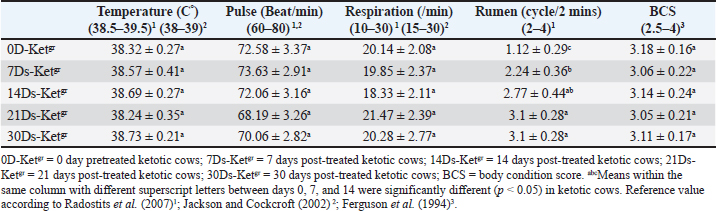
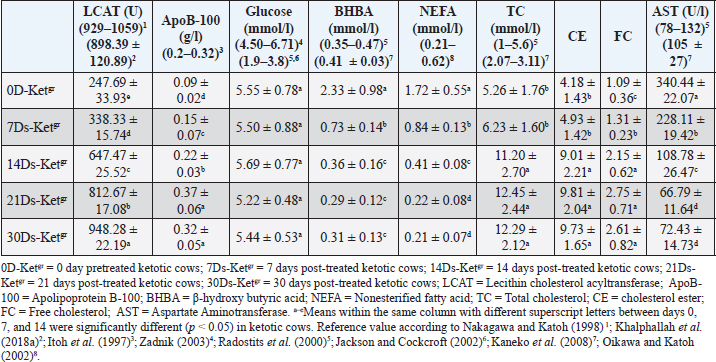
AbstractBackground: Ketosis is one of the most important metabolic disorders occurring in dairy cows after calving, which is caused by a negative energy balance during the peripartum period or around parturition. Aim: The current study focused on the diagnostic significance of the clinical scoring system, with serum lipid profiles, mainly lecithin cholesterol acyltransferase (LCAT) and apolipoprotein B-100 (ApoB-100), as recovery indicators in ketotic dairy cattle using the hormonal-steroids-carbohydrate therapeutic protocol. The study also discussed the correlation coefficient between serum apo-B100 and serum non-esterified fatty acids (NEFAs) in pretreated and post-treated ketotic cattle. Methods: In this study, 50 ketotic cattle from various dairy farms. The ketotic cows were subjected to a hormonal-steroids-carbohydrate therapeutic regimen extended for a continuous 5 days, including mainly insulin, dexamethasone, and carbohydrate replacement therapy (Glucose solution 50% alternative with dextrose solution 50%) with drenching of propylene glycol. and vitamin B12 injection. Insulin was administered simultaneously with both of glucose and glucocorticoid (Dexamethasone) and alternatively with a 50% dextrose solution. All animals were undergoing thorough clinical and biochemical investigations including mainly clinical scoring system, serum lipid profiles, and serum enzyme activities (Aspartate aminotransferase; AST) in days 0, 7, 14, 21, and 30. Results: The ketotic dairy cattle needed a maximum 30-day follow-up period post-therapy to restore their physiological status for clinical scoring data (7 days needed) and most serum lipid indices [14 days needed, i.e., apoB-100, β-hydroxy butyric acid, NEFA, glucose, cholesterol, and AST]. A 30-day post-therapy as a follow-up period was urgently required to restore their reference values of serum LCAT. The results of this study indicated that serum LCAT activity and ApoB-100 were the most sensitive indicators of the efficacy of therapy and the restoration of the physiological status. The study revealed a significant negative correlation between serum NEFA and apoB-100 in ketotic cattle. The results of this study indicated that serum LCAT activity and ApoB-100 were the most sensitive indicators of the efficacy of therapy and the restoration of the physiological status. This could be seen by an obvious improvement in serum lipid profiles, mainly LCAT and apoB-100, and clinical findings as well as clinical coring data. The study identified a significant negative correlation between NEFA and apoB-100 in ketotic cattle. Conclusion: Exposure of diseased ketotic dairy cattle to this specific therapeutic strategy had a great impact on their recovery from ketosis and improved their health and productivity status. The current study concluded the diagnostic significance of the clinical scoring system (Appetite score, rumen filling score, manure digestion score, and manure condition score), and serum lipid profiles, mainly LCAT and apoB-100, as recovery indicators in ketotic dairy cattle using hormonal-steroids-carbohydrates therapeutic protocol. Keywords: Apolipoprotein B-100, Clinical scoring data, Hormonal-steroids-carbohydrate therapeutic regimen, Ketotic dairy cattle, Lecithin cholesterol acyltransferase. IntroductionDairy cows are vulnerable to a variety of diseases during the postpartum period, particularly in the first 50 days after giving birth. These conditions include abomasal displacement (DA), milk fever, dystocia, metritis, mastitis, and ketosis (Curtis et al., 1985; Khalphallah et al., 2018a, 2018b). Energy-related diseases, such as ketosis, retained placenta, and DA, are occasionally correlated with mastitis, clinical hypocalcemia, and/or dystocia (Khalphallah et al., 2015; Khalphallah et al., 2016a–c; Khalphallah et al., 2018a, b). The transition period in bovine animals is the period from three weeks prior to calving until three weeks after delivery (Pande et al., 2016). The transition period exhibits distinct metabolic, nutritional, physiological, and nutritional alterations (Quiroz-Rocha et al., 2009; Khalphallah et al., 2015; Khalphallah et al., 2016b; Elmeligy et al., 2021). These adjustments or variations have occurred as a result of adaptations to the animal’s endocrine condition, which has promoted late gestation, the initiation of milk production, and delivery events that occurred between (Sundrum, 2015). Dairy animals are provided benefits for physiological adjustment to elevated energy requirements throughout the transitional phase, particularly after milk yield is delivered. Nonetheless, the success of each animal’s adaptation varies widely from one another (Sundrum, 2015). The failure of these physiological adjustments or adaptations later manifests as clinical or subclinical illnesses (Broom, 1993; khalphallah et al., 2018b). As a result, research into the physiological adaptations of ruminants has received more attention (Khalphallah et al., 2016c; Fiore et al., 2017; Khalphallah et al., 2018a; Elmeligy et al., 2021; Khalphallah et al., 2023), particularly during this critical period of the production and reproductive cycle of animals. Curtis et al. (1985); Duffield and Bagg (2002) revealed that early lactation cow herds in a state of ketosis had a higher incidence of DA. Conversely, left-displaced abomasum (LDA) was reported to increase the risk or frequency of other post-calving disorders. LDA cows are more likely to develop metritis and complicated ketosis. Therefore, feeding and management strategies that inhibit LDA can reduce the occurrence of some postpartum diseases. Khalphallah et al. (2018a) found that the most often observed peripartum period problems (50 DIM) in dairy cows are DA, ketosis, milk fever, retained fetal membranes, dystocia, and mastitis. Ketosis is one of the most important metabolic disorders noted in dairy cattle after calving and is caused by energy imbalance during calving (Cameron et al., 1998). The manure digestion score (MDS) is considered a very important tool for determining the quality of nutrition recently consumed by the animal, whereas the body condition score (BCS) indicates the nutritional history of the post several weeks to months (Robert, 2013; Khalphallah et al., 2016a). Manure scores of 1 and 5 are not preferable and usually refer to health problems as well as dietary limitations. Manure score varies with different stages of lactation. This core varies according to lactation stage, as it is 2.5 to 3.5 in close up dry cows, 3 to 4 in far off dry cows, 3 to 3.5 in late lactation cows, 2.5 to 3.5 in early lactation cows, and finally 2 to 2.5 in post-fresh cattle (Hutjens, 1996). Clinically (CK) or subclinically ketotic (SCK) cattle with DA may be evaluated by observing temperature, rumen filling score (RFS), appetite score, manure condition score (MCS), MDS, and BCS throughout the early postpartum period by applying a health monitoring program during this follow-up period (30 day) is suitable to enable the dairy cows to restore their healthy status following DA correction (Khalphallah et al., 2016a). However, these items have not been completely elucidated in ketotic cattle with reference to their response to a complete therapeutic regimen. Khalphallah et al. (2018a) concluded that serum lecithin cholesterol acyltransferase (LCAT) is a highly sensitive indicator of the transition phase. Furthermore, it had a greater predictive value than the other lipid profile indices, such as glucose, apolipoprotein B-100 (ApoB-100), and non-esterified fatty acids (NEFAs), in transition period disorders or diseases. The changes in serum LCAT activities have a high diagnostic significance because they enable cattle practitioners to predict metabolic disorders and establish specific dietary, management, and medical protocols to prevent their occurrence. It is obvious that reduced LCAT values during the peripartum period in dairy cattle precede the occurrence of ketosis or milk fever (Nakagawa and Katoh, 2000). Furthermore, LCAT was recently reported (Satoh et al., 2024) as a predictor of retained placenta in close-up dairy cows. According to Nakagawa and Katoh (1998), cattle that appear healthy but have lower LCAT activity are more susceptible to diseases related to fatty liver than cattle with normal activity. Many studies have investigated the efficacy of various therapeutic protocols in dealing with ketosis in dairy cows, including both treatment and management (Tufani et al., 2011), in which complex therapeutic programs have been used (Tufani et al., 2011; Madreseh-Ghahfarokhi et al., 2018). On the other hand, other researchers have applied simple therapeutic protocols (Duffield et al., 1998; Radostits et al., 2007; McArt et al., 2011). Numerous efficient treatments are available for ketosis in cattle, but in some affected animals, the response is only temporary; in rare instances, the disease can persist and result in death or force the animals to be slaughtered (Constable et al., 2017). The prognosis and response to the applied therapeutic program are associated with ketosis type I or II. Type I ketosis, which is reported at the peak of lactation (3 to 6 weeks post-calving), usually responds rapidly to treatment. However, if the diet is not changed, relapses are frequent. Type II periparturient ketosis usually responds to treatment less immediately (Holtenius and Holtenius, 1996; Herdt, 2000; Anderson and Rings, 2009). Several components of successful treatment of ketosis are demonstrated as they are based on restoring blood glucose values as soon as possible and replenishing oxaloacetate, an important intermediate in the tricarboxylic acid (TCA) cycle in the liver; thus, there is total oxidation of the fatty acids released from the fat depots. This enhances the availability of dietary glycogenic precursors, particularly propionic acid, and decreases the rate of ketone body production (Andrews et al., 2004). Combined insulin and glucocorticoid therapy may be more efficient than glucocorticoid alone. Insulin is also a strong antiketogenic agent that inhibits NEFA mobilization. Nonetheless, it is essential to provide a glucocorticoid or another medication that can compensate for the hypoglycemia-like effects of insulin (Andrews et al., 2004; Anderson and Rings, 2009). The current study focused on the diagnostic significance of the clinical scoring system, serum lipid profiles, mainly LCAT and ApoB-100 as recovery indicators in ketotic dairy cattle using the hormonal-steroids-carbohydrates therapeutic protocol. The efficacy of the applied hormonal-steroid-carbohydrates therapeutic protocols and the time elapsed until the dairy cows had restored their physiological status were also assessed. The study also investigated the correlation coefficient between apo-B100 and NEFA and their reflection in recovered cattle. Materials and MethodsAnimalsIn this study, 50 ketotic cattle from various dairy farms were examined. The dairy farms belonged to the Cairo and Giza governorates in Egypt. The ketotic cows were diagnosed as SCK cows or clinically ketotic cows (CK) based on clinical findings and estimation of serum β-hydroxy butyric acid (BHBA) levels in day 0 pretherapy, i.e., lactating cows 5 to 50 days in milk. The diseased animals were either SCK (Serum BHBA values1.2–2.4mmol/l) or CK (Serum BHBA values ≥ 2.5mmol/l) according to Sakha et al. (2006); Sakha et al. (2007); Tehrani-Sharif et al. (2012); Constable et al. (2017). Their body weight varied between 400 and 470 kg. Their age varied between 4 and 6 years. Their rations were mainly the total mixed ration (TMR). The farm’s system was a tie stall. Hormonal-steroids-carbohydrates therapeutic protocol was applied to the ketotic cows, which continued for 5 days to induce the recovery of diseased animals. The diseased cows were examined and sampled 5 times as follows; days 0, 7, 14, 21, and 30. Zero day was named 0 day pretreated ketotic cattle (0D-Ketgr). 7, 14, 21, and 30 were following treatment as they were named 7 days post-treated ketotic cattle (7Ds-Ketgr), 14 days post-treated ketotic cattle (14Ds-Ketgr), 21 days post-treated ketotic cattle (21Ds-Ketgr), and 30 days post-treated ketotic cattle (30Ds-Ketgr), respectively. Ketotic dairy cattle underwent complete clinical examination and laboratory assays to estimate serum lipid profiles, mainly serum LCAT activities, apoB-100, glucose levels, BHBA concentrations, NEFA, cholesterol values, and aspartate aminotransferase (AST) activities. SamplesAll precautions regarding sample collection and preparation to obtain an accurate assessment of biochemical indices were taken into consideration. Plain vacutainer tubes were used to collect blood serum samples and then stored at ?20°C until analysis, according to Coles (1986). Ketotic cows were sampled before treatment on day 0 and thereafter on days 7, 14, 21, and 30 following treatment. Therapeutic strategyThe applied therapeutic regimen (Hormonal-steroids-carbohydrate therapeutic regimen) was administered for a continuous 5 days according to Eddy (2004); Radostits et al. (2007); Constable et al. (2017); Elmeligy et al. (2021). First, insulin [Mixtard® 30 HM Vial 100 IU/ml, 1 vial contained 10 ml (1000 IU), Novo Nordisk A/S, Denmark] was administered subcutaneously and simultaneously with both IV 50% glucose solution and glucocorticoid (IM dexamethasone) and, thus, alternatively with IV 50% dextrose. The SC dose of Mixtard®30 HM was 2 ml (200 IU)/cow q 48 h for 5 days/3 doses. Carbohydrate replacement therapy included 500 mL of 50 % IV solution of glucose/cow q 48 h for 5 days/3 doses [Glucose ®, FIPCO, i.e., Fath for drug and cosmetics industry, Cairo, Egypt] alternatively with 500 ml of 50% IV dextrose solution/cow q48h for 5 days/2 doses (Dextrose 50%®, VETWIC, Cairo, Egypt). Successive 5-day treatment with propylene glycol as glucose precursor [Propane-1, 2-diol] and as carbohydrate replacement therapy (Propylene glycol, El Nasr Pharmaceutical Chemical Company, Cairo-Egypt) via drenching route as a dose of 300 ml/cow/12 hour for 2 days, followed by 150 ml/cow/24hr for another continuous 3 days. Dexamethasone (0.04 mg/kg, i.e., 20 mg/450 kg BWt) as glucocorticoid administration (Dexamethasone®, ADWIA Co., Cairo, Egypt) was used as an IM dose of 0.04 mg/kg BWt q48h for 5 days/3 doses. Steroids (Dexamethasone) were given as a single IM injection over a 1–3 minutes’ period after adequate fluid replacement therapy (50 % IV glucose solution) infusion. Vitamin B12 (KENAZAL® 10 solution, KENANA) was injected via IM route as 5 ml/100 kg BWt q48h for 5 days/3 doses. The feed additives contained amino acids (methionine and lysine) named as Smartamine® M (Kemin company-USA) imported by United Bio-med Co. (Cairo, Egypt) was used as an oral dose of 15 gm d/cow/24hrfor successive 60 days. Clinical examinationA comprehensive clinical examination was performed on each animal, following Cockcroft’s (2015) guidelines. Day 0 before treatment and days 7, 14, 21, and 30 after treatment. The estimation of general health indicators, such as rectal temperature, pulse rate, breathing rate, and rumen motion, was part of the clinical evaluation. Every cow’s BCS was determined using a 5-point rating system (Ferguson et al. 1994). According to Hutjens (1996); Hulsen (2007); Burfeind et al. (2010); Götze et al. (2019), the clinical scoring system and manure scoring of dairy cattle includes estimation of RFS, appetite score, MDS, and MCS. Lipid profile indicatorsUsing commercial kits (LCAT ELISA kit; Bovine LCAT ELISA Kit; MyBioSource, Inc., San Diego, USA), serum LCAT activity was measured by sandwich enzyme-linked immunosorbent assay (ELISA- Sandwich Protocol). The sandwichenzyme–linked immunosorbent assay (Sandwich ELISA, Double Antibody) was used to estimate the amount of ApoB-100 in serum. Commercial kits, such as the Bovine ApoB100 (Apolipoprotein B100) ELISA Kit (MyBioSource, Inc., San Diego, USA, were used for this assay. Serum BHBA levels were estimated using the kinetic enzymatic method using a Spectro Ultraviolet-Vis RS spectrophotometer (Labomed, Inc., Los Angeles, CA, USA) with commercial kits (Ranbut, Ranbut, Randox Ltd, UK) provided by Randox Ltd. The Spectro Ultraviolet-Vis RS spectrophotometer (Labomed, Inc., Los Angeles, CA, USA) was used to measure serum levels of NEFA, glucose, total cholesterol (TC), free cholesterol (FC), and AST (AST, Gamma Trade Company, Egypt) using commercial kits. Reagent kits for serum NEFA were obtained from Randox Ltd (NEFA, Randox Ltd, UK), whereas those for glucose, TC, FC, and AST were supplied by Gamma Trade Company (Cairo, Egypt). Cholesteryl ester (CE) was detected by subtracting the FC concentration from that of TC. Statistical analysisTo evaluate all of the collected data, computer software (SPSS version 16.0, Chicago, USA) was employed. The normal distribution of all parameters was tested using Kolmogorov-Smirnov normality test. All parameters were distributed normally. The values of the data were presented as mean ± SD. A general linear model repeated measures analysis of variance was used to examine the data from the biochemical and clinical studies, with a level of significance of p < 0.05. On certain sample days (days 0, 7, 14, 21, and 30), the significance of discrepancies between the means was evaluated. Using Pearson Correlation at p < 0.05 or p < 0.01, the correlation coefficient between apoB-100 and NEFA in ketotic cattle was determined in the current study. Ethical approvalThe current study was approved by the ethical committee of the Faculty of Veterinary Medicine, Assiut University, Egypt, licensed number 06/2025/0295, and was conducted in accordance with the Egyptian bylaws and OIE animal welfare standards for animal care and use in research and education. The investigated cows were taken from the farm by obtaining informed consent from the owner. ResultsTherapeutic protocolsThe hormonal-steroids-carbohydrate therapeutic regimen used during the present work included mainly SC insulin (2 ml/cow/48 hour for 5 days/3 doses) and IM dexamethasone as glucocorticoids (0.04 mg/kg BWt/48 hour for 5 days/3 doses), as a single IM injection over a 1–3 minutes’ period after adequate fluid replacement therapy [Carbohydrate replacement therapy, i.e., 50 % IV glucose solution] infusion. Insulin was administered subcutaneously and simultaneously with both IV 50% glucose solution and glucocorticoids (IM dexamethasone) or alternatively with IV 50% dextrose. Carbohydrate replacement therapy included IV infusion of glucose solution (50% 500 ml/cow every 48 hour for 5 days/3 doses) alternative with dextrose solution (50% 500 ml/cow every 48 hour for 5 days/2 doses. Furthermore, successive 5-day treatment with propylene glycol as glucose precursor [Propane-1, 2-diol] and as carbohydrate replacement therapy was applied via drenching route as a dose of 300 ml/cow/12 hour for 2 days followed by 150 ml/cow/24 hour for another continuous 3 days. Vitamin B12 was also used via IM route as 5 ml/100 kg BWt q48h for 5 days/3 doses. The feed additives contained amino acids (methionine and lysine) named as Smartamine was used as an oral dose of 15 gm d/cow/24 hour for successive 60 days. A hormonal-steroid-carbohydrate therapeutic regimen induced high recovery rates from ketosis and very low relapse rates for ketosis. Moreover, the hormonal-steroids-carbohydrate therapeutic regimen had high efficacy as well as significantly improved the health and productivity status of diseased ketotic dairy cattle by facilitating their recovery from ketosis and the dairy cattle needed a maximum 30 days follow up period in order to restore their physiological status either for clinical scoring data or for lipid profiles indices mainly serum LCAT. A significant (p < 0.05) improvement in clinical findings and clinical scoring data (Tables 1, 2) included rumen movement, appetite score, RFS, and MDS values post-therapy as they needed only 7 days follow up following treatment to restore their reference intervals. Blood lipid profiles (Table 3) were clearly changed and improved post-therapy in days 7–30 whereas remarkable (p < 0.05) elevations in serum LCAT activities, apoB-100 values, and cholesterol levels, and significant (p < 0.05) declines in serum levels of serum BHBA, NEFA, and AST activities, were reported. Dairy cows needed 14 days’ post-therapy to restore reference intervals of serum apoB-100, BHBA, NEFA, and AST while 30 days’ post-therapy as a follow up period was needed to restore their reference values of serum LCAT. Glucose and cholesterol levels were within their reference ranges. Table 1. Mean values of Body weight, temperature, pulse, respiration, and rumen movement in pretreated and post-treated ketotic cattle (n=50).
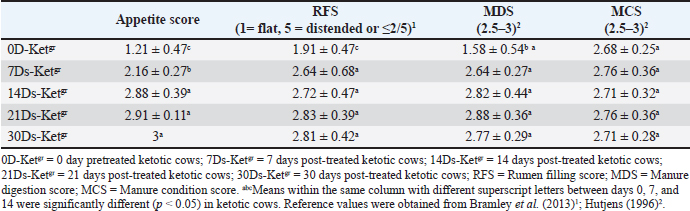
Table 2. Mean values of the appetite score, RFS, MDS, and MCS in pretreated and post-treated ketotic cattle (n=50).
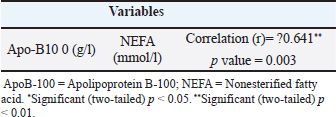
Risk factors, clinical findings, and clinical scoring dataKetotic cattle are often thought to be at risk for a variety of postpartum diseases, including DA, mastitis, and/or retained placenta. Of the 50 (100%) cows, 20 (40%) retained placenta, 15 (30%) had DA, five (10%) had mastitis, and 12 (24%) had no problems at all. There were no significant variations in the values of temperature, pulse rate, or respiratory rate of the sick ketotic cows between days 0 (pre-treatment), 7, 14, 21, and 30. Each value was within the physiological reference range. Significant (p < 0.05) elevations in ruminal movement values were reported in 7Ds-Ketgr, 14Ds-Ketgr, 21Ds-Ketgr, and 30Ds-Ketgr compared with their values in 0D-Ketgr, whereas they had become within their reference intervals by the 7th day post-therapy. BCS in ketotic cows showed no clear changes between days 0, 7, 14, 21, and 30; thus, BCS values were still within their reference intervals (Table 1). There was an improvement in clinical scoring data, including appetite score, RFS, and MCS as a response to treatment as they were remarkably (p < 0.05) raised in 7D-Ketgr, 14Ds-Ketgr, 21Ds-Ketgr, and 30Ds-Ketgr compared with their values in 0D-Ketgr, whereas they restored their reference intervals by the 7th day post-therapy. The MDS values showed no significant variations between days 0 and 30 in ketotic cattle and were still within their reference intervals (Table 2). These changes were correlated with the clear improvement in appetite and rumen movement observed in days 7–30 following therapy. Serum lipid profilesBlood lipid profiles in Ketotic cattle post-therapy showed clear improvement including elevations of blood levels of LCAT, apoB-100, glucose, and TC as well as reductions of blood concentrations of BHBA, NEFA, and AST were noticed in days 7–30 compared with their pretreatment values in day 0 (Table 3). The serum activities of LCAT were highly changed after therapy in ketotic dairy cattle as they were significantly (p < 0.05) raised in days 7–30 following treatment compared with those on day 0 (Pretreatment). Nevertheless, they remained below the reference values even after treatment (Days 7–21). Thirty days post-therapy as a follow-up period was needed by recovered dairy cows to restore their reference values of serum LCAT (Table 3). Ketotic cattle had remarkably (p < 0.05) lower concentrations of serum apoB-100 in 0D-Ketgr than their post-therapeutic values in days 7–30 and their reference intervals. Clear improvement in serum apoB-100 levels was observed following therapy, whereas the reference values were reached on day 14 posttherapy (Table 3). The current study reported no significant variations in serum glucose levels in ketotic cows either pretherapy (Day 0) or posttherapy (Days 7, 14, 21, and 30). Moreover, the blood glucose levels of the investigated dairy cows were within the reference intervals (Table 3). The serum concentrations of BHBA were significantly (p < 0.05) higher in ketotic cows before therapy (0D-Ketgr) than in 7Ds-Ketgr, 14Ds-Ketgr, 21Ds-Ketgr, and 30Ds-Ketgr. Later on, a significant (p < 0.05) drop in serum BHBA values was reported as a response to therapy in days 7–30 whereas they restored their reference values by the 14th day. Serum BHBA levels reached their lowest levels in post-therapeutic ketotic cows on day 21 (21Ds-Ketgr) (Table 3). Post-therapeutic ketotic cattle in days 7–30 had significantly (p < 0.05) lower values of serum NEFA levels than those on day 0 (0D-Ketgr). The serum NEFA concentrations in the investigated dairy cattle reached their reference ranges on day 14 following therapy. The serum NEFA levels reached their lowest levels in post-therapeutic ketotic cows on day 21 after treatment (Table 3). The present study revealed significantly (p < 0.05) higher serum levels of cholesterol, i.e., TC, CE, and FC, following therapy in ketotic cows on days 7, 14, 21, and 30 compared with their values in the 0D-Ketgr. However, serum cholesterol concentrations were within reference ranges throughout the present study (Table 3). The reported results showed severe reductions in serum enzyme activities of AST in post-therapeutic ketotic cattle, whereas their values in 7Ds-Ketgr, 14Ds-Ketgr, 21Ds-Ketgr, and 30Ds-Ketgr were remarkably (p < 0.05) lower than those in pretherapeutic ketotic cattle (0D-Ketgr). Dairy cows needed a 14-day follow-up period (Post-therapy) to restore their reference intervals of serum AST (Table 3). The study reported a significant negative correlation between serum NEFA and apoB-100 levels in ketotic cattle either pre- or post-therapy where the remarkable elevation of NEFA levels on day 0 was associated with clear declines in serum apoB-100 levels. In contrast, the significant reduction in serum NEFA levels after treatment (Days 7–30) was correlated with a significant increase in serum ApoB-100 levels ( r=?0.642, p < 0.05; Sig. 2-tailed=0.0033) (Table 4). Table 3. Mean values of serum lipid profiles in pre-treated and post-treated ketotic cattle (n=50)
Table 4. Pearson‘s correlation coefficient between serum apoB-100 and NEFA levels in ketotic cows.
DiscussionTherapeutic protocolsMost of the time, cows with type I ketosis reacted favorably to various ketosis interventions. All they required was an extra boost to get back on track in their struggle to meet energy needs (Holtenius and Holtenius, 1996; Oetzel, 2007; Elmeligy et al., 2021). Tufani et al. (2011) revealed that the importance of hormonal therapy, i.e., dexamethasone or nandrolone, in association with parenteral administration of glucose and B-complex (B1, B2, and B3) induced a very low rate of recurrence and a great recovery rate. McArt et al. (2011) added that oral propylene glycol therapy proved a highly successful way to prevent and treat ketosis in dairy cows in addition to clearly increasing milk production. Regarding the present study, the hormonal-steroids-carbohydrate therapeutic regimen used during the present work included mainly SC insulin and glucocorticoids as dexamethasone, as a single IM injection over a 1–3 minutes’ period after adequate fluid replacement therapy [Carbohydrate replacement therapy, i.e., 50 % IV glucose solution] infusion. Insulin was administered subcutaneously and simultaneously with both IV 50% glucose solution and glucocorticoids (IM dexamethasone) or alternatively with IV 50% dextrose. Carbohydrate replacement therapy included a 50% IV alternative with a dextrose solution of 50% IV. Furthermore, successive 5-day treatment with propylene glycol as glucose precursor [Propane-1, 2-diol] was used as carbohydrate replacement therapy. IM injection of Vitamin B12 as well as the use of the feed additives (Smartamine) were also used. A hormonal-steroid-carbohydrate therapeutic regimen induced high recovery rates from ketosis and very low relapse rates for ketosis. Moreover, exposure of diseased ketotic dairy cattle for a specific therapeutic strategy had a great impact on their recovery from ketosis and improving their healthy and productivity status whereas this therapeutic regimen approved high efficacy and the dairy cattle needed maximum of 30 days follow up period in an order to restore their physiological status either for clinical scoring data or for lipid profiles indices mainly serum LCAT. 7 days were needed through which dairy cows could restore their clinical score data. Dairy cows needed 14 days’ post-therapy to restore reference intervals of serum apoB-100, BHBA, NEFA, and AST while 30 days’ post-therapy as a follow up period was needed to restore their reference values of serum LCAT. Furthermore, our current research has shown the great effectiveness of treatment in ketotic cows receiving 200 IU SC of insulin in conjunction with 500 mL of IV glucose 50% and 20 mg/450 kg of dexamethasone once daily every other day. This regimen should be followed for consecutive five days, alternating with 50% dextrose. According to Sakai et al. (1993), ketotic cows given only intravenous glucose daily recovered more slowly than those given intravenous glucose and subcutaneous insulin injections for four days. Additionally, the responses of cows with primary ketosis to treatment with corticosteroids and IV glucose were shown to be superior than therapy with corticosteroids or IV glucose alone, with fewer relapses. These findings were corroborated by studies conducted by Radostits et al. (2007); Constable et al. (2017). According to other research, insulin promoted hepatic gluconeogenesis, inhibited lipolysis, and improved cellular absorption of glucose. insulin, when given in conjunction with glucose or corticosteroids, might be effective in treating early-onset ketosis that was not responded to glucose or corticosteroids (Djokovic et al., 2007; Radostits et al., 2007; Elmeligy et al., 2021), and thus IV dextrose infusion must always be seen as a combined insulin and glucose therapy (Djokovic et al., 2007; Constable et al., 2017). On the other hand, the importance of the injection of exogenous insulin in ketosis therapy that was reported in the current study was supported by Hayirli et al. (2002); Hayirli (2006). According to Hayirli (2006), restoring nutritional status could alleviate the lowered responsiveness and sensitivity of extrahepatic tissues to insulin that resulted from a negative energy balance. This would increase the effectiveness of exogenous insulin in treating hepatic lipidosis and ketosis, preserving health and enhancing performance. Radostits et al. (2007); Grãnberg et al. (2011) stated that IV infusion of glucose solution 50% (500 ml) led to elevated insulin secretion and reduced glucagon release as well as transient hyperglycemia with lowered plasma concentration of NEFA. Compared to therapy with corticosteroids or glucose alone, the response of cows with primary ketosis to corticosteroid treatment with IV glucose infusion was superior, with fewer relapses (Shpigel, 1996). Because it reduced the synthesis of ketone bodies through the use of Acetyl-CoA generated through fatty acid oxidation, and because it increased the availability of glucose precursors in the liver, glucocorticoid treatment was also beneficial. Usually, a single dose was administered when the injection could be repeated. The repeated glucocorticoid therapy had one disadvantage including reduced appetite and milk yield. Ketotic cattle treated with glucocorticoids were less vulnerable to relapses than were those treated with IV glucose therapy alone, although relapses were still reporting (Andrews et al., 2004). Risk factors, clinical findings, and clinical scoring data:Ketosis of both CK and SCK is a prevalent metabolic disease during the periparturient stage because it is associated with several concomitant diseases and financial losses (Dohoo et al., 1984; McArt et al., 2012; Khalphallah et al., 2018a; Elmeligy et al., 2021). Iwersen et al. (2009) reported that SCK was frequently hidden in the absence of clinical findings and that the actual prevalence in dairy herds was undervalued. Ketosis negatively affected the reproductive, productive, and healthy performance of cows. According to the current study, ketotic cattle were typically regarded as risk factors for a variety of postpartum illnesses, including mastitis, retained placenta, and/or DA. Previous reports have mentioned that subclinical or clinical ketosis is one of the outcomes of negative energy balance (Andersson, 1984; Andersson, 1988). The dairy sector suffered economic losses due to ketosis because it reduced milk output, reproductive efficiency, increased involuntary culling, and increased treatment expenses (Miettinen, 1990, Miettinen et al., 1991, Detilleux et al., 1994; Elmeligy et al., 2021). On the other hand, dairy herds with ketosis, particularly early lactation cattle, were at higher risk of DA and retained fetal membranes (Curtis et al., 1985; Duffield and Bagg, 2002; Melendez et al., 2003) and were more prospective to have reduced fertility and longer periods between calving and pregnancy (Opsomer et al., 2000; Gillund et al., 2001). The clinical findings in diseased ketotic cattle throughout the current study, including temperature, pulse rate, and respiratory rate, revealed no significant variations between days 0 (pre-treatment), 7, 14, 21, and 30. All clinical parameters were within the physiological reference range reported by Jackson and Cockcroft (2002); Radostits et al. (2007). Significant elevations in ruminal movement values were described in post-treated cows compared with their values in day zero, whereas they had become within their reference intervals reported by Radostits et al. (2007) in the 7th day post-therapy. These findings agreed with Tufani et al. (2011), who noted a typical, sweetish smell of urine, milk, and breath in the majority of the cases. Other previous reports mentioned abrupt decreases in milk production and an unwillingness to consume concentrate feeds and grains as clinical indications of ketosis. The breath and milk had a pleasant acetone odor. Nervous signs in cows have been also reported (Moore and Ishler 1997; Constable et al., 2017). BCS in ketotic cows during the current study revealed no clear variations between days 0, 7, 14, 21, and 30; thus, BCS values were still within the reference values mentioned by Ferguson et al (1994). These results were relatively consistent with Khalphallah et al. (2018a), who reported no remarkable changes in BCS values between diseased and healthy cattle either in close-up or postfresh periods. Edwards and Tozer (2004) revealed an association between ketosis in dairy cows and a gradual decline in their BCS over several days or weeks. Previous studies have stated that most dairy cows with higher BCS prepartum faced a negative energy balance in early lactation due to their lower postpartum feed intake, which left them in a negative energy balance for a longer period than cattle with normal or low BCS (Hayirli et al., 2002). Dyk (1995) mentioned cows with excess BCS at parturition were more likely to experience ketosis. It is possible that the higher reported incidence of LDA in cows with higher BCS at parturition was due to the higher prevalence of ketosis in these cows. Moreover, greater amounts of dry matter intake (DMI) reduction had been reported during the transition period of dairy cows compared with heifers (Hayirli et al., 2002), suggesting greater energy disturbances, which might explain their higher susceptibility to postures metabolic diseases (Curtis et al., 1985). Burfeind et al. (2010) revealed that RFS is related to feed intake, suggesting that it should be estimated consistently at the same time of day to detect changes in dry matter intake. Moreover, Götze et al. (2019) reported that the RF score is a sensitive tool for monitoring feed intake during the first week after giving birth. It was only appropriate for the identification of animals at risk who had significantly decreased their feed intake over a few days due to poor prepartum response. The ketotic cows in the current study showed a clear improvement in their clinical scoring data, including appetite score, RFS, and MCS as a response to treatment as they were remarkably raised following therapy in 7D-Ketgr, 14Ds-Ketgr, 21Ds-Ketgr, and 30Ds-Ketgr compared with their values in 0D-Ketgr whereas they restored their reference intervals mentioned by Hutjens (1996); Bramley et al. (2013) by the 7th day post-therapy. MDS values showed no significant variations between days 0 and 30 in ketotic cattle and were still within the reference intervals mentioned by Hutjens (1996). These changes were correlated with the clear improvement in appetite and rumen movement observed in days 7–30 following therapy. These results were supported by Khalphallah et al. (2016a); Götze et al. (2019). Khalphallah et al. (2016a) reported a clear improvement in RFS in dairy cows following surgical operation in recovered DA cows either with SCK or with CK, particularly on day 30. MDS was greatly improved (Declined undigested feed particles) in the recovered DA cows with either SCK or CK, particularly on day 30. The ideal manure score was three with normal pat form, as described by Allen and Beede (1996); Hutjens (1996); Robert (2013). Khalphallah et al. (2016a) reported that MCS (3.40 ± 0.7) was clearly increased (Optimal consistency) in all ketotic cattle with DA on postoperative day 30, which was indicated by good consistency of the feces, reflecting restoration of normal digestion in the cow. Khalphallah et al. (2016a) reported that the improvement in MDS (Reduced undigested feed particles) in cows with DA with ketosis required a longer period, which extended to day 30 postoperatively. Serum lipid profilesBlood lipid profiles in Ketotic cattle post-therapy showed clear improvement, including elevations of blood levels of LCAT, apoB-100, glucose, and TC, as well as reductions of blood concentrations of BHBA, NEFA, and AST were noticed in days 7–30 comparing with their values pretherapy in day 0. These significant changes in blood lipid profiles, LCAT, and apoB-100 revealed the improvement of animal health as biosynthesis, metabolism, and transport of these parameters were conducted within the liver and by enzymes synthesized in the liver. This interpretation was supported by Drackley (1999), who added that diseases of transition period like ketosis, retained fetal membranes, and DA were mainly correlated with fatty liver. Furthermore, Jonas (1998) added that LCAT was mainly synthesized by the liver and, in plasma, catalyzed the transesterification of FC with lecithin, i.e., phosphatidylcholine, and resulted in CE. Therefore, LCAT activity, together with the CE concentration, was similarly reduced in cows with ketosis and LDA (Nakagawa and Katoh, 1998). Ketotic cows showed the same changes in serum LCAT during the present study; accordingly, serum activities of LCAT were highly changed after therapy in ketotic dairy cattle as they were significantly increased in days 7–30 following treatment compared with their zero-day pretreatment values. However, they were still lower than the reference values reported by Nakagawa and Katoh (1998); Khalphallah et al. (2018a) even after therapy (days 7–21). A 30-day post-therapy as a follow-up period was needed by recovered dairy cows to restore their reference values of serum. Khalphallah et al. (2016b) reported a significant increase in serum LCAT activity in ketotic cows with DA after surgery on day 30 compared with that on day 0 before surgery. Other reports mentioned a reduction in serum LCAT activity in diseased cattle, whether in the close-up or post-fresh period, compared with their values in control cattle (Khalphallah et al., 2018a). The decrease in LCAT levels was reported before the diagnosis of ketosis, clinical hypocalcemia, or milk fever (Nakagawa and Katoh 2000). Some studies referred to the use of serum LCAT activities as a diagnostic marker for fatty liver-related disorders, including DA and ketosis, as they were more diagnostic than blood apoB-100 levels because the reduction in serum LCAT activities usually preceded clinical signs, as well as their activities were not altered during the peripartum period, at least in some healthy cattle (Nakagawa and Katoh, 1998). ApoB-100 concentrations were decreased in dairy cows with hepatic lipidosis-related diseases, such as ketosis, retained fetal membranes, and LDA (Oikawa et al., 1997). The similarly reduced rates of apoB-100 suggested that this drop in apoB-100 concentrations in milk fever, ketosis, downer cow syndrome, retained placenta, and LDA were predominantly caused by fatty liver, confirming the theory that fatty liver was the origin of these diseases (Morrow, 1976; Morrow et al., 1979; Gerloff et al., 1986; Herdt, 1988). These results supported the current results in which ketotic cattle had remarkably lower concentrations of serum apoB-100 in 0D-Ketgr than their post-therapeutic values in days 7–30 and their reference intervals. Clear improvement in serum apoB-100 levels was observed following therapy, whereas their reference values mentioned by Itoh et al. (1997) were reached on day 14 post-therapy. The previous literature revealed that serum levels of apoB-100 showed significant changes in ketotic cows with DA as their blood concentrations were significantly decreased in the diseased status on day 0 compared with their recovered status after surgery on day 30. Their levels on day 30 were within the reference ranges (Khalphallah et al., 2016b). The current results reported no significant variations in serum glucose concentrations in ketotic dairy cattle either pretherapy (Day 0) or post-therapy (Days 7, 14, 21, and 30). Moreover, blood glucose levels in the investigated dairy cows were within the reference intervals reported by Radostits et al. (2000); Jackson and Cockcroft (2002); Zadnik (2003). The blood glucose, TC, triglycerides,` and albumin concentrations were greatly lower during prepartum, i.e., 1–15 days, in puerperal ketotic cattle than in healthy cows (Đoković et al., 2012). Furthermore, a strong association between reduced blood glucose and an elevated incidence of ketosis has been reported in post-fresh dairy cows (Radostits et al., 2007). Cows with SCK had lower blood glucose concentrations than those without ketosis (Sakha et al., 2007; Tehrani-Sharif et al., 2012); however, in dairy cattle with SCK ketonemia, remarkable hypoglycemia was reported (Gröhn et al., 1983). Moreover, Moyes et al. (2009) reported an association between higher levels of prepartum glucose in cattle and an increased incidence of postpartum diseases. Khalphallah et al. (2018a) mentioned that blood glucose levels in close-up or post-fresh healthy cows, as well as cattle with postpartum diseases (Ketosis, DA, and retained placenta), were still within the physiological reference values; however, blood concentrations of glucose were significantly lower in the diseased cows with postpartum diseases than in healthy cattle in the close-up period. These significant changes were absent in the post-fresh period between healthy cows and those with postpartum diseases. In contrast, Khalphallah et al. (2016b) reported that ketotic cows with DA showed no significant changes in blood glucose levels, and their values were within the reference ranges before or after treatment. Serum BHBA levels were negatively correlated with serum glucose levels in SCK cattle (Sakha et al., 2007). Plasma glucose values and plasma BHBA concentrations were used together to categorize cattle as having a low energy state (Whitaker et al., 1983). According to the present study, serum BHBA concentrations were significantly higher in ketotic cows before therapy (0D-Ketgr) than their values in days 7–30 (Post-therapy). Later on, a significant drop in serum BHBA values was reported as a response to therapy in days 7–30 whereas they restored their reference values were restored, as reported by Radostits et al. (2000); Kaneko et al. (2008) in the 14th day (21Ds-Ketgr). Serum BHBA levels reached their lowest levels in post-therapeutic ketotic cows on day 21 (21Ds-Ketgr). In contrast, Khalphallah et al. (2016b) stated that although there was a significant reduction in serum BHBA in ketotic cows treated with DA on days 7 and 30 compared with their values on day 0, their levels were still higher than their reported reference values, which were mentioned by Radostits et al. (2000); Kaneko et al. (2008). In contrast, the DA cattle showed no remarkable changes in serum BHBA either pre-treatment or post-treatment and were still within the reference range (Khalphallah et al., 2016b). During 1–15 days prepartum in puerperal ketotic cows, significant increases in hepatic fat content and blood BHBA concentrations were reported (Đoković et al., 2012). Furthermore, Plasma NEFA was a more accurate indicator of energy balance than serum BHBA concentrations as serum BHBA was usually influenced by glucose and energy balance. Elevated levels of serum BHBA are related to decreased milk yield, elevated clinical ketosis, and LDA, and decreased fertility (Herdt et al., 2001). Holtenius and Holtenius (1996); Herdt (2000) stated that the diagnostic test of type I ketosis was an estimation of blood levels of postures BHBA, while the diagnostic test of type II ketosis was an estimation of blood levels of prepartum or refresh NEFA and their prevention strategy was based on improvement of nutrition and management just before calving for type II ketosis and in the early lactation for type I ketosis. Serum NEFA normally increases in the last few days before the expected delivery or calving in pregnant cattle (Oetzel, 2003). Plasma NEFA concentrations increased significantly after calving, indicating that the cow felt a negative energy balance. This negative energy balance was also demonstrated by the decrease in BCS and body weight after calving (3 weeks after calving). A severe decrease in body weight and BCS after calving may indicate dramatically increased plasma NEFA concentrations (Tharwat et al., 2012). Throughout the present study, the post-therapeutic ketotic cattle in days 7–30 had significantly lower serum NEFA values than those on day 0 (0D-Ketgr). The serum NEFA concentrations in the investigated dairy cattle reached the reference ranges reported by Oikawa and Katoh (2002) on day 14 following therapy. Serum NEFA levels were lowest in post-therapeutic ketotic cows on day 21 after treatment. On the other hand, the reported results showed severe reductions in the serum enzyme activities of AST in post-therapeutic ketotic cattle, whereas their values in 7Ds-Ketgr, 14Ds-Ketgr, 21Ds-Ketgr, and 30Ds-Ketgr were remarkably lower than those in pretherapeutic ketotic cattle (Day 0). Dairy cows needed a 14-day follow-up period (Post-therapy) to restore their reference intervals of serum AST, as mentioned by Radostits et al. (2000); Kaneko et al. (2008). These findings were supported by Đoković et al. (2012), who reported that puerperal ketotic cows showed significant elevations in both blood NEFA concentrations and AST activities during 1–15 days before the expected calving. Khalphallah et al. (2016b) added that DA cattle with CK or SCK had higher serum NEFA and AST levels on day 0 before surgery than on days 7 and 30 post-surgery. Khalphallah et al. (2018a) reported no significant differences in serum NEFA levels between healthy cattle and those with postpartum disease during the close-up period. Serum. The serum NEFA levels were still within their reference intervals. Furthermore, Cameron et al. (1998) stated that because milking cows were supposed to have a negative energy balance, blood NEFA concentrations were high following calving, although this fluctuated and was difficult to measure. Consequently, compared with NEFA concentration, postpartum serum BHBA was a more sensitive and specific test. Fatty liver in dairy cows usually preceded ketosis, whereas fatty liver was reported in almost all natural states of bovine ketosis (Shaw, 1956; Oikawa et al., 1997; Tharwat et al., 2012). As reported in fatty liver cases, overfeeding was epidemiologically suggested as a significant contributor to ketosis (Markusfeld, 1985). Moreover, higher levels of blood NEFA (Kronfeld, 1965) as well as lower CE and PL levels were reported in ketotic cows (Nakagawa and Katoh, 1998). The present study revealed significantly higher serum levels of cholesterol, i.e., TC, CE, and FC, following therapy in ketotic cows on days 7, 14, 21, and 30 compared with their values in the 0D-Ketgr. However, serum cholesterol concentrations were within the reference ranges mentioned by Radostits et al. (2000); Kaneko et al. (2008) throughout the present study. Alterations in serum cholesterol concentrations are usually associated with both fat intake (Duske et al., 2009) and feed intake (Janovick Guretzky et al., 2006). Khalphallah et al. (2016b) added that TC concentrations were clearly altered in ketotic cattle with DA before and after surgical correction of DA, where they were significantly elevated after surgery, particularly on day 30 compared with their values on day 0. Lower blood CE and PL concentrations have been reported in cows with ketosis (Nakagawa and Katoh, 1998). Decreased cholesterol concentrations have been demonstrated in hepatic lipidosis (Bobe et al., 2004; Van den Top et al., 2005) and metabolic diseases (Itoh et al., 1998), and have been associated with feed intake (Janovick Guretzky et al., 2006). The study reported a significant negative correlation between NEFA and apoB-100 in ketotic cattle either pre- or post-therapy, whereas remarkable elevations of NEFA levels on day 0 were consistent with significant declines in serum apoB-100. In contrast, the significant reduction in serum NEFA levels reported after treatment (Days 7–30) was correlated with a higher increase in serum ApoB-100 levels. These findings were supported by Khalphallah et al., (2016b), who reported the same relationship between serum NEFA concentration and serum apoB-100 values in DA with clinical ketosis either before or after surgery. This might be due to an elevation in serum NEFA levels associated with the development of fatty liver as well as the reduced ability of the liver to secrete apoB-100 as a very low-density lipoprotein to the circulation, which eventually causes a reduction in serum apoB-100. On the other hand, previous studies have mentioned that VLDL formation depends on apolipoprotein and cholesterol. Accordingly, apolipoprotein supply was limited in cows; therefore, the ruminant liver had a limited or weak capacity to secrete VLDL (Grummer, 1993), and overproduction of TGs then accumulated in the hepatocyte cytosol, producing fatty liver (Cavestany et al., 2005; Ingvartsen et al., 2003). ConclusionThe current study concluded the diagnostic significance of the clinical scoring system [Appetite score, RFS, MDS, and MCS], and serum lipid profiles, mainly LCAT and ApoB-100, as recovery indicators in ketotic dairy cattle using hormonal-steroids-carbohydrates therapeutic protocol. Exposure of diseased ketotic dairy cattle to this specific therapeutic strategy had a great impact on their recovery from ketosis and improved their health and productivity status. Therefore, the ketotic dairy cattle needed a maximum 30 days follow-up period post-therapy to restore their physiological status for clinical scoring data [7 days needed] and most serum lipid indices [14 days needed, i.e., serum ApoB-100, BHBA, NEFA, glucose, cholesterol, and AST]. A 30-day post-therapy as a follow-up period was needed to restore their reference values of serum LCAT. The results of this study indicated that serum LCAT activity and ApoB-100 were the most sensitive indicators of the efficacy of therapy and the restoration of the physiological status. This could be seen by an obvious improvement in serum lipid profiles, mainly LCAT and apoB-100, and clinical findings as well as clinical coring data. The study identified a significant negative correlation between NEFA and apoB-100 in ketotic cattle. AcknowledgmentNot applicable. FundingThe study did not receive any external funding. Authors’ contributionsA.K., A.H.A., E.E., R.H.M., and K.A.K. prepared the study conception and design. A.K., E.E., MS, W.M.E., A.A., K.A.K., and S.A.M. conducted the field study and cattle examination. A.K., E.A.A., MS, R.H.M., S.A.M., E.S.A., and E.E. collected laboratory samples and conducted laboratory analyses. K.A.K., A.H.A., MS, R.H.M., A.I.A., and A.K. manipulated and statistically analyzed the data. A.A., A.H.A., E.A.A., E.S.A., and A.I.A. performed the analysis, data curation, and interpretation of the data. A.I.A., W.M.E., A.K., A.H.A., and E.E. drafted the manuscript. E.E., E.S.A., A.H.A., E.A.A., and A.K. performed final writing, critical review, and revision. All authors have read and approved the final manuscript. Conflict of interestThe authors declare that they have no conflicts of interest. Data availabilityThe datasets used and/or analyzed during the current study are available from the corresponding author upon reasonable request. Data was also available after publishing in this journal. ReferencesAllen, M. and Beede, D. 1996. Causes, detection and prevention of ruminal acidosis in dairy cattle examined. Feedstuffs 9, 13. Anderson, D.E. and Rings, D.M. (eds) 2009. Current veterinary therapy. In: Food Animal Practice, 5th ed. Philadelphia, PA: W.B. Saunders Company, pp. 756. Andersson, L. 1984. Concentrations of blood and milk ketone bodies, blood isopropanol, and plasma glucose in dairy cows according to the degree of hyperketonemia and clinical signs. Zentralbl Veterinarmed A. 31 (9), 683–693; doi:10.1111/j.1439-0442.1984.tb01327.x Andersson, L. 1988. Subclinical ketosis in dairy cows. Vet. Clin. North Am. Food Anim. Pract. 4 (2), 233–251; doi:10.1016/s0749-0720(15)31046-x Andrews, A.H., Blowey, R.W., Boyd, H. and Eddy, R.G. 2004. Bovine Medicine Diseases and Husbandry of Cattle, 2nd ed. Oxford, UK: Blackwell Science Ltd., pp. 1232. Bobe, G., Young, J.W. and Beitz, D.C. 2004. Invited review: pathology, etiology, prevention, and treatment of fatty liver in dairy cows. J. Dairy Sci. 87(10), 3105–3124; doi:10.3168/jds. S0022-0302(04)73446-3 Broom, D. 1993. Assess the welfare of modified or treated animals. Livest. Prod. Sci. 36 (1), 39–54; doi:10.1016/0301-6226(93)90136-6 Burfeind, O., Sepúlveda, P., von Keyserlingk, M.A.G., Weary, D.M., Veira, D.M. and Heuwieser, W. 2010. Technical note: evaluation of a scoring system for rumen fill in dairy cows. J. Dairy Sci. 93 (8), 3635–3640; doi:10.3168/jds.2009-3044 Cameron, R.E.B., Dyk, P.B., Herdt, T.H., Kaneene, J.B., Miller, R., Bucholtz, H.F., Liesman, J.S., Vandehaar, M.J. and Emery, R.S. 1998. Dry cow diet, management, and energy balance as risk factors for displaced abomasum in high producing dairy herds. J. Dairy Sci. 1998, 81 (1), 132–139; doi:10.3168/jds. S0022-0302(98)75560-2 Cavestany, D., Blanc, J.E., Kulcsar, M., Uriarte, G., Chilibroste, P., Meikle, A., Febel, H., Ferraris, A. and Krall, E. 2005. Studies of the Transition Cow under a pasture-based milk production system: Metabolic Profiles. J. Vet. Med. A. 52(1), 1–7; doi:10.1111/j.1439-0442.2004.00679.x Cockcroft, P.D. 2015. Diagnosis and clinical reasoning in cattle practice. Bovine Medicine. 3rd ed. Hoboken, NJ: John Wiley & Sons, pp. 124–132. Coles, E.H. 1986. Veterinary clinical pathology, 4th ed. Philadelphia, PA: W.B. Saunders, pp. 132–139. Constable, P.D., Hinchcliff, K.W., Done, S.H. and Grãnberg, W. 2017. Veterinary Medicine. A textbook of the diseases of cattle, horses, sheep, pigs and goats, 11th ed. Philadelphia, PA: Saunders Elsevier, pp. 1708–1716. Curtis, C.R., Erb, H.N., Sniffen, C.J., Smith, R.D. and Kronfeld, D.S. 1985. Path analysis of dry period nutrition, postpartum metabolic and reproductive disorders, and mastitis in Holstein cows. J. Dairy Sci. 68 (9), 2347–2360; doi:10.3168/jds. S0022-0302(85)81109-7 Detilleux, J.C., Grohn, Y.T. and Quaas, L, 1994. Effects of clinical ketosis on test day milk yields in Finnish Ayrshire cattle. J. Dairy Sci. 77 (11), 3316–3323; doi:10.3168/jds. S0022-0302(94)77272-6 Djokovic, R., amanc, H., Nikolić, Z. and Boković Bogosavljević, S. 2007. Changes in blood vglucose insulin,, and inorganic phosphorus concentrations in healthy and ketotic dairy cows after intravenous infusion of propionate solution. Acta Vet. Brno. 76 (4), 533–539; doi:10.2754/avb200776040533 Dohoo, I.R., Martin, S.W., Meek, A.H. and Sandals, W.C.D. 1984. Disease, production, and culling in Holstein-Friesian cows. I. The data. Prev. Vet. Med. 1 (4), 321–334; doi:10.1016/0167-5877(83)90003-X Đoković, R., Šamanc, H., Petrović, MD, Ilić, Z. and Kurćubić, V. 2012. Relationship between blood metabolites and lipid content in the liver in transitional dairy cows. Biotechnol. Anim. Husb. 28 (4), 705–714. Drackley, J.R. 1999. Biology of dairy cows during the transition period: The final frontier? J. Dairy Sci. 82 (11), 2259–2273; doi:10.3168/jds. S0022-0302(99)75474-3 Duffield, T. and Bagg, R. 2002. Herd level indicators for predicting high-risk dairy herds for subclinical ketosis. Proc. Am. Assoc. Bov. Pract. 35, 175–176; doi:10.21423/aabppro20025035 Duffield, T.F., Sandals, D., Leslie, K.E., Lissemore, K., McBride, B.W., Lumsden, J.H., Dick, P. and Bagg, R. 1998. Effect of prepartum monensin administration in a controlled-release capsule on postpartum energy indicators in lactating dairy cows J. Dairy Sci. 81 (9), 2354–2361; doi:10.3168/jds. S0022-0302(98)70126-2 Duske, K., Hammon, H.M., Langhof, A.K., Bellmann, O., Losand, B., Nurnberg, K., Nurnberg, G., Sauerwein, H., Seyfert, H.M. and Metges, C.C. 2009. Metabolism and lactation performance of dairy cows fed a diet containing rumen-protected fat during the last 12 weeks of gestation. J. Dairy Sci. 92 (4), 1670–1684; doi:10.3168/jds.2008-1543 Dyk, P.B. 1995. The association of prepartum non-esterified fatty acids and body condition with peripartum health problems on 95 Michigan dairy farms. M.S. Thesis, Michigan State University. East Lansing, MI. Eddy, R.G. 2004. Major metabolic disorders. In: Andrews, A.H., Blowey, R.W., Boyd, H., Eddy, R.G. (Eds.), Bovine medicine: diseases and husbandry, 2nd ed. Oxford, UK: Blackwell Science Ltd., pp. 793–795. Edwards, J.L. and Tozer, P.R. 2004. Using activity and milk yield as predictors of fresh cow disorders. J. Dairy Sci. 87 (2), 524–531; doi:10.3168/jds. S0022-0302(04)73192-6 Elmeligy, E., Oikawa, S., Mousa, S.A., Bayoumi, S.A., Hafez, A., Mohamed, R.H., Al-lethie, A.A., Hassan, D. and Khalphallah, A. 2021. Role of insulin, insulin sensitivity, and abomasal function monitoring in the evaluation of therapeutic regimens in ketotic dairy cattle using combination therapy with reference to milk yield rates. Open Vet. J. 11 (2), 228–237; doi:10.5455/OVJ.2021.v11.i2.7 Ferguson, J.D., Galligan, D.T. and Thomsen, N. 1994. Principal descriptors of body condition scores in Holstein cows. J. Dairy Sci. 77, 2695–2703. Fiore, E., Giambelluca, S., Morgante, M., Contiero, B., Mazzotta, E., Vecchio, D., Vazzana, I., Rossi, P., Arfuso, F., Piccione, G. and Gianesella, M. 2017. Changes in some blood parameters, milk composition,, and yield of buffalo (Bubalus bubalis) during the transition period. Anim. Sci. J. 88 (12), 2025–2032; doi:10.1111/asj.12872 Gerloff B.J., Herdt T.H. and Emery R.S. 1986. Relationship of hepatic lipidosis to health and performance in dairy cattle. J. Am. Vet. Med. Assoc. 188 (8), 845–850. Gillund, P., Reksen, O., Grohn, Y.T. and Karlberg, K. 2001. Body conditions related to ketosis and reproductive performance in Norwegian dairy cows. J. Dairy Sci. 84 (6), 1390–1396; doi:10.3168/jds. S0022-0302(01)70170-1 Götze, K., Crivellaro, P., Pieper, L., Engelhard, T. and Staufenbiel, R. 2019. Assessment of rumen fill in dairy cows for evaluation of the individual feed intake in herd management. Tierarztl Prax Ausg G Grosstiere Nutztiere 47 (1), 5–13; doi:10.1055/a-0827-5656 Gröhn, Y.T., Lindberg L.A., Bruss M.L. and Farvar, T.B. 1983. Fatty infiltration in the liver of spontaneously ketotic dairy cows. J. Dairy Sci. 66 (11), 2320–2328; doi:10.3168/jds. S0022-0302(83)82088-8 Grummer, R.R. 1993. Etiology of lipid-related metabolic disorders in periparturient dairy cows. J. Dairy Sci. 76 (12), 3882–3896. DOI: 10.3168/jds. S0022-0302(93)77729-2 Grãnberg, W., Hartmann, H., Burfeind, O., Heuwieser, W. and Staufenbiel, R. 2011. Plasma potassium-lowering effect of oral glucose, sodium bicarbonate and the combination thereof in healthy neonatal dairy calves. J. Dairy Sci. 94 (11), 5646–5655; doi:10.3168/jds.2011-4510 Hayirli, A. 2006. The role of exogenous insulin in the complex of hepatic lipidosis and ketosis associated with insulin resistance in postpartum dairy cattle. Vet. Res. Commun. 30 (7), 749–774; doi:10.1007/s11259-006-3320-6 Hayirli, A., Grummer, R.R., Nordheim, E.V. and Crump, PM, 2002. Animal and dietary factors affecting feed intake during the pre-fresh transition period in Holsteins. J. Dairy Sci. 85 (12), 3430–3443; doi:10.3168/jds. S0022-0302(02)74431-7 Herdt, T.H. 1988. Fatty liver in dairy cows. North Am. Food Anim. Pract. 4 (2), 269–287 ; doi:10.1016/s0749-0720(15)31048-3 Herdt, T.H. 2000. Variability characteristics and test selection in herd-level nutritional and metabolic profile testing. Vet. Clin. Food Anim. 16 (2), 387–403; doi:10.1016/s0749-0720(15)30111-0 Herdt, T.H., Dart, B. and Neuder, L, 2001. Will large dairy herds revive metabolic profile testing? Proc. Am. Assoc. Bov. Pract. 34, 27–34; doi:10.21423/aabppro20015173 Holtenius, P. and Holtenius, K. 1996. New aspects of ketone bodies in energy metabolism of dairy cows: A Review. J. Vet. Med. A. 43 (10), 579–587; doi:10.1111/j.1439-0442.1996.tb00491.x Hulsen, J. 2007. Cow signals. How to understand the speech of cows. Praha: Profi Press s.r.o., . Hutjens, M. 1996. Manurology 101. Dairy Today, pp. 26. Ingvartsen, K.L., Dewhurst, R.J. and Friggens, N.C. 2003. Regarding the relationship between lactational performance and health: is it yield or metabolic imbalance the cause of production diseases in dairy cattle? A position paper. Livest. Prod. Sci. 83 (2–3), 277–308; doi:10.1016/S0301-6226(03)00110-6 Itoh, H., Tamura, K., Motoi, Y. and Kawawa, F. 1997. Serum apolipoprotein B100 concentrations in healthy and diseased cattle. J. Vet. Med. Sci. 59 (7), 587–591; doi:10.1292/jvms.59.587 Itoh, N., Koiwa, M., Hatsugaya, A., Yokota, H., Taniyama, H., Okada, H. and Kudo, K. 1998. Comparative analysis of blood chemical values in primary ketosis and abomasal displacement in cows. Zentralbl Veterinarmed. 45 (5) 293–298; doi:10.1111/j.1439-0442.1998.tb00830.x Iwersen, M., Falkenberg, U., Voigtsberger, R., Forderung, D. and Heuwieser, W. 2009. Evaluation of an electronic cowhide test to detect subclinical ketosis in dairy cows. J. Dairy Sci. 92 (6), 2618–2624; doi:10.3168/jds.2008-1795. Jackson, P.G.G. and Cockcroft, P.D. 2002. Clinical Examination of Farm Animals, 1st ed. Ames, IA: Wiley-Blackwell Science Ltd., State Avenue, pp. 301–305. Janovick Guretzky, N.A., Carlson, D.B., Garrett, J.E. and Drackley, J.K. 2006. Lipid metabolite profiles and milk production in Holstein and Jersey cows fed rumen-protected choline during the periparturient period. J. Dairy Sci. 89 (1), 188–200; doi:10.3168/jds.S0022-0302(06)72083-5 Jonas, A. 1998. Regulation of lecithin: cholesterol acyltransferase activity. Progress in Lipid Research. 37 (4), 209–234; doi:10.1016/S0163-7827(98)00007-1 Kaneko, J.J., Harvey, J.W. and Bruss, M.L. 2008. Clinical biochemistry of domestic animals, 6th ed. Philadelphia, PA: Saunders Elsevier, pp. 305, 844, 882, 885. Khalphallah, A., Aamer, A.A., AbdelAll, T., Elmeligy, E., Oikawa, S. and Nakada, K. 2018a. Changes in clinical and blood lipid metabolism parameters in Holstein dairy cattle during the transition period. Bulg. J. Vet. Med. 21 (4), 420–428; doi:10.15547/bjvm.1080 Khalphallah, A., Aamer, A.A., AbdelAll, Th., Katoh, H., Oikawa, S., Nakada, K. and Elmeligy, E. 2015. Assessment of Insulin and insulin resistance in dairy cattle with displaced abomasum before and after surgery. Sch. Adv. Anim. Vet. Res. 2 (3), 162–176. Khalphallah, A., Aamer, A.A., Oikawa, S., Nakada, K., AbdelAll, Th., Katoh, H. and Elmeligy, E. 2016b. Diagnostic and prognostic significance of lipid profiles in holstein dairy cattle with displaced abdominal cattle: before and after surgical operation. J. Adv. Vet. Res. 6 (1), 7–17. Khalphallah, A., Elmeligy, E. and Elsayed, H.K. 2016a. Oikawa South Herd health monitoring of dairy cows with displaced abomasum. Sch. J. Agric. Vet. Sci. 3(6), 402–405; doi:10.21276/sjavs.2016.3.6.1 Khalphallah, A., Elmeligy, E., Aamer, A.A., AbdelAll, Th., Oikawa, S. and Nakada, K. 2018b. Diagnostic and prognostic significance of Serum Gastrin and pepsinogen in Displaced abomasum dairy Cows. Bulg. J. Vet. Med. 21 (1), 67–75. Khalphallah, A., Elmeligy, E., Al-Daek, T., Hussein, H.A., Mohamed, R.H., Sabra, M.S., Zakaria, A.M., Khalifa, M.I., Mohammed, H.H., Khesruf, K.A., Ghallab, R.S. 2023. Comparative study between efficacy of dexamethasone-prostaglandin-receptal combination and mechanical correction in uterine torsion cases in Egyptian buffalo-cows (Bubalus bubalis). BMC Vet. Res. 19 (1), 92; doi:10.1186/s12917-023-03651-y Khalphallah, A., Elsayed, H.K., Elmeligy, E., Oikawa, S. and Nakada, K. 2016c. Changes in serum lecithin:cholesterol acyltransferase and apolipoprotein B-100 in dairy cattle either with 1-7 Days in milk displaced abomasum or with 8-21 Days in milk displaced abomasum. Res. Opin. Anim. Vet. Sci. 6 (8), 224–228. Kronfeld, D.S. 1965. Plasma nonesterified fatty acid concentrations in the dairy cow: responses to nutritional and hormonal stimuli, and significance in ketosis. Vet. Rec. 77, 30–34. Madreseh-Ghahfarokhi, S., Dehghani-Samani, A. and Dehghani-Samani, A. 2018. Ketosis (acetonaemia) in dairy cattle farms: practical guide based on importance, diagnosis, prevention and treatments. J. Dairy Vet. Anim. Res. 7 (6), 299”302; doi:10.15406/jdvar.2018.07.00230 Markusfeld, O. 1985. Relationship between overfeeding, metritis and ketosis in high yielding dairy cows. Vet. Rec. 116 (18), 489–491; doi:10.1136/vr.116.18.489 McArt, J.A., Nydam, D.V., Ospina, P.A. and Oetzel, G.R. 2011. A field trial on the effect of propylene glycol on milk yield and resolution of ketosis in fresh cows diagnosed with subclinical ketosis. J. Dairy Sci. 94 (12), 6011–6020; doi:10.3168/jds.2011-4463 McArt, J.A.A., Nydam, D.V. and Oetzel, G.R. 2012. Epidemiology of subclinical ketosis in early lactation dairy cattle. J. Dairy Sci. 95 (9), 5056–5066; doi:10.3168/jds.2012-5443 McCance, K.L. and Huether, S.E. 1994. Alterations in hormonal regulation. Pathophysiology, 2nd ed. Mosby, St. Louis, MO, USA, pp. 674–692. Melendez, P., Risco, C.A., Donovan, G.A., Littell, R. and Goff., J.P. 2003. Effects of calcium-energy supplements on calving-related disorders, fertility, and milk yield during the transition period in cows fed anionic salts. Theriogenology 60(5), 843–854; doi:10.1016/s0093-691x(03)00103-1 Miettinen, P.V. 1990. Metabolic balance and reproductive performance in Finnish dairy cows. Zentralbl Veterinarmed A. 37 (6), 417–424; doi:10.1111/j.1439-0442.1990.tb00923.x Miettinen, P.V., Rainio, V.A., Kukkonen, S.A. and Setãlã, J.J. 1991. Finnish dairy cows: energy balance and seasonal variation in fertility. Zentralbl Veterinarmed A. A 38 (6), 427–4320; doi:10.1111/j.1439-0442.1991.tb01031.x Moore, D.A. and Ishler, V. 1997. Managing dairy cows during the transition period: focus on ketosis. Veterinary Medicine 92 (12), 1061–1072 Morrow, D.A. 1976. Fat cow syndrome. J. Dairy Sci. 59 (9), 1625–1629; doi:10.3168/jds. S0022-0302(76)84415-3 Morrow, D.A., Hillman, D., Dade, A.W. and Kitchen, H. 1979. Clinical investigation of a dairy herd with the fat cow syndrome. J. Am. Vet. Med. Assoc. 174 (2), 161–167. Moyes, K.M., Larsen, T., Friggens, N.C., Drackley, J.K. and Ingvartsen, K.L. 2009. Identification of potential blood markers for the development of subclinical and clinical mastitis in dairy cattle at parturition and during early lactation. J. Dairy Sci. 92 (11), 5419–5428; doi:10.3168/jds.2009-2088 Nakagawa, H. and Katoh, N. 1998. Reduced activity of lecithin:cholesterol acyltransferase in the serum of cows with ketosis and left displacement of the abomasum. Vet. Res. Commun. 22 (8), 517–524; doi:10.1023/a:1006189603071. Nakagawa, H. and Katoh, N. 2000. Reduction in serum lecithin: cholesterol acyltransferase activity prior to the occurrence of ketosis and milk fever in cows. J. Vet. Med. Sci. 62 (12), 1263–1267; doi:10.1292/jvms.62.1263 Oetzel, G.R. 2003. Herd-based biological testing for metabolic disorders. Preconvention Seminar 7. Am. Assoc. Bov. Pract. 36, 1–16. Oetzel, G.R. 2007. Herd-Level Ketosis: Diagnosis and Risk Factors. American association of bovine practitioners 40th Annual Conference, September 19, 2007–Vancouver, BC, Canada. Ohwada, S., Oikawa, S., Mori, F., Koiwa, M., Nitanai, A., Kurosawa, T. and Sato, H. 2002. Serum pepsinogen levels in healthy cows and their diagnostic significance with abomasal diseases. Journal of Rakuno Gakuen University, 26(2), 289–293. Oikawa, S. and Katoh, N. 2002. Decreases in apolipoprotein B-100 and A-I concentrations in cows with milk fever and downer cows. Can. J. Vet. Res. 66 (1), 31–34. Oikawa, S., Katoh, N., Kawawa, F. and Yasushi, O. 1997. Decreased serum apolipoprotein B-100 and A-I concentrations in cows with ketosis and left displacement of the abomasum. Am. J. Vet. Res. 58 (2), 21–125. Opsomer, G., Gröhn, Y.T., Hertl, J., Coryn, M., Deluyker, H. and de Kruif, A. 2000. Risk factors for post partum ovarian dysfunction in high producing dairy cows in Belgium: a field study. Theriogenology 53(4), 841–857. doi: 10.1016/S0093-691X(00)00234-X Pande, N., Agrawal, R., Shrivastava, O. and Swamy, M. 2016. Alterations in the hematometabolic status and body condition score of buffaloes during the transition period. Livestock Sci. 7, 122–125. Quiroz-Rocha, G.F., LeBlanc, S.J., Duffield, T.F., Wood, D., Leslie, K.E. and Jacobs, R.M. 2009. Reference limits for biochemical and hematological analytes of dairy cows one week before and one week after parturition. Can. Vet. J. 50 (4), 383–388. Radostits, O.M., Gay, C.C., Blood, D.C. and Hinchcliff, K.W. 2000. Veterinary medicine: a textbook of the diseases of cattle, sheep, pigs, goats and horses, 9th ed. London, UK: W. B. Saunders, pp. 1819–1822. Radostits, O.M., Gay, C.C., Hinchcliff, K.W. and Constable, P.D. 2007. Veterinary medicine. A Textbook of the diseases of cattle, horses, sheep, pigs, and goats, 10th ed. Philadelphia, PA: Saunders Elsevier, pp. 3–37, 1661–1668. Robert West. 2013. Manure scoring determines supplementation needs. The Samuel Roberts Noble Foundation. Available via http://www.noble.org/ag/livestock/manure- scoring/2013. Sakai, T., Hayakawa, T., Hamakawa, M., Ogura, K. and Kubo, S. 1993. Therapeutic effects of simultaneous glucose and insulin administration in ketotic dairy cows. J. Dairy Sci. 76 (1), 109–114; doi:10.3168/jds. S0022-0302(93)77329-4 Sakha, M., Ameri, M. and Rohbakhsh, A. 2006. Changes in blood β-hydroxybutyrate and glucose concentrations during dry and lactation periods in Iranian Holstein cows. Comp. Clin. Pathol. 15 (4), 221–226; doi:10.1007/s00580-006-0650-2 Sakha, M., Ameri, M., Sharifi, H. and Taheri, I. 2007. Bovine Subclinical Ketosis in Dairy Herds in Iran. Vet. Res. Commun. 31 (6), 673–679; doi:10.1007/s11259-007-0053-0 Satoh, H., Chisato, K., Fukumori, R., Tharwat, M. and Oikawa, S. 2024. A case–control study on the usefulness of serum lecithin: cholesterol acyltransferase activity as a predictor of retained placenta in close-up dairy cows. Animals 14 (24), 3640; doi:10.3390/ani14243640 Shaw, J.C. 1956. Ketosis in dairy cattle. A review. Dairy Sci. 39 (4), 402–434; doi:10.3168/jds. S0022-0302(56)94765-8 Shpigel, N.Y., Chen, R., Avidar, Y. and Bogin, E., 1996. Use of corticosteroids alone or combined with glucose to treat ketosis in dairy cows. J. Am. Vet. Med. Assoc. 208 (10), 1702–1704. Sundrum, A. 2015. Metabolic disorders in the transition period indicate that the dairy cows’ ability to adapt is overstressed. Animals (Basel). 5 (4), 978–1020; doi:10.3390/ani5040395 Tehrani-Sharif, M., Hadadi, M., Noughabi, H.H., Mohammadi, A., Rostami, F. and Sharifi, H. 2012. Bovine subclinical ketosis in dairy herds in Nishaboor, Iran. Comp. Clin. Pathol. 21 (6), 1637–1641; doi:10.1007/s00580-011-1340-2 Tharwat, M., Endoh, D. and Oikawa, S. 2012. Hepatocyte apoptosis in dairy cows with fatty infiltration of the liver. Res. Vet. Sci. 93 (3), 1281–1286; doi:10.1016/j.rvsc.2012.03.011 Tufani, N.A., Hafiz, A., Muhee, A. and Makhdoomi, D.M. 2011. Therapeutic management of ketosis in bovine. Indian J. Vet. Med. 31 (1), 38–39. Van den Top, AM, Van Tol, A., Jansen, H., Geelen, M.J. and Beynen, A.C. 2005. Fatty liver in dairy cows postpartum is associated with decreased plasma triacylglycerol concentrations and decreased lipoprotein lipase activity in adipocytes. Dairy Res. 72 (2), 129–137; doi:10.1017/s0022029905000774 Whitaker, D.A., Kelly, J.M. and Smith, E.J. 1983. Subclinical ketosis and serum beta-hydroxybutyrate levels in dairy cattle. Br Vet. J. 1983;139 (5), 462–463; doi:10.1016/s0007-1935(17)30393-7 Zadnik, T. 2003. A comparative study of hematobiochemical parameters between clinically healthy cows and cows with displacement of the abomasum. Acta Veterinaria (Beograd) 53 (5–6), 297–309; doi:10.2298/AVB0306297Z | ||
| How to Cite this Article |
| Pubmed Style Khalphallah A, Almuhanna AH, Abdulkarim A, Khesruf KA, Abdelhafez EA, El-deeb W, Mohamed RH, Almubarak AI, Mousa SA, Saber M, Abdel-lah ES, Elmeligy E. Diagnostic significance of clinical scoring system and serum lipid profiles as recovery indicators in ketotic dairy cattle using hormonal-steroids-carbohydrates therapeutic protocol. Open Vet. J.. 2025; 15(4): 1719-1733. doi:10.5455/OVJ.2025.v15.i4.24 Web Style Khalphallah A, Almuhanna AH, Abdulkarim A, Khesruf KA, Abdelhafez EA, El-deeb W, Mohamed RH, Almubarak AI, Mousa SA, Saber M, Abdel-lah ES, Elmeligy E. Diagnostic significance of clinical scoring system and serum lipid profiles as recovery indicators in ketotic dairy cattle using hormonal-steroids-carbohydrates therapeutic protocol. https://www.openveterinaryjournal.com/?mno=236350 [Access: January 25, 2026]. doi:10.5455/OVJ.2025.v15.i4.24 AMA (American Medical Association) Style Khalphallah A, Almuhanna AH, Abdulkarim A, Khesruf KA, Abdelhafez EA, El-deeb W, Mohamed RH, Almubarak AI, Mousa SA, Saber M, Abdel-lah ES, Elmeligy E. Diagnostic significance of clinical scoring system and serum lipid profiles as recovery indicators in ketotic dairy cattle using hormonal-steroids-carbohydrates therapeutic protocol. Open Vet. J.. 2025; 15(4): 1719-1733. doi:10.5455/OVJ.2025.v15.i4.24 Vancouver/ICMJE Style Khalphallah A, Almuhanna AH, Abdulkarim A, Khesruf KA, Abdelhafez EA, El-deeb W, Mohamed RH, Almubarak AI, Mousa SA, Saber M, Abdel-lah ES, Elmeligy E. Diagnostic significance of clinical scoring system and serum lipid profiles as recovery indicators in ketotic dairy cattle using hormonal-steroids-carbohydrates therapeutic protocol. Open Vet. J.. (2025), [cited January 25, 2026]; 15(4): 1719-1733. doi:10.5455/OVJ.2025.v15.i4.24 Harvard Style Khalphallah, A., Almuhanna, . A. H., Abdulkarim, . A., Khesruf, . K. A., Abdelhafez, . E. A., El-deeb, . W., Mohamed, . R. H., Almubarak, . A. I., Mousa, . S. A., Saber, . M., Abdel-lah, . E. S. & Elmeligy, . E. (2025) Diagnostic significance of clinical scoring system and serum lipid profiles as recovery indicators in ketotic dairy cattle using hormonal-steroids-carbohydrates therapeutic protocol. Open Vet. J., 15 (4), 1719-1733. doi:10.5455/OVJ.2025.v15.i4.24 Turabian Style Khalphallah, Arafat, Abdulaziz H. Almuhanna, Abdulrahman Abdulkarim, Khaled A. Khesruf, Enas A. Abdelhafez, Wael El-deeb, Ragab H. Mohamed, Adel I. Almubarak, Sabry A. Mousa, Mahmoud Saber, Ebtsam S. Abdel-lah, and Enas Elmeligy. 2025. Diagnostic significance of clinical scoring system and serum lipid profiles as recovery indicators in ketotic dairy cattle using hormonal-steroids-carbohydrates therapeutic protocol. Open Veterinary Journal, 15 (4), 1719-1733. doi:10.5455/OVJ.2025.v15.i4.24 Chicago Style Khalphallah, Arafat, Abdulaziz H. Almuhanna, Abdulrahman Abdulkarim, Khaled A. Khesruf, Enas A. Abdelhafez, Wael El-deeb, Ragab H. Mohamed, Adel I. Almubarak, Sabry A. Mousa, Mahmoud Saber, Ebtsam S. Abdel-lah, and Enas Elmeligy. "Diagnostic significance of clinical scoring system and serum lipid profiles as recovery indicators in ketotic dairy cattle using hormonal-steroids-carbohydrates therapeutic protocol." Open Veterinary Journal 15 (2025), 1719-1733. doi:10.5455/OVJ.2025.v15.i4.24 MLA (The Modern Language Association) Style Khalphallah, Arafat, Abdulaziz H. Almuhanna, Abdulrahman Abdulkarim, Khaled A. Khesruf, Enas A. Abdelhafez, Wael El-deeb, Ragab H. Mohamed, Adel I. Almubarak, Sabry A. Mousa, Mahmoud Saber, Ebtsam S. Abdel-lah, and Enas Elmeligy. "Diagnostic significance of clinical scoring system and serum lipid profiles as recovery indicators in ketotic dairy cattle using hormonal-steroids-carbohydrates therapeutic protocol." Open Veterinary Journal 15.4 (2025), 1719-1733. Print. doi:10.5455/OVJ.2025.v15.i4.24 APA (American Psychological Association) Style Khalphallah, A., Almuhanna, . A. H., Abdulkarim, . A., Khesruf, . K. A., Abdelhafez, . E. A., El-deeb, . W., Mohamed, . R. H., Almubarak, . A. I., Mousa, . S. A., Saber, . M., Abdel-lah, . E. S. & Elmeligy, . E. (2025) Diagnostic significance of clinical scoring system and serum lipid profiles as recovery indicators in ketotic dairy cattle using hormonal-steroids-carbohydrates therapeutic protocol. Open Veterinary Journal, 15 (4), 1719-1733. doi:10.5455/OVJ.2025.v15.i4.24 |

