


| Research Article | ||
Open Vet. J.. 2025; 15(4): 1673-1684 Open Veterinary Journal, (2025), Vol. 15(4): 1673-1684 Research Article Assessment of the hematological profile and pathohistological changes in hepatic and renal tissue in adult rats exposed to different dietary componentsNadža Kapo-Dolan1*, Dina Kapić2, Esad Ćosović2, Elmir Čičkušić3,4, Aida Bešić1, Nedim Čović5, Nedžad Hadžiomerović6, Amir Zahirović1 and Muhamed Katica11Department of Clinical Veterinary Sciences, Veterinary Faculty, University of Sarajevo, Sarajevo, Bosnia and Herzegovina 2Department of Histology and Embryology, Faculty of Medicine, University of Sarajevo, Sarajevo, Bosnia and Herzegovina 3Department of Pathology, Faculty of Medicine, University of Tuzla, Tuzla, Bosnia and Herzegovina 4Clinic for Pathology, University Clinical Center Tuzla, Tuzla, Bosnia and Herzegovina 5Department of Transformational Processes in Sport, Faculty of Sport and Physical Education, University of Sarajevo, Sarajevo, Bosnia and Herzegovina 6Department of Basic Veterinary Medicine Sciences, Veterinary Faculty, University of Sarajevo, Sarajevo, Bosnia and Herzegovina *Corresponding Author: Nadža Kapo-Dolan. Department for Clinical Veterinary Sciences, Veterinary Faculty, University of Sarajevo, Sarajevo, Bosnia and Herzegovina. Email: nadzakapo [at] gmail.com Submitted: 16/12/2024 Accepted: 20/03/2025 Published: 30/04/2025 © 2025 Open Veterinary Journal
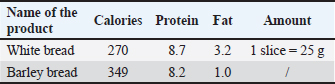
AbstractBackground: Different dietary components can affect hematological and biochemical profiles, potentially causing pathohistological changes in liver and kidney tissue. Aim: The animals in the experiment consumed various bakery and meat products, and ultimately, the potential effects on hematological, biochemical, and pathological parameters were evaluated. Methods: The study involved 24 clinically healthy adult rats, randomized into three groups of eight rats each, as follows: rats that consumed meat products (group M), rats that consumed bakery products (group H), and a control group that consumed conventional rodent food (group K) for 7 weeks. After 7 weeks, hematological and biochemical blood analyses were conducted along with pathohistological examinations of the liver and kidneys. Results: Significant differences (p < 0.05) were observed among groups for several hematological and biochemical parameters, including creatinine (CREA), urea, blood urea nitrogen /CREA, calcium, alanine transaminase, alkaline phosphatase, and lipase. Consuming meat products had a less favorable impact on the occurrence of kidney function disorders. Group H exhibited significant differences in leukocyte and platelet counts compared with groups M and K. Extreme echinocytosis was recorded in group M, whereas sideropenic anemia was prominent in group H. Analysis of the livers of rats in groups K and H did not show significant differences in the observed parameters (gamma-glutamyl transferase and total bilirubin), whereas group M had a significantly higher degree of hepatocyte degeneration and steatosis, and the observed infiltrate was also more pronounced, but not significantly. The kidneys of group M showed discrete alterations of the microstructure, i.e., slightly increased cellularity of renal corpuscles and hypertrophy of proximal nephrocyte, whereas the kidney tissue of group K had a regular appearance. Conclusion: Consuming meat products was associated with adverse liver and kidney changes, whereas bakery products led to sideropenic anemia and altered hematological values. Keywords: Adult rat, Bakery products, Echinocyte, Kidney, Liver, Meat Products. IntroductionThe role of nutrition in maintaining and improving the health status of laboratory rats is a significant area of research in veterinary medicine. Particular attention should be paid to examining the effects of different dietary components on hematological and biochemical parameters, which are key indicators of physiological and pathological conditions in humans and animals (Ihedioha , 2008). The laboratory rat (Rattus norvegicus) is widely used in experimental studies because of its opportunistic, omnivorous diet, and the similarity of its alimentary tract to humans. These characteristics place it among the preferred animal models, enabling biomedical researchers to better understand specific pathophysiological conditions (Katica and Delibegović, 2019; Hadžiomerović et al., 2025). The laboratory rats fed a diet of various food products, including bakery and meat products, as well as commercial pelleted food, showed different effects on hematological and biochemical parameters, as well as on vital organs, such as the kidneys and liver (Menkinoska and Gjorgoski, 2012; Konieczka et al., 2017; Katica and Gradaščević, 2017; Perić Kačarević, 2017; Arbo et al., 2018; Ranković, 2018; Žymantiene et al., 2018). Katica and Gradaščević (2017) pointed out that bakery products can lead to sideropenic hypochromic anemia in laboratory rats, whereas folic acid and iron supplements in bread have a favorable effect on the number of red blood cells (RBCs)/erythrocytes (Menkinoska and Gjorgoski, 2012). The role of essential nutrients in meat products is also crucial for health, given their content of essential fatty acids, B-complex vitamins, and minerals, which contribute to immune and metabolic functions (Vuković, 2006). For example, enrichment of chicken meat with omega-3 polyunsaturated fatty acids and vitamin E maintained normal hematological parameters in Wistar rats (Konieczka et al., 2017). On the other hand, a diet rich in fat can lead to changes in the lipid status of offspring, as shown in the research by Perić Kačarević (2017). By studying hematological and biochemical parameters, early detection of metabolic disorders and assessment of health risks are possible, which is an important component in researching the effects of nutrition on laboratory animals and their use as models for human and animal populations. The aim of the study was to determine the effects of consuming meat and bakery products by monitoring the hematological profile of experimental animals, as well as the possible changes in the liver and kidneys that may be caused. Materials and MethodsAnimal modelIn the research, 24 clinically healthy adult rats were used, of both sexes, the Wistar strain, aged 2–3 months, average weight of 180–250 g. The rats had free access to food and water provided during the experiment and 12-hour rotations of light and darkness. The air temperature was between 20°C and 23°C and the humidity was 60% ± 10% (Katica and Gradaščević, 2017). General experimental procedure and study groupsThe 24 rats were randomly divided into three groups: Group H (8 rats), received bakery products, Group M (8 rats) received meat products, and Group K (8 rats) received conventional rodent food. The animals were fed their respective diets for 7 weeks (49 days). Food used in the diet of experimental animalsBakery products Experimental group H consumed bakery products, including dried bread, pastries, pasta, and other domestic confectionery products, produced by a local bakery (Table 1). Table 1. Nutrient content of common carbohydrate and fiber sources (Hand et al., 2010).
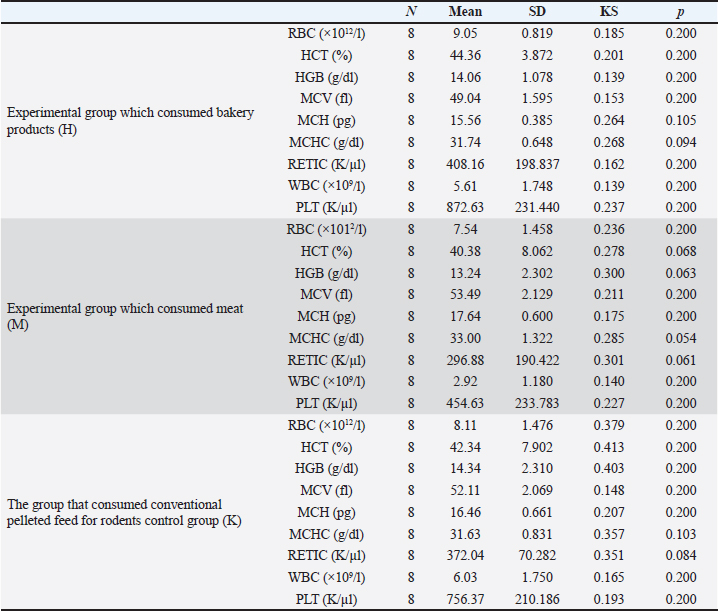
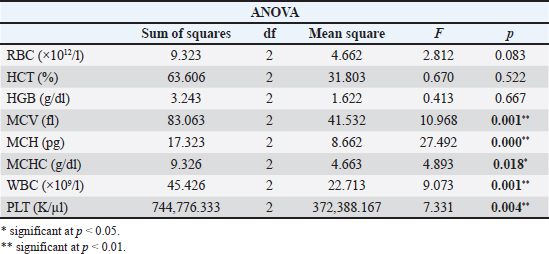
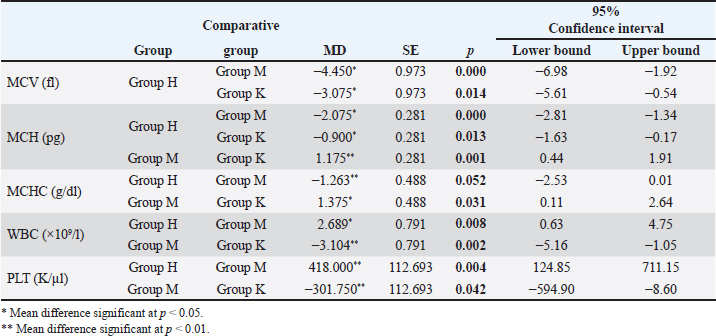
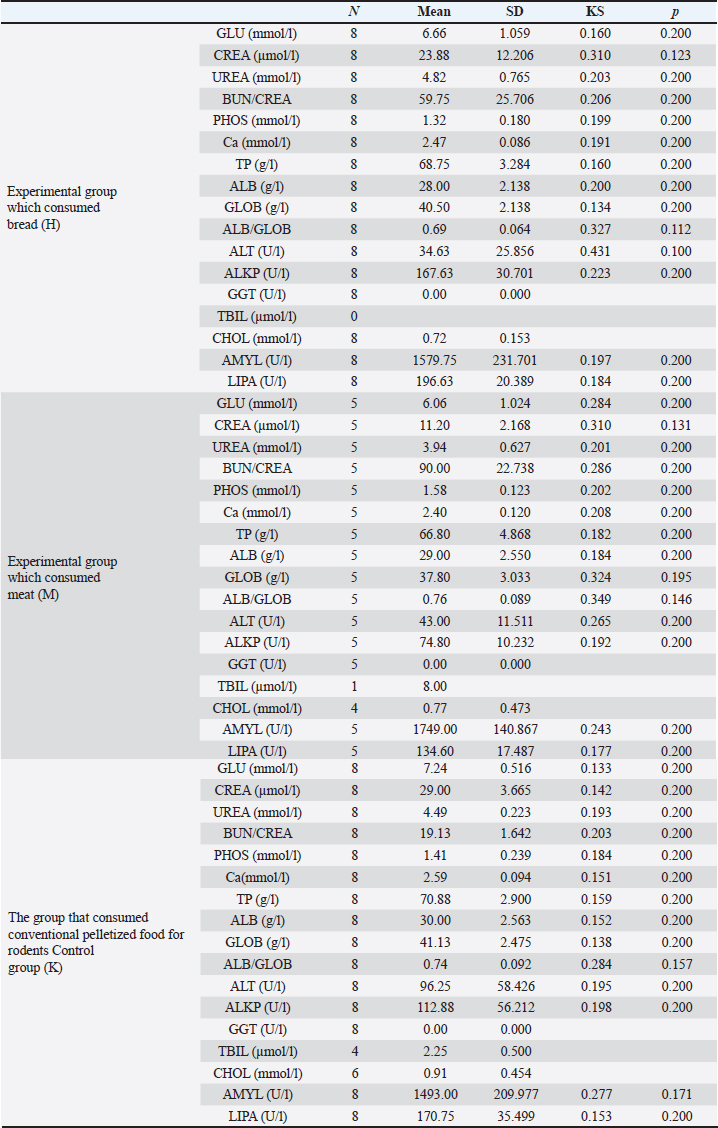
Meat products The experimental group M consumed only meat products, consisting of both fresh and thermally processed beef, mutton, and pork. The protein content of meat products ranged from 16% to 24%, with lean beef, pork, and mutton containing 18%–21%. The fat content varied according to several factors. For example, pork meat typically contains 3%–35% fat, pork meat is up to 50% fat, and beef meat is 3%–24% fat (Vuković, 2006). Briquetted feed mixture (conventional food for rodents) A commercial pelletized mix brand Versele-Laga, Allround mix was used in this study. The product contains a variety of grains (wheat, barley, oats, corn, rice, millet, and sorghum), legumes (alfalfa, peas, soybeans, and linseed), vegetable-based proteins, oils, fiber, and essential minerals (Versele-Laga, n.d.). Study designHematological and biochemical procedures On the forty-ninth day of the experiment, peripheral blood samples were collected via tail vein puncture using 3-ml EDTA vacutainers. The puncture site was previously disinfected with standard disinfectants. Analysis of hematological parameters was determined using an “IDEXX LaserCyte” and the parameters determined were as follows: number of RBC (1012/l), hemoglobin (Hb) content (g/l), hematocrit (HCT) value (%), mean value of erythrocyte volume mean corpuscular volume (MCV) (fl), mean value of Hb concentration mean corpuscular hemoglobin (MCH) (pg), mean value of Hb concentration in erythrocyte mean corpuscular hemoglobin concentration (MCHC) (g/dl), total number of leukocytes white blood cells (WBC) (109/l), and platelet count Platelets (PLT) (109/l). The biochemical parameters of the blood serum of the tested rats were determined using the “IDEXX Laser Cyte”device device. We used non-hemolyzed serum, which was obtained by centrifuging the whole blood of the tested rats using a macrocentrifuge for 3 minutes, at 10,000 revolutions per minute. The following parameters were determined: glucose (GLU) (mmol/l), creatinine (CREA) (μmol/l), urea (UREA) (mmol/l), the ratio of nitrogen in UREA with blood urea nitrogen (BUN)/CREA/CREA, phosphorus (PHOS) (mmol/l), calcium (Ca) (mmol/l), total protein (TP) (g/l), albumin (ALB) (g/l), globulin (GLOB) (g/l), ALB/GLOB, alanine transaminase (ALT) (U/l), alkaline phosphatase (ALKP) (U/l), gamma-glutamyl transferase (GGT) (U/l), total bilirubin (TBIL) (μmol/l), cholesterol (CHOL) (mmol/l), amylase (AMYL) (U/l), and lipase (LIPA) (U/l). Leukocyte subtypes were differentiated, and the percentages of each leukocyte subtype were determined after analyzing 1,000 cells. Differentiated: lymphocytes (L) (%), monocytes (M) (%), neutrophils (N) (%), basophils (B) (%), and eosinophils (E) (%). Values are shown in percentages (Katica et al., 2019; Bajrić et al., 2020). Quantification of poikilocytotic RBCs Blood smears of peripheral blood were made, dried in air, and stained using the Giemsa method. The samples were processed according to standard technical laboratory procedures. Poikilocytes were classified semiquantitatively (Christopher et al., 2014) using the following criteria: absent (0%), rare (0.05%–0.5%), mild (>0.5%–3%), moderate (>3%–10%), and pronounced (>10%). In each original-stained smear, 2,000 RBCs were counted and characterized at a microscopic magnification of 1,000×. Poikilocytes were defined on the basis of standard morphology, and counting was limited to representative monolayer fields in which approximately half of the RBCs touched but did not overlap. The number and type of poikilocytes were recorded and expressed as a percentage of the RBCs. Pathohistological examination of the liver and kidney Liver and kidney tissue samples from 24 Wistar rats were fixed using the standard method in 5% buffered formalin. Microscopic analysis was performed to assess the presence of hepatocyte degeneration, steatosis, portal inflammation, and intralobular inflammation in liver tissue sections from paraffin blocks with a thickness of 5 μm and stained with the standard hematoxylin-eosin (H&E) method. Hepatocyte degeneration was graded as follows: absent (0), mild in one-third of liver lobules (1), moderate in two-thirds of lobules (2), and severe in more than two-thirds of lobules (3). Steatosis was graded as follows: absent (0), mild”present in 1%–33% of hepatocytes (1), moderate” present in 34%–66% of hepatocytes (2), and severe” present in >66% of hepatocytes (3). Portal inflammation was graded as follows: absent (0), mild” sparse infiltrate in one-third of the portal spaces (1), moderate”moderate infiltrate in two-thirds of the portal spaces (2), and severe”dense infiltrate in more than two-thirds of the portal spaces (3). Intralobular and portal inflammation were graded using the same scale. Sections 5 μm thick were obtained from paraffin blocks with kidney tissue, stained with H&E, and subjected to qualitative and morphometric analysis. Statistical data processing All variables are presented as mean values and standard deviations of the measured values of hematological and biochemical blood parameters. The homogeneity of variance was determined using Levene’s test. The normality of the distribution was assessed using the Kolmogorov–Smirnov (KS) test. The significance of the resulting differences in hematological and biochemical parameters was evaluated using the analysis of variance test (two-way ANOVA). Individual comparative differences between groups were determined using the Bonferroni test. Analysis of differences between groups for variables where the normality of distribution was not determined was performed using the Mann–Whitney U test and the Kruskal–Wallis H test. Data analysis was done using SPSS software (version 21.0. IBM). The level of statistical significance was set at p < 0.05. Ethical approval This study was approved by the Ethics Committee of the Veterinary Faculty of the University of Sarajevo, who gave a positive opinion under number: 07-03-367-2/22, from 28.04.2022. ResultsAnalysis of hematological parametersFor all the variables of blood parameters for all three groups, on the basis of the results of the KS test, the existence of a normal data distribution is evident. Such data can be used for further operationalization. Table 2 shows the mean values and standard deviations for all three groups. From the results in Table 3, it can be concluded that there are statistically significant differences (p < 0.05) between the groups of respondents for the variables MCV, MCH, MCHC, WBC, and PLT. Other values did not differ significantly according to the results (Table 3). The Bonferroni test of individual differences (Table 4) between the three groups of subjects for the variables of hematological parameters showed that after the experiment, in the subjects in the group that consumed bakery products, group H, the MCV was significantly lower compared to the group that consumed meat products, group M. (MD=–4.45, p < 0.001) and control group K that consumed pelleted feed K (MD=–3.08, p=0.014), MCH compared to group M (MD=–2.08, p < 0.001) and control group K (MD=–0.9, p=0.013), MCHC compared to group M, (MD=–1.26, p=0.052). Group H had higher results for the WBC variable than group M, (MD=2.97, p=0.031) and for the variable PLT (MD=418.0, p=0.004). Group M had significantly higher results for the variable MCH compared to the control group K (MD=1.18, p=0.001) and for the variable MCHC (MD=1.38, p=0.031), while it had lower values for WBC compared to control K (MD=–3.10, p=0.002) and PLT (MD=–301.8, p=0.042). Quantification of poikilocytotic RBCs and leukogram (%)The results of the determined poikilocytic forms of RBC are presented in Table 5. Table 2. Descriptive statistics, the KS test, and blood parameters were obtained from all three groups of rats tested in the study.
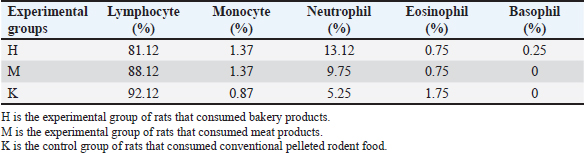
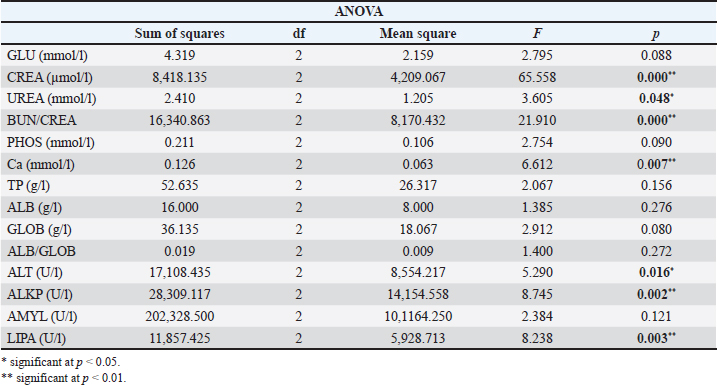
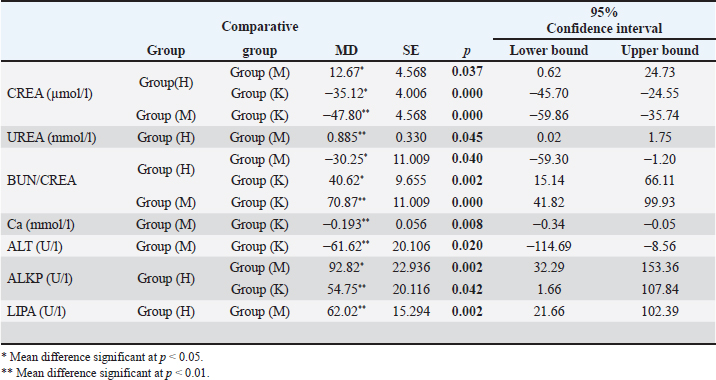
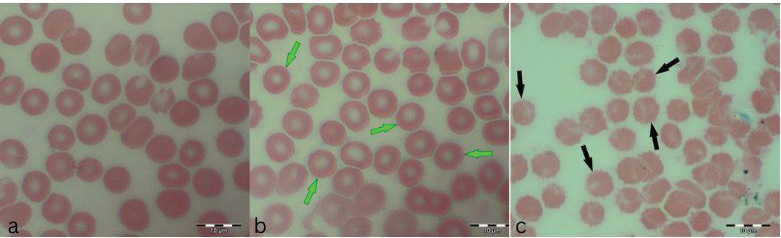
Images in Figure 1 illustrate the various poikilocytotic forms that were quantified. The leukogram results are presented in Table 6. Analysis of serum biochemistry parametersFor all variables of biochemical parameters of blood serum for all three groups of rats in the experiment, from the results of the KS test, the existence of a normal data distribution is visible. Such data can be used for further operationalization. Table 7 shows the mean values and standard deviations for all three groups. The variables GGT, TBIL, and CHOL were not included in the analysis due to the absence of normal distribution. As shown in Table 8, it may be concluded that there are statistically significant differences (p < 0.05) between the groups of respondents for the variables CREA, UREA, BUN/CREA, Ca, ALT, ALKP, and LIPA. Other variables did not differ significantly in terms of results. The Bonferroni test of individual differences (Table 9 between the three tested groups for the values of biochemical parameters showed that after the experiment there were significant differences in the following parameters: CREA”(Group H)>(Group M) (MD=12.7, p=0.037), <(Group K), (MD=–35.13, p < 0.001), (Group M)<(Group K) (MD=–47.8, p < 0.001); UREA”(Group H)>(Group M) (MD=0.89, p=0.045); BUN/CREA”(Group H)<( Group M), (MD=–30.25, p=0.040), >(Group K)(MD=40.63, p=0.002), (Group M)>(Group K) (MD=11.00, p < 0.001); CA”(Group M)<(Group K) (MD=–0.193, p=0.008); ALT”(Group H)<(Group K) (MD=–61.3, p=0.020); ALKP”(Group H)>(Group M) (MD=92.8, p=0.002), >(Group K) (MD=54.8, p=0.042); Table 3. ANOVA of blood parameters between three groups of rats tested.
Table 4. Bonferroni test of individual differences in results for blood parameter variables between the three groups of rats tested.
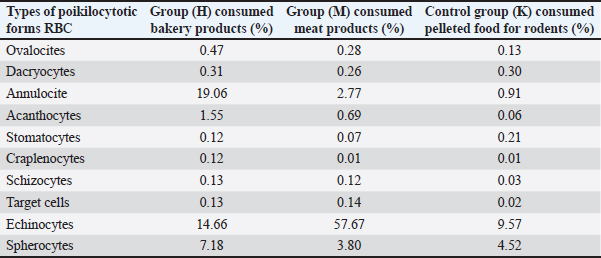
Table 5. Determined poikilocytotic forms of RBCs in experimental groups expressed in (%) from 2,000 analyzed RBCs.
Table 6. Leukogram results (%).
Table 7. Descriptive statistics and KS test of blood biochemical parameters for all three experimental groups.
Table 8. ANOVA of blood biochemical parameters between the three groups of subjects.
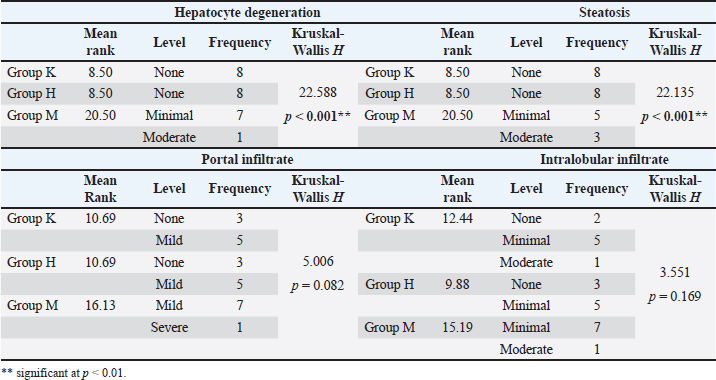
LIPA”(Group H)>(Group M) (MD=62.02, p=0.002). The pathohistological analysis of the liverThe analysis of the differences in the parameters of the pathohistological analysis of the liver between the three groups, using the Kruskal–Wallis H test (Table 10), established the existence of statistically significant differences in the severity of the condition for the variable of hepatocyte degeneration (KW=22.59; p < 0.001), where a significantly higher number of minimal and moderate changes was found in group M. Statistically significant differences in the number of values observed for the steatosis variable were determined for group M (KW=22.14; p < 0.001), with a significantly higher number of small and moderate changes observed compared with groups K and H. No significant differences in the severity of the pathohistological parameters of the liver between the three groups were observed for the variable portal and intralobular infiltrate (Fig. 2). Table 9. Bonferroni test of individual differences of results for variables of blood biochemical parameters between the three groups of subjects.
Table 10. Results of pathohistological analysis of the liver.
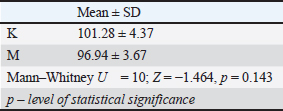
The qualitative pathohistological analysis of the kidneyThe histological structure of the kidney is shown in Figure 3. The kidney morphometric analysis findingsThe Mann–Whitney U test was used to examine the differences in the diameter of the glomeruli between the control group and the group that consumed meat products (Table 11). Mann–Whitney U test showed that there were no statistically significant differences between group K and group M in glomerular diameter (p=0.143). Table 11. Mann–Whitney U test differences in the diameter of the glomeruli of the tested rats.
Fig. 1. a) RBCs from the control group K, b) hypochromic RBC (annulocytes) from the group H (green arrows), and c) echinocytes from the group M (black arrows).
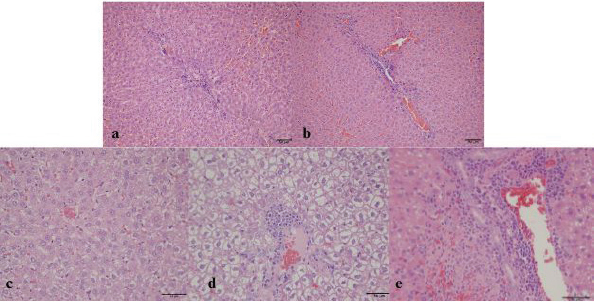
Fig. 2. Group K—a) mild portal and intralobular lymphocytic infiltrate, b) mild lymphocytic infiltrate (H&E, ×100). Group H—c) rare intralobular lymphocytic infiltrate, d) Group H—portal lymphocytic infiltrate (H&E, 200×). Group K—e) dense portal lymphocytic infiltrate, rare intralobular infiltrate, and microvesicular steatosis of hepatocytes (H&E, 400×).
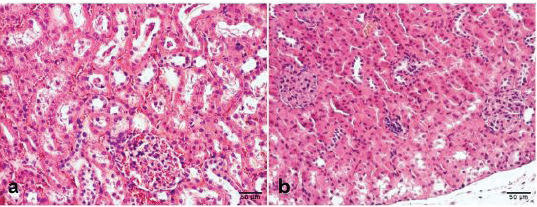
Fig. 3. Histological structure of the kidney. a) Group K structures in order, b) Group M—Renal corpuscles of rats that consumed a meat diet had slightly increased cellularity and intraglomerular extracellular matrix and less pronounced capillary blood supply. Proximal nephrocytes are hypertrophied in places, with altered chromatin of the nucleus and acidophilic cytoplasm, and close a discrete lumen (H&E, ×100). DiscussionThe monitoring of potential changes in RBCs is straightforward, since they are actually blood corpuscles in their easily identifiable form and can be easily obtained from the peripheral blood of the tested animals (Moroz et al., 2015). From our research, we determined certain changes in the shape of RBCs by examining representative visual fields in which the RBCs were only touched but did not overlap. In the images, normal RBCs in the shape of a biconcave disc can be seen in the control group, which consumed conventional, pelleted food during the experiment (Fig. 1). However, in the experimental group that consumed exclusively bakery products H (Fig. 2 and Table 5), poikilocytotic forms of RBCs were identified, hypochromic RBCs, specifically annulocytes, whose values according to the semiquantitative classification were defined as expressed (19.06%). Seven weeks of consumption of bakery products led to an unbalanced diet, leading to insufficient intake of essential nutrients necessary for the rats in the experiment. Our research is consistent with the research by Katica and Gradaščević (2017). A 7-week diet of bakery products for laboratory rats resulted in early sideropenic and mild hypochromic anemia, with RBC counts within the physiological range of the mentioned animals (Car et al., 2006). A significantly lower HGB compared to the control group K, as well as a lower value in comparison with the reference intervals for adult rats (Kampfmann et al., 2012), confirms the microscopic finding of hypochromic RBCs, but without statistically significant differences compared with other experimental groups. Furthermore, the remaining RBC indices confirm the previous statement, since the values obtained from the examined rats in group H for MCV, MCH, and MCHC are statistically significantly different compared to the control group K and M. The reduced MCV values, which are below the physiological variations for adult rats, indicate the presence of microcytes. The identified hypochromic anemia may result from a deficiency in vitamin B2 and folic acid, as well as a deficiency of vitamin B1, iron, and copper (Katica and Gradaščević, 2017) from feeding in experimental group H. This may be attributed to the fact that wheat grains are a relatively good source of iron, but their bioavailability is relatively low. Furthermore, products such as refined flour are known to contain less iron than whole wheat (Katica and Gradaščević, 2017). Also, the low values of HGB determined in group M are slightly even lower compared to the same ones from groups H and K, which indicates evident hypochromic anemia in the examined group M. Furthermore, the lower HCT values in group M further support the previous finding. The higher MCV values in group M compared to the group H suggest the absence of microcytes. However, group M exhibited the pronounced presence of poikilocytotic RBCs, specifically echinocytes (Fig. 3). In other blood corpuscles, WBC and PLT in group H showed statistically significant differences compared to groups M and K. The total WBC count in group H was slightly lower than in group K and the physiological range for adult rats (Car et al., 2006). In contrast, group M had the lowest WBC count among the groups. Leukogram values in rats from group H, as well as group M, remained within the physiological limits (Car et al., 2006), showing a lymphocytic profile typical physiological balance (Table 6). PLT values in group H were within the physiological limits (Kampfmann et al., 2012), but statistically significant differences were observed compared to groups M and K. The analysis of biochemical parameters revealed the existence of statistically significant differences (p < 0.05) between the examined groups for the values of CREA, UREA, BUN/CREA, Ca, ALT, ALKP, and LIPA. No significant differences were observed for the other biochemical parameters. The mean BUN/CREA values in group M were nearly twice as high as those in group H and four times higher than those in control group K. Long-term intake per os of high protein levels has been shown to adversely affect kidney function, i.e., causes moderate histological damage to the kidneys (Wakefield et al., 2011). Our research indicates that the microstructural changes to the kidneys caused by consuming a meat-based diet are relatively mild, and a slight increase in the number of cells and the amount of extracellular matrix of renal corpuscles was observed, as well as a less pronounced glomerular capillary blood supply and hypertrophy of the cells of the proximal tubules. These results are consistent with similar research by Al-Amoudi (2013) and Wakefield et al. (2011), in which the adverse effect on kidney function of long-term feeding of tested rats with animal protein meals was determined, in terms of the occurrence of glomerulonephritis. Our blood serum analysis results showed that the BUN/CREA parameter had a value of 90.00 in group M, which may suggest the development of glomerulonephritis. Extreme echinocytosis (57.67%) (Table 5 and Fig. 3) was recorded by examining blood smears from group M with the microscope, which indicates difficulties in kidney function. In our case, the etiological factor for the emergence of pronounced echinocytosis is a long-term diet of meat products. Support for this statement can be found in the literary references by Hadžimusić and Katica (2025), as well as Božić and Ivanović (2012), who state that echinocytosis occurs, among other things, in animals with glomerulonephritis and uremia. Moderate echinocytosis was also found in group K, and it was pronounced in group H. The appearance of echinocytosis in the examined group H, as well as in the control group K may be related to the appearance of an artifact. The echinocytosis was reported also in wild rats, which was probably due to the unbalanced nutrition under specific living conditions (Katica et al., 2024). In our study, the values obtained for AMYL were not statistically significant, while statistically significant differences were found for LIPA values between the examined groups, and the LIPA results obtained in our study partially correspond to similar research by Ilić (2021). The values of TP, and fractions of serum proteins ALB and GLO in all the tested groups were within the physiological reference intervals for a laboratory rat (Katica and Delibegović, 2019), and no significant differences were found compared to the control K group. PHOS values in all tested groups were relatively uniform, which is not the case for Ca values, where it was determined that there were significant differences compared to the control group K. The values obtained for the liver enzymes ALT and ALPK indicate that there are statistically significant differences in the values obtained between the examined groups. The values for GGT and TBIL could not be processed statistically, since the values obtained were extremely low. It is evident that rats fed conventional pelleted food and fed bakery products had identical changes in all observed parameters (portal and intralobular infiltrate, steatosis, and degeneration of hepatocytes), while rats fed meat products had a significantly higher degree of hepatocyte degeneration and steatosis in comparison with the other two groups. We assume that the observed changes in the liver could be caused by the prolonged consumption of lipid components from a meat-based diet, as well as a potential deficiency of essential vitamins. As for portal and intralobular infiltrates, these were also more pronounced in group M, although the difference was not statistically significant. When it comes to portal and intralobular infiltrates, the changes were also more pronounced in group M, but this difference was not statistically significant. ConclusionIn light of the abovementioned data, we conclude that a 7-week diet of bakery products had changes in hematological parameters in that it caused the development of sideropenic anemia. Long-term consumption of meat products had a more severe and less favorable impact compared to the group that consumed bakery products. It causes hemolytic anemia and serious disorders of kidney function. The results of this study suggest the harmfulness of consuming a meat-based diet in both human and veterinary practice in omnivores. Since rats are the animal model of choice and share similarities with humans in terms of nutrition, it is expected that the obtained results could also be applicable to human medicine. This not only enhances the relevance of this research but also extends its potential application to other domesticated and wild omnivores. However, further, more detailed research in this area is essential. AcknowledgmentsNone. Conflict of interestThe authors declare that they have no conflicts of interest. FundingThe authors declare that they received no financial support for this study. Author contributionsConception—M.K., A.B., N.K.; Design—M.K., A.B., N.K.; Supervision—A.D., E.Ć., D.K., E.Č., A.Z.; N.H.; Materials—M.K., N.K., A.B., E.Ć., D.K., E.Č., N.H., A.Z.; Data Collection and Processing—N.K., M.K., E.Ć., D.K., E.Č.; Interpretation—N.K., M.K., E.Ć.; D.K., E.Č.; N.Ć.; Literature Review—N.K., M.K.; Writing—N.K.; M.K.; and Critical Review—M.K.; A.Z. Data availabilityAll data were provided in the manuscript. ReferencesAl-Amoudi, N.S. 2013. Effects of dietary protein sources on the progression of renal failure without dialysis in rats. JFNS 1(3), 23–32; doi: 10.11648/j.jfns.20130103.11 Arbo, B.D., Niches, G., Zanini, P., Bassuino, D.M., Driemeier, D., Ribeiro, M.F. and Cecconello, A.L. 2018. Aging affects the response of female rats to a hypercaloric diet. Exp. Gerontol. 101, 7–12; doi: 10.1016/j.exger.2017.11.008 Bajrić, A., Katica, M., Katica, A., Smajović, A., Sivić, M., Rukavina, D., Zahirović, A., Bajrić, A. and Delibegović, S. 2020. Assessment of hematological parameters after laparoscopic appendectomy using conventional procedures on rats. Veterinaria 69(3), 165–173. Božić and Ivanović, Z. 2012. Patofiziologija ćelija krvi. In Patološka fiziologija domaćih životinja, 2 izdanje. Ed., Božić, T. Beograd, Serbia: Naučna KMD, pp: 40–67. Car, B.D., Eng, V.M., Everds, N.E. and Bounous, D.I. 2006. Clinical pathology of the rat. The laboratory rat, 2nd ed. London, UK: Elsevier. Christopher, M.M., Hawkins, M.G. and Burton, A.G. 2014. Poikilocytosis in rabbits: prevalence, type, and association with disease. PLoS One 9(11), e112455; doi: 10.1371/journal.pone.0112455 Hadžimusić, N. and Katica, M. 2025. Patofiziološki aspekti analize krvi i koštane srži. University text book, University in Sarajevo [In press]. Hadžiomerović , N., Babović, F., Vejzović, A., Bešić, A., Čičkušić, E., Dučić, N. and Katica M. 2025. The influence of different food types on the morphological characteristics of rat small intestine. Mac. Vet. Rev. 48(1), 5–13. Hand, M.S. 2010. Small animal clinical nutrition. 5th edition. Topeka, KS: Mark Morris Institute. Ihedioha , J.I., Okafor, C. and Ihedioha, T.E. 2008. The haematological profile of the Sprague-Dawley outbred albino rat in Nsukka, Nigeria. Anim. Res. Int. 1(2), 125–132; doi: 10.4314/ari.v1i2.40755 Ilić, I. 2021.Utjecaj primjene 13–cis retinoične kiseline i visokomasne prehrane na razvoj metaboličkog sindroma u Lewis štakorica. PhD thesis, Medicinski fakultet Osijek, Osijek Sveučilište Josipa Jurja Strossmayera u Osijeku, Osijek, Croatia. Kampfmann, I., Bauer, N., Johannes, S. and Moritz, A. 2012. Differences in hematologic variables in rats of the same strain but different origin. Vet. Clin. Pathol. 41(2), 228–234; doi: 10.1111/j.1939-165x.2012.00427.x Kati̇ca, M., Alić, A.Š., Čelebičić, M., Prašović, S., Hadžimusić, N. and Alić, A. 2019. Histopathological and hematological changes caused by head abscess in rat. Veterinaria 68, 151–156. Katica, M., Bešić, A., Kapo, N., Klarić Soldo, D., Čičkušić, E. and Hadžiomerović, N. 2024. Commensal brown rat (Rattus norvegicus) as a carrier of potential zoonotic parasites in the urban area of Bosnia and Herzegovina. Wien. Tierärztl. Monatsschr. 111, 1–12; doi: 10.5680/wtm000031 Katica, M. and Delibegović, S. 2019. Laboratorijske životinje: Osnovne Tehnike Eksperimentalnog Rada. Sarajevo, Bosnia and Herzegovina: Dobra Knjiga. Katica, M. and Gradascevic, N. 2017. Hematologic profile of laboratory rats fed with bakery products. Int. J. Res. Granthaalayah. 5(5), 221–231; doi: 10.29121/granthaalayah.v5.i5.2017.1853 Konieczka, P., Rozbicka-Wieczorek, A.J., Czauderna, M. and Smulikowska, S. 2017. Beneficial effects of enrichment of chicken meat with n-3 polyunsaturated fatty acids, vitamin E and selenium on health parameters: a study on male rats. Animal 11(8), 1412–1420; doi: 10.1017/s1751731116002652 Moroz, V.V., Chernysh, A.M., Kozlova, E.K., Sergunova, V.A., Gudkova, O.E., Khoroshilov, S.E., Onufrievich, A.D. and Kostin, A.I. 2015. Disorders in the morphology and nanostructure of erythrocyte membranes after long-term storage of erythrocyte suspension: atomic force microscopy study. Bull. Exp. Biol. Med. 159(3), 406–410; doi: 10.1007/s10517-015-2975-9 Menkinoska, M. and Gjorgoski, I. 2012. Determination of parameters from blood picture of white laboratory rats fed with enriched bread. J. Hyg. Eng. Des. 1, 251–254. Perić Kačarević, Ž. 2017. Utjecaj prehrane bogate mastima na obujam i strukturu koštanog tkiva te na parenhim jetre muških potomaka štakora’ štakorica. PhD’s thesis, Medicinski fakultet u Osijeku, Osijek, Croatia Ranković, S.G. 2018. Uticaj različitih vrsta hrane na parametre oksidativnog stresa i masnokiselinski profil fosfolipida jetre pacova. PhD’s thesis, Univerzitet u Beogradu Biološki fakultet, Belgrade, Serbia Vuković, I.K. 2006. Osnove tehnologije mesa, 3. izdanje. Belgrade, Serbia: Veterinarska komora Srbije. Wakefield, A.P., House, J.D., Ogborn, M.R., Hope, A., Weiler, H.A. and Aukema, H.M. 2011. A diet with 35% of energy from protein leads to kidney damage in female Sprague–Dawley rats. Br. J. Nutr. 106, 656–663; doi: 10.1017/S0007114511000684 Žymantiene, J., Vaida, O., Kantautaite, J., Babrauskiene, V. and Rada, Z. 2018. Assessment of gut microbiota and serum biochemistry parameters in rats fed commercial pellet diet containing different protein content. Vet. Ir Zootech. 76(98), 85–90. | ||
| How to Cite this Article |
| Pubmed Style Kapo-dolan N, Kapić D, Ćosović E, Čičkušić E, Bešić A, Čović N, Hadžiomerović N, Zahirović A, Katica M. Assessment of the hematological profile and pathohistological changes in hepatic and renal tissue in adult rats exposed to different dietary components. Open Vet. J.. 2025; 15(4): 1673-1684. doi:10.5455/OVJ.2025.v15.i4.19 Web Style Kapo-dolan N, Kapić D, Ćosović E, Čičkušić E, Bešić A, Čović N, Hadžiomerović N, Zahirović A, Katica M. Assessment of the hematological profile and pathohistological changes in hepatic and renal tissue in adult rats exposed to different dietary components. https://www.openveterinaryjournal.com/?mno=233226 [Access: June 22, 2026]. doi:10.5455/OVJ.2025.v15.i4.19 AMA (American Medical Association) Style Kapo-dolan N, Kapić D, Ćosović E, Čičkušić E, Bešić A, Čović N, Hadžiomerović N, Zahirović A, Katica M. Assessment of the hematological profile and pathohistological changes in hepatic and renal tissue in adult rats exposed to different dietary components. Open Vet. J.. 2025; 15(4): 1673-1684. doi:10.5455/OVJ.2025.v15.i4.19 Vancouver/ICMJE Style Kapo-dolan N, Kapić D, Ćosović E, Čičkušić E, Bešić A, Čović N, Hadžiomerović N, Zahirović A, Katica M. Assessment of the hematological profile and pathohistological changes in hepatic and renal tissue in adult rats exposed to different dietary components. Open Vet. J.. (2025), [cited June 22, 2026]; 15(4): 1673-1684. doi:10.5455/OVJ.2025.v15.i4.19 Harvard Style Kapo-dolan, N., Kapić, . D., Ćosović, . E., Čičkušić, . E., Bešić, . A., Čović, . N., Hadžiomerović, . N., Zahirović, . A. & Katica, . M. (2025) Assessment of the hematological profile and pathohistological changes in hepatic and renal tissue in adult rats exposed to different dietary components. Open Vet. J., 15 (4), 1673-1684. doi:10.5455/OVJ.2025.v15.i4.19 Turabian Style Kapo-dolan, Nadža, Dina Kapić, Esad Ćosović, Elmir Čičkušić, Aida Bešić, Nedim Čović, Nedžad Hadžiomerović, Amir Zahirović, and Muhamed Katica. 2025. Assessment of the hematological profile and pathohistological changes in hepatic and renal tissue in adult rats exposed to different dietary components. Open Veterinary Journal, 15 (4), 1673-1684. doi:10.5455/OVJ.2025.v15.i4.19 Chicago Style Kapo-dolan, Nadža, Dina Kapić, Esad Ćosović, Elmir Čičkušić, Aida Bešić, Nedim Čović, Nedžad Hadžiomerović, Amir Zahirović, and Muhamed Katica. "Assessment of the hematological profile and pathohistological changes in hepatic and renal tissue in adult rats exposed to different dietary components." Open Veterinary Journal 15 (2025), 1673-1684. doi:10.5455/OVJ.2025.v15.i4.19 MLA (The Modern Language Association) Style Kapo-dolan, Nadža, Dina Kapić, Esad Ćosović, Elmir Čičkušić, Aida Bešić, Nedim Čović, Nedžad Hadžiomerović, Amir Zahirović, and Muhamed Katica. "Assessment of the hematological profile and pathohistological changes in hepatic and renal tissue in adult rats exposed to different dietary components." Open Veterinary Journal 15.4 (2025), 1673-1684. Print. doi:10.5455/OVJ.2025.v15.i4.19 APA (American Psychological Association) Style Kapo-dolan, N., Kapić, . D., Ćosović, . E., Čičkušić, . E., Bešić, . A., Čović, . N., Hadžiomerović, . N., Zahirović, . A. & Katica, . M. (2025) Assessment of the hematological profile and pathohistological changes in hepatic and renal tissue in adult rats exposed to different dietary components. Open Veterinary Journal, 15 (4), 1673-1684. doi:10.5455/OVJ.2025.v15.i4.19 |

