


| Research Article | ||
Open Vet J. 2023; 13(5): 532-540 Open Veterinary Journal, (2023), Vol. 13(5): 532–540 Original Research Effects of Lombok Island’s local moringa (Moringa oleifera) leaf powder on the decrease of liver fructose levels and GLUT5 expression in albino rats (Rattus novergicus) fed a high fructose dietAladhiana Cahyaningrum1,2*, Masruroh Rahayu3, Achmad Rudijanto4 and Dian Handayani51Nutrition Department, Mataram Health Polytechnic, Ministry of Health of the Republic of Indonesia, Lombok, Indonesia 2Doctoral Program in Medical Sciences, Faculty of Medicine, Universitas Brawijaya, Malang, Indonesia 3Faculty of Medicine, Universitas Brawijaya, Malang, Indonesia 4Endocrine and Metabolic Division, Internal Medicine, Dr Saiful Anwar Hospital, Malang, Indonesia 5Faculty of Health Sciences, Universitas Brawijaya, Malang, Indonesia *Corresponding Author: Aladhiana Cahyaningrum. Nutrition Department, Mataram Health Polytechnic, Ministry of Health of the Republic of Indonesia, Lombok, Indonesia. Email: aladhiana.cahyaningrum [at] gmail.com. Submitted: 14/02/2023 Accepted: 08/04/2023 Published: 06/05/2023 © 2023 Open Veterinary Journal
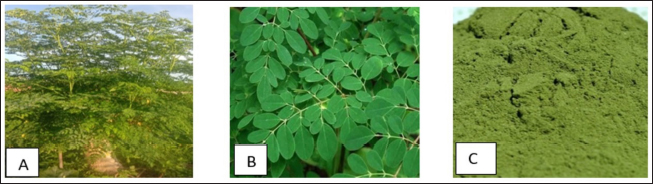
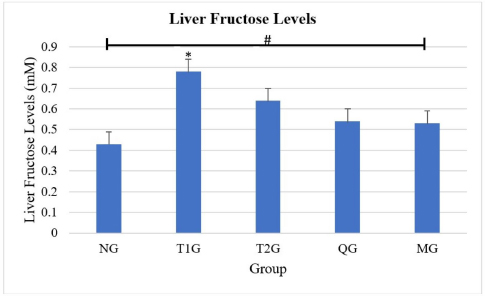
AbstractBackground: Consumed fructose enters enterocytes of the intestinal epithelial apical membrane mediated by glucose transporter 5 (GLUT5). Aim: To determine the effects of Lombok Island’s local Moringa leaf powder on reducing liver fructose levels and GLUT5 expression in the small intestine of albino rats (Rattus novergicus) fed a high-fructose diet. Methods: Moringa leaf (Moringa oleifera) was obtained from Lombok Island, Indonesia. Subsequently, 30 male albino rats (R. novergicus) were used, divided into the normal group (NG), treatment group 1 (T1G), treatment group 2 (T2G), Quercetin group (QG), Moringa group (MG). Quercetin and moringa leaf powder (M. oleifera) was administered at 50 and 500 mg/kgbw for 28 days. Enzyme-linked immunosorbent assay (Elisa) method was used to examine liver fructose levels. The observation of GLUT5 expression in the small intestine was performed by the Immunofluorescence method. Results: The ANOVA test proved that there are significant differences (p < 0.005) in liver fructose levels in all groups. Further post hoc tests show no significant difference (p > 0.005) in liver fructose levels in rats fed a high fructose diet in T1G and T2G with QG and MG rats. However, Moringa leaf powder reduces liver fructose levels by 32.1% and 17.2% in T1G and T2G rats, respectively. The ANOVA test showed a significant difference (p < 0.005) in the expression of GLUT5 in all groups. Further post hoc tests showed a significant difference (p < 0.005) in the expression of GLUT5 in the duodenum, jejunum, and ileum between the NG and the T1G rats. Meanwhile, in T2G rats, significant differences were only found in the jejunum. Moringa leaf powder reduces GLUT5 expression in T1G rats by 44.5%, 59.5%, and 57.2% in the duodenum, jejunum, and ileum, whereas in T2G rats is by 33.5%, 50.2%, and 48.1%, respectively. Conclusion: The administration of local moringa (M. oleifera) leaf powder in Lombok Island had an effect on reducing GLUT5 expression in the small intestine, however, did not in liver fructose levels of albino rats (R. novergicus) fed a high-fructose diet. Keywords: Fructose levels, GLUT5 expression, High fructose diet, Local Moringa leaf powder, Quercetin. IntroductionThe current diet in society is the habit of consuming ready-to-eat food or beverage products containing sweeteners from fructose (Basic Health Research, 2007; Douard and Ferraris, 2008; Sabarella et al., 2019). The condition is evident based on the 2007 Basic Health Research data. The fructose index was utilized to determine the consumption frequency of high-fructose packaged beverages. The West Nusa Tenggara Province has a high fructose index of 24.2%, ranking fifth after North Sulawesi, Aceh, Riau Islands, and South Sulawesi by 44.4%, 30.7%, 29.8%, and 25.8% (Basic Health Research, 2007). Similarly, based on data from the Ministry of Agriculture’s Data and Information Center in 2018, food expenditure for the Indonesian population in 2018 was mostly allocated to processed beverages, reaching 33.98% (Sabarella et al., 2019). Fructose is a class of monosaccharides with the highest level of sweetness compared to glucose and sucrose, often used as a sweetener by the food and beverage industry (Douard and Ferraris, 2008). It enters the gastrointestinal tract and is absorbed across the brush border of the small intestine into the enterocytes of the apical membrane of the intestinal epithelium, mediated by glucose transporter 5 (GLUT5) or Solute carrier family 2 A5 (SLC2A5). Furthermore, this transport occurs passively along a concentration gradient from high to low and does not require Na+ ions as cotransport. GLUT5 is the only GLUT member with a high affinity for this monosaccharide where the Michaelis–Menten constant (km)=6 mM. The main inducer of the expression is fructose, where GLUT5 is expressed on the apical surface of intestinal epithelial cells (Patel et al., 2015; Zwarts et al., 2019). Administration of 20%–25% fructose for 12 weeks can induce insulin resistance, while for a long time can trigger type 2 diabetes mellitus (T2DM) (Dupas et al., 2016; Dimak et al., 2022). Medicinal plants have been used as an alternative to synthetic drugs to overcome health problems (Pooja et al., 2020). One of the compounds that play a role in Moringa oleifera, quercetin, can act as an apical GLUT2 inhibitor (Kwon et al., 2007). The Moringa plant is of great interest because several studies using experimental animals with the intervention showed that quercetin inhibits the transport of fructose and glucose by GLUT2 in the brain. Furthermore, it stimulates the expression of GLUT4 translocation in skeletal muscle (Chuang et al., 2007; El-Moez et al., 2014). Quercetin contributed to both GLUT5 and GLUT2 mediated fructose uptake inhibition, but the contribution to GLUT5 inhibition was higher than the contribution to GLUT2 inhibition (Lee et al., 2015). However, it should be noted that Vargas-Sánchez et al. (2019) have reported that quercetin does not affect GLUT5. Moringa is a species with a remarkable ability to thrive, irrespective of seasonal fluctuations. It is highly adaptable and versatile and can grow effortlessly in tropical and subtropical regions across the globe, primarily found in the continents of Asia and Africa. Despite its numerous benefits, this specie is relatively affordable to cultivate and acquire (Nikita et al., 2015; Thiruchelvi et al., 2021). Indonesia is among the nations situated on the Asian continent where moringa plants flourish abundantly. The West Nusa Tenggara Province has implemented a cross-sector regency program, the “Moringa Program,” further to promote this remarkable plant’s growth and cultivation. Luthfiyah (2012) showed that the nutrient analysis results of moringa leaf powder were similar to other countries and the recommended daily dietary intake by FAO. The study recommended further biomolecular analysis to determine the role of local moringa leaf powder in West Nusa Tenggara Province on health problems. It determines the effects of Lombok Island’s local Moringa leaf powder (M. oleifera) on reducing liver fructose levels and GLUT5 expression in the small intestine of albino rats (Rattus novergicus) given a high fructose diet. Materials and MethodsProcedure for making Moringa (M. oleifera) leaf powderThe Moringa (M. oleifera) was obtained from Mataram City, Lombok Island, West Nusa Tenggara Province, Indonesia. The leaf was selected based on criteria, and the sorting process was carried out to obtain a good-quality extract. Subsequently, the leaf was weighed using a food scale (Oxone OX-311), which was washed to remove dirt and dust using clean running water. The washed leaf was drained using a sieve (screen), hence, the water still attached to the leaf could disappear completely. The next stage was drying the leaf using an oven at 40°C for 24 hours. After the moringa leaf was dried, weighing and mashing were conducted using digital scales (Ohause; accuracy 0.001 mg) and a blender. Sieving was conducted using a 104 mesh sieve to separate coarse grains to produce good moringa leaf powder as a ready-to-use raw material (Ministry of Health, 1985). Animal careThere were 30 male albino rats (Rattus norvegicus) Wistar strain, aged 3–4 months, weighing 200–300 g, and adapted for 7 days. These experimental animals were randomly divided by simple random method into normal group (NG; n=6); (T1G; n=6) as T2DM control, treatment group 2 (T2G; n=6) as preDM control, quercetin group (QG; n=6), and Moringa group (MG; n=6). The rats in the T1G and T2G groups were administered AIN-93M and had ad libitum access to water with a 66% fructose concentration at a dose of 9 g/kgbw for 112 days and 84 days, respectively. QG and MG were given quercetin and Lombok Island’s local Moringa leaf powder (M. oleifera) at 50 and 500 mg/kgbw for 28 days. Anesthesia of experimental animals during surgeryFructose levels were measured by analyzing tissue samples from the left lobe liver. On the other hand, GLUT5 expression was determined by analyzing tissue samples from the small intestine, and the tissue collection was performed surgically under anesthesia. Euthanasia of rats was performed under anesthetic drugs (AVMA 2013), and ketamine HCL was used intravenously at 0.2 ml with water for injecting all rats. Measurement of liver fructose levels using ELISA methodExamination of fructose levels is done using the liver. Liver retrieval was carried out by sacrificing the rats with anesthetization beforehand. The left lobe liver was taken, then stored in a cooler box for homogenization before proceeding with the Elisa method. This study examined fructose levels using rat liver and Biovision’s Fructose assay kit (ab83380) with catalog K619-100. In the Abcam Fructose Test Kit, free fructose is enzymatically converted into glucose, which is converted into a product reacting with the OxiRed Probe to produce color (λ=570 nm) and fluorescence (Ex/Em=535/587 nm). This kit uses a rapid, simple, sensitive, and high-reliability method, making it suitable for D-fructose assay. The Elisa method uses a colorimetric detection system to examine fructose levels. The colorimetric assay method produces colored products that absorb light in the visible range. The wavelength that detects colorimetric testing is 380–700 nm, while the wavelength is 570 nm on a microplate reader. Observation of GLUT5 expression in the small intestine by immunofluorescence methodDuodenum, jejunum, and ileum data were collected by means of mice being sacrificed by anesthetizing them first. Parts of the small intestine (duodenum, jejunum, and ileum) were taken and washed, and stored in a container containing 10% formalin, then histological preparations were made. Observation of GLUT5 expression was taken from the duodenum, jejunum, and ileum of albino rats (R. novergicus) using Polyclonal anti-GLUT5 primary antibody from Santa Cruz with code sc-271055 FITC Anti-Glucose Transporter Antibody Glut5 (E-2) FITC, 200 µg/ml. Antibodies were labeled with fluorescence dyes, and antigen–antibody complexes were visualized using a confocal laser scanning microscope (CLSM) to observe the sample for fluorescence. Statistical analysisThe data obtained were analyzed using statistical computer software (IBM SPSS v24). To evaluate the impact of administering moringa leaf powder on liver fructose levels and GLUT5 expression, a one-way analysis of variance and post hoc test with a 95% confidence level were conducted Ethical approvalThe study was conducted based on Ethics Review Decree No. 182/UN18.F7/ETIK/2021 by the Health Research Ethics Commission of the Medicine Faculty, Mataram University. This is because the ethical implications of animal experiments are appropriate to ethics using the 3R principle (replacement, refinement, reduction). ResultsMoringa plant (M. oleifera) and Moringa leaf powderMoringa leaf (M. oleifera) was collected from Mataram City, Lombok Island, West Nusa Tenggara Province, Indonesia, and has been determined at the Advanced Biology Laboratory of Mataram University, with Identification Certificate No.35/UN18.7/LBL/2020. Figure 1 shows the tree and leaf power of the plant obtained from Lombok Island. The local Moringa plants on Lombok Island possess distinctive characteristics, such as compound leaves with long stems arranged alternately. The leaf blades of these plants are light green during their initial stages and become dark green after maturity. The ovoid leaf blade has a thin, limp texture with blunt tips, a base (obtusus), and flat edges. Additionally, the pinnate reinforcement arrangement and smooth upper and lower surfaces are noteworthy features of these plants. In the present study, Moringa leaf powder is an intervention material with a fine, green color, a typical languorous odor, and is free of insects or dirt. The powder contains 5% water and 17% ash content. Measurement results of liver fructose levelsThe results of measuring rat liver fructose levels were carried out in 5 groups. Each group totaling 6 rats, namely, the NG (NG; n=6), T1G (T1G; n=6), (T2G; n=6), (QG; n=6), and (MG; n=6), where QG was given quercetin at a dose of 50 mg/kgbw and MG was given moringa leaf powder (M. oleifera) local to Lombok Island at a dose of 500 mg/kgbw for 28 days, as shown in Figure 2. #: ANOVA test showed there was a significant difference (p=0.042 < α=0.05) in liver fructose levels in the 5 groups (NG, T1G, T2G, QG, and MG). Meanwhile, the post hoc Bonferroni test showed a significant difference (p=0.038 < α=0.05) in liver fructose levels between the NG and T1G. The NG received food and drink, while T1G, as a T2DM control, was given food, drink, and high fructose diet. This means that a high fructose diet increases liver fructose levels. In the post hoc test, there was no significant difference (p=0.086 > α=0.05) in the levels between the normal, the quercetin, and the moringa groups in subset 1, with low fructose levels. Meanwhile, high fructose levels were in subset 2 found in T1G and T2G, without significant difference (p =0.223 > α=0.05) in liver fructose levels. Therefore, the administration of moringa leaf powder and quercetin as a gold standard reduces liver fructose levels in high-fructose rats although not significantly.
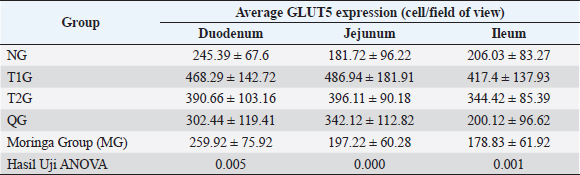
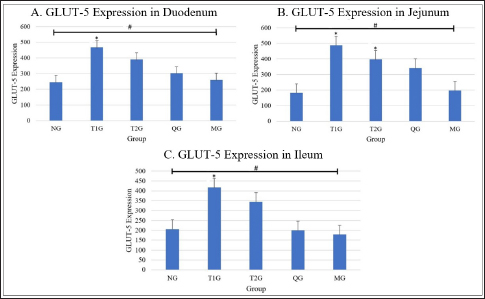
Fig. 1. Lombok Island’s Local Moringa plants, Mataram City, Indonesia. (A): Moringa plant (M. oleifera) originating from Mataram city, Lombok Island, West Nusa Tenggara Province. (B): Moringa leaf (M. oleifera). (C): Moringa leaf powder. Observation result of GLUT5 expressionThe observation results of GLUT5 expression in the small intestine (duodenum, jejunum, and ileum) of rats in 5 groups, namely the (NG; n=6); T1G (T1G; n=6); (T2G; n=6); (QG; n=6); (MG; n=6), where QG was given quercetin at a dose of 50 mg/kgbw and MG was given moringa leaf powder (M. oleifera) local to Lombok Island at a dose of 500 mg/kgbw for 28 days, are shown in Table 1. Based on the data in Table 1, GLUT5 expression in T1G had the highest GLUT5 expression than other groups, where the highest expression was found in the jejunum, then in the duodenum, and the lowest in the ileum. In contrast to GLUT5 expression in the MG, the highest expression was found in the duodenum, then jejunum, and the lowest in the ileum. The statistical analysis results of GLUT5 expression observations in the duodenum, jejunum, and ileum in all groups, namely the (NG; n=6); (T1G; n=6); (T2G; n=6); (QG; n=6); (MG; n=6) are shown in Figure 3. Figure 3A–C show that the ANOVA test result has a significant difference (p=0.005 < α=0.05; p=0.00 < α=0.05; p=0.01 < α=0.05) in GLUT5 expression in the duodenum, jejunum, and ileum in each group (NG; T1G; T2G; QG; MG). Meanwhile, in Figure 3A the post hoc further test shows a significant difference (p=0.012 < α=0.05) GLUT5 expression in the duodenum between NG and T1G. This means that a high fructose diet affects increasing GLUT5 expression in the duodenum of rats. Significant differences (p=0.021 < α=0.05) in GLUT5 expression in the duodenum between the T1G and MG groups means that the administration of Lombok Island’s local Moringa leaf powder has an effect on reducing GLUT5 expression in the duodenum of rats given a high fructose diet. Figure 3B shows that post hoc further test results show that there is a significant difference in GLUT5 expression in jejunum between NG with T1G (p=0.001 < α=0.05) and T2G (p=0.036 < α=0.05). This means that a high-fructose diet affects increasing GLUT5 expression in the jejunum of rats fed a high-fructose diet for 112 days or 84 days. Figure 3C shows that ANOVA test results have a significant difference (p=0.01 < α=0.05) GLUT5 expression in the ileum in each group (NG; T1G; T2G; QG; MG). Furthermore, Figure 3C shows post hoc further test shows a significant difference (p=0.024 < α=0.05) GLUT5 expression in the ileum between the NG and T1G. This means that a high fructose diet affects the increase in GLUT5 expression in the ileum of rats. Significant differences were also found between the T1G and QG groups (p=0.012 < α=0.05) as well as between T1G and MG ((p=0.007 < α=0.05). QG was given quercetin at a dose of 50 mg/kgbw and MG was given moringa leaf powder (M. oleifera) local to Lombok Island at a dose of 500 mg/kgbw for 28 days. This means administering local Moringa leaf powder and quercetin as gold standard reduces GLUT5 expression in the ileum.
Fig. 2. Examination of fructose levels in the liver of albino rats (R. novergicus). #ANOVA test showed significant differences (p < 0.005) between the NG, T1G, T2G, QG, and NG groups. *Post hoc test showed significant differences (p < 0.005) in liver fructose levels in the T1G group from the NG group, where the TIG group was the control group of T2DM, namely the group that was given a high-fructose diet, while the NG group was the NG that was given standard feed and drink ad libitum only. Table 1. Average values of GLUT5 expression in units of cells/field of view in NG, T1G, T2G, QG, and MG rats.
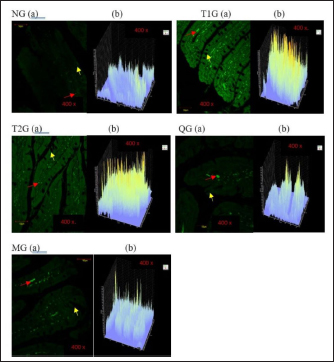
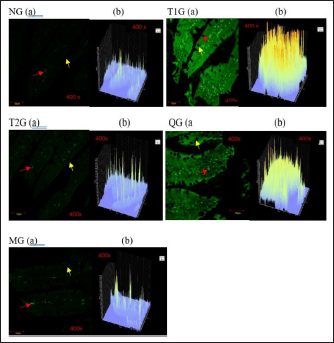
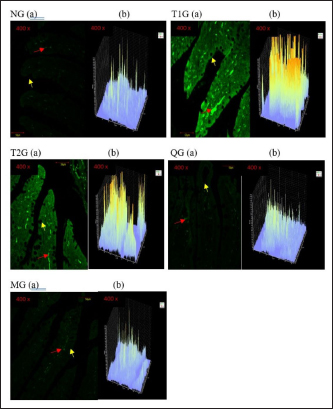
Fig. 3. GLUT5 expression (cell/ Field of View) in the small intestine of albino rats (R. novergicus). (A): Duodenum; (B): Jejunum; (C): Ileum. Visualization of GLUT5 expressionThe visualization of GLUT5 expression in the small intestine of rats was accomplished using the CLSM technique. The resultant images were captured at a magnification of 400 × and displayed with a scale bar of 50 µm. The observations showed the presence of green luminescence, which serves as an indication of GLUT5 expression. The expression and goblet cells were observed in the image as denoted by the red and yellow arrows. The resulting visualization of GLUT5 expression in the small intestine in the form of microscopic photos (a) and graphs (b) for each group, as shown in Figures 4–6. Figure 4 shows the visualization of GLUT5 expression in the duodenum. The resulting expression value on the graph is in units of cells/field of view (cells/fv) for each group, namely the NG=NG (129.31); T1G=T1G (739.38), T2G=T2G (656.63), QG=QG (189.57), and MG=MG (176.30). Figure 5 shows the visualization of GLUT5 expression in the jejunum. The resulting expression value on the graph is in units of cells/fv for each group, namely the NG=NG (73.20), T1G=T1G (953.99), T2G=T2G (547.73), QG=QG (139.89), and MG=MG (102.87). Figure 6 shows the visualization of GLUT5 expression in the ileum. The resulting expression value on the graph is in units of cells/fv for each group, namely the NG=NG (84.18), T1G=T1G (780.72), T2G=T2G (491.88), QG=QG (134.71), and MG=MG (120.82). DiscussionA diet is a structured plan of food components designed to be consumed for a specific purpose. In this study, a high-fructose diet with a concentration of 66% at a dose of 9 g/kgbw was used to increase liver fructose levels and GLUT5 expression in albino rats (R. novergicus) manifesting prediabetes and T2DM (Catena et al., 2003; Astuti, 2015; Devyani and Devyana, 2018). Meanwhile, fructose is a monosaccharide, consisting of 6 carbon atoms (hexose) which is an isomer of glucose having a molecular formula (C6H12O6) and a caloric value of 4 kcal/g (Grembecka, 2015). It is D-fructose with a very sweet taste, white color, solid crystals, and is water soluble. Furthermore, the administration is carried out orally every day using a sonde.
Fig. 4. Microscopic photographs and graphs of GLUT5 expression in the rat small intestine (Duodenum).
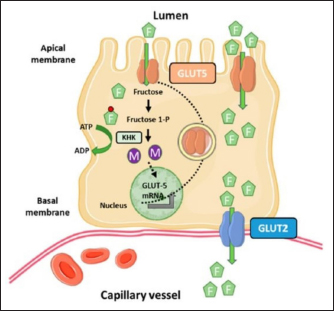
Fig. 5. Microscopic photographs and graphs of GLUT5 expression in the rat small intestine (Jejunum). Fructose enters the gastrointestinal tract through absorption from the lumen to the apical membrane of the intestinal epithelium mediated by GLUT5. This transport occurs passively in the direction of the concentration gradient from high to low and does not require Na+ ions as cotransport. GLUT2 mediates the absorption from the intestinal epithelial membrane into the extracellular fluid, and the transport occurs from low to high concentrations through Na+/K+ pumps that require ATP (Crouzoulon and Korieh, 1991). The results showed that the rats fed a high-fructose diet increased GLUT5 expression in the small intestines, as shown in the data in Table 1. The statistical analysis proved that there was a significant difference in GLUT5 expression in NG with T1G rats given a high-fructose diet in the duodenum (p =0.012 < α=0.05), jejunum (p=0.01 < α=0.05), and ileum (p =0.024 < α=0.05). Meanwhile, in T2G rats, significant differences (p=0.036 < α=0.05) were only found in the jejunum. Increased expression of GLUT5 in group rats treated with a high-fructose diet compared to mice in the NG which were only given standard feed (AIN-93M), led to an increase in GLUT5 mRNA, where mRNA carries the transcript of the gene that encodes the protein from the nucleus to the ribosome causing increased GLUT5 expression. These results are supported by previous research, in wild-type mice on a high-fructose diet, where the abundance of GLUT5 mRNA in the small intestine was eight times higher compared to the standard diet (Hermann, 2020). Western analysis indicated that SGLT1 and GLUT5 protein levels were 4.3 and 4.1-fold higher in diabetic patients. This was associated with threefold increases in SGLT1 and GLUT5 mRNA measured by Northern blotting (Dyer et al., 2002). The increase in GLUT5 expression in the group of rats given a high fructose diet was also followed by a rise in liver fructose levels. This was evidenced by statistical analysis showing a significant difference (p =0.042 < α=0.05) between the T1G rats given a high fructose diet with NG rats that were only given feed and drink ad libitum. However, there was no significant difference in the T2G rats (p=0.636 > α=0.05). A marked elevation in liver fructose levels was observed in T1G rats compared to T2G, which can be attributed to the variations in the duration of treatment with a high-fructose 66% diet dose of 9 g/kgbw. The T1G and T2G rats were treated for an average of 112 and 84 days. The variation in the duration of treatment also has an impact on GLUT5 expression. The T1G rats administered a high-fructose diet exhibited marked differences in the expression of GLUT5 in the duodenum, jejunum, and ileum. Meanwhile, in T2G rats, significant differences only occurred in the jejunum. GLUT5 has a high affinity for fructose, while GLUT5 (Slc2a5) is responsible for the uptake into enterocytes on the apical side of the membrane. Furthermore, GLUT2 (Slc2a2) moves most of the fructose from the cytosol to the blood vessels on the basolateral side of the enterocytes, as shown in Figure 7. Description: Fructose (F) is transported by GLUT5 through the brush border membrane and enters the enterocyte cytosol, rapidly phosphorylated by ketohexokinase (KHK), leading to the depletion of intracellular ATP levels. The group of phosphorylated fructose is partially or completely metabolized, producing metabolites (M) that induce Slc2a5 gene expression. Meanwhile, the remaining fructose is released across the basolateral membrane into the portal circulation down a concentration gradient by GLUT2.
Fig. 6. Microscopic photographs and graphs of GLUT5 expression in the rat small intestine (ileum).
Fig. 7. Fructose transport in the small intestine (Mora and Pessin, 2013). Figure 7 explains the results that feeding a high fructose diet can cause an increase in GLUT5 expression. High GLUT5 expression was found in the T1G group in all parts of the duodenum, jejunum, and ileum. In T2G, the significant difference was only in the jejunum, and the liver fructose levels were affected, where GLUT5 is responsible for fructose uptake into enterocytes. The elevated fructose levels in the liver of T1G rats result in a notable disparity with the NG group. However, no considerable contrast was observed in the fructose levels of T2G rats. Nunes and Anastasiou (2021) stated that high fructose consumption increases the expression of the GLUT5 transporter and the uptake of this monosaccharide. According to the findings of this study, TIG rats that were administered high levels of fructose for 112 days showed elevation in GLUT5 expression in their duodenum, jejunum, and ileum. Consequently, this resulted in a substantial increase in the fructose levels in their liver. In T2G rats, who were given high fructose for a shorter time of 84 days, there was a significant increase in GLUT5 expression only in the jejunum, causing an insignificant increase in liver fructose levels. This study found the highest GLUT5 expression in the jejunum, followed by the duodenum and ileum. It was observed that T2G rats subjected to a high fructose diet for a shorter period of 84 days with the same dosage as T1G rats showed a substantial increase in GLUT5 expression in their jejunum. According to Hannou et al. (2018), the jejunum is the expression site of GLUT 5. This is consistent with the result of this study, which indicates that the jejunum exhibits the highest GLUT5 expression. Other studies in rats and rabbits showed that the highest GLUT5 expression is in the upper part of the small intestine, namely the duodenum and proximal jejunum (Douard and Ferraris, 2008). The difference in GLUT5 expression in the NG with T1G and T2G is due to feeding a 66% high-fructose diet at a dose of 9 g/kgbw, causing differences in carbohydrate intake. According to Mora and Pessin (2013), the expression in the intestine depends on the carbohydrate content of food. In this study, the NG was only given food and drink ad libitum. Meanwhile, in T1G and T2G, the experimental animals received food and drink ad libitum with high fructose. Another study also proved that in T2DM patients, there is a three to four fold increase in GLUT5 protein expression and mRNA in the small intestine, especially the duodenum (Nunes and Anastasiou, 2021), and in rats with experimentally induced diabetes, there is an increase in the capacity of the intestine to absorb monosaccharides. The increase in the capacity of the intestine to absorb monosaccharides in human T2DM is due to a combination of intestinal structural change with a specific increase in the expression of the monosaccharide transporters SGLT1, GLUT5, and GLUT2 (Dyer et al., 2002). Moringa oleifera has been analyzed as an antidiabetic agent due to its effect on lowering blood glucose levels. Quercetin is a significant compound in this plant, which can act as an apical GLUT2 inhibitor (Kwon et al., 2007). It should be noted that SGLT2 inhibitors belong to a class of drugs that block renal glucose reabsorption (Kellon and Gustafson, 2022). This study utilized quercetin as the gold standard, and the content in Lombok Island’s local Moringa leaf powder is 30.33 mgQE/100 g. According to Shao et al. (2013), quercetin compounds can increase insulin sensitivity (Shao et al., 2013), with the effect of lowering blood glucose levels (Ndong, 2007). The results of observations on liver fructose levels in the MG rats given feed, drink ad libitum, high fructose diet, and Lombok Island’s local Moringa leaf powder showed lower liver fructose levels at 0.530 mM compared to T1G and T2G rats given feed, drink ad libitum, and high fructose diet. In the QG rat, the liver fructose levels differed greatly from the MG at 0.538 mM. Moreover, the post hoc test showed no significant difference in MG and QG rats’ liver fructose levels (p=1.000 > α=0.05). This means quercetin, used as a gold standard, has the same effect as moringa leaf powder. Compared with the NG at 0.48 mM, the liver fructose levels of the QG and the MG were insignificantly different. The post hoc test showed no significant difference (p=1.00 > α=0.05) in liver fructose levels between the NG with MG and QG. This means that liver fructose levels in MG and QG are not different from NG rats. Moreover, high liver fructose levels were found in T1G (0.778 mM) and T2G (0.640 mM), with a significant difference (p =0.038 < α=0.05) in T1G with NG rats. Meanwhile, the test results showed no significant difference (p =0.636 > α=0.05) in liver fructose levels of T2G rats with NG rats. Even though the administration of Lombok Island’s local Moringa leaf powder in the rats fed a high-fructose diet did not significantly reduce liver fructose levels, there was a decrease of 32.1% and 17.2% in T1G and T2G rats. This could be due to decreased GLUT5 expression in the duodenum, jejunum, and ileum. GLUT5 is the only specialized transporter for fructose expressed in the apical membrane of the small intestine following its high affinity for the monosaccharide (Shahib, 2005; Merino et al., 2020). In humans and rodents, GLUT5 is an efficient facilitative diffusion system that is specific for D-fructose (Burant et al., 1992; Koepsell, 2020) so that there is a concomitant decrease in fructose uptake with a reduction in the number of transporters that facilitate the entry of fructose into cells. This ultimately results in an insignificant decrease in the levels of fructose found within the liver. ConclusionThe administration of local Moringa (M. oleifera) leaf powder in Lombok Island had an effect on reducing GLUT5 expression in the small intestine, however, did not in liver fructose levels of albino rats (R. novergicus) fed a high-fructose diet. ReferencesAstuti, D.A. 2015. Diet Untuk Hewan Model. Cetakan I. IPB Press Printing, Bogor, Indonesia. Basic Health Research. 2007. Jakarta, Indonesia: Health Research and Development Agency, Ministry of Health. Burant, C.F., Takeda, J., Brot-Laroche, E., Bell, G.I. and Davidson, N.O. 1992. Fructose transporter in human spermatozoa and small intestine is GLUT5. J. Biol. Chem. 267, 14523–14526. Catena, C., Giacchetti, G., Novello, M., Colussi, G., Cavarape, A. and Sechi, L.A. 2003. Cellular mechanisms of insulin resistance in rats with fructose-induced hypertension. Am. J. Hyperten. 16, 973–978. Crouzoulon, G. and Korieh, A. 1991. Fructose transport by rat intestinal brush border membrane vesicles. Effect of high fructose diet followed by return to standard diet. Comp. Biochem. Physiol. Part A. 1, 175–182. Devyani, D.W. and Devyana, D.W. 2018. Pengembangan model hewan coba tikus diabetes mellitus tipe 2 dengan induksi diet tinggi fruktosa intragastrik. Media Pharm. Indones. 2(1), 41. DOI: 10.24123/mpi.v2i1.1302. Dimak, C.S., Girendra K.G., Durga P.P. and Mohd, A.R. 2022. A study of hyperglycaemic activity by fructose induced diabetes on the Wistar rat model by using Zn-Aspirin coordination metal complex. Res. J. Pharm. Technol. 15(7), 3009–4014. Douard, V. and Ferraris, R.P. 2008. Regulation of the fructose transporter GLUT-5 in health and disease. Am. J. Physiol. Endocrinol. Metab. 295, E227–E237. Dupas, J., Goanvec, C., Feray, A., Guernec, A., Alain, C., Guerrero, F. And Mansourati, J. 2016. Progressive induction of type 2 diabetes: effects of a reality–like fructose enriched diet in young wistar rats. PloS. One 11(1), e0146821. Dyer, J., Wood, I.S., Palejwala, A., Ellis, A. and Shirazi-Beechey, S.P. 2002. Expression of monosaccharide transporters in intestine of diabetic humans. Am. J. Physiol. Gastrointest. Liver Physiol. 282(2), G241–248. Grembecka, M. 2015. Natural sweeteners in a human diet. Rocz. Panstw. Zakl. Hig. 66, 195–202. Hannou, S.A., Haslam, D.E., McKeown, N.M. and Herman, M.A. 2018. Fructose metabolism and metabolic disease. J. Clin. Invest. 128(2), 545–555. Kellon, E.M. and Gustafson, K.M. 2022. Use of the SGLT2 inhibitor canagliflozin for control of refractory equine hyperinsulinemia and laminitis. Open Vet. J. 12(4), 511–518. Koepsell, H. 2020. Glucose transporters in the small intestine in health and disease. Pflugers Arch. 472(9), 1207–1248. Kwon, O., Eck, P., Chen, S., Corpe, C.P., Lee, J., Kruhlak, M. And Levine, M. 2007. Inhibition of the intestinal glucose transporter GLUT-2 by flavonoids. FASEB J. 21, 366–377. Lee, Y., Lim, Y. and Kwon, O. 2015. Selected phytochemicals and culinary plant extracts inhibit fructose uptake in caco-2 cells. Molecules 20(9), 17393–17404. Luthfiyah, F. 2012. Nutritional potential of local Moringa leaves in West Nusa Tenggara. Media Build Sci. 6, 42–50. Merino, B., Fernández-Díaz, C.M., Cózar-Castellano, I. and Perdomo, G. 2020 Intestinal fructose and glucose metabolism in health and disease. Nutrients 12, 94. Mora, S. and Pessin, J. 2013. Glucose/sugar transport in mammals. Eds., William J. and Lennarz., M. Daniel Lane: Encyclopedia of Biological Chemistry (Second Edition), Cambridge, MA; Academic Press, pp: 391–394. Ministry of Health. 1985. How to make simplicia. Jakarta, Indonesia: Ministry of Health, pp: 141. Ndong, M., Uehara, M., Katsumata, S. and Suzuki, K. 2007. Effects of oral administration of Moringa oleifera Lam on glucose tolerance in gotokakizaki and wistar rats. J. Clin. Biochem. Nutr. 40, 229–233. Nikita, D., Nisha, M.P., Vipul, G. and Vijay, L. 2015. Pharmacological Activities of Moringa oleifera: An Overview. Res. J. Pharm. Technol. 8(4), 476–480. Nunes, P.M. and Anastasiou, D. 2021. Fructose in the diet expands the surface of the gut and promotes nutrient absorption. Nature 597(7875), 180–182. Patel, C., Douard, V., Yu, S., Gao, N. and Ferraris, R.P. 2015. Transport, metabolism, and endosomal trafficking - dependent regulation of intestinal fructose absorption. FASEB. J. 29(9), 4046–4058. Pooja, C., Sunil, M., Deepti, C., Akansha, B. and Jaya, D. 2020. Phytochemical and Antioxidant Studies of M. oleifera and A. sativum flower extracts. Res. J. Pharm. Technol. 13(10), 4579–4584. Riset Kesehatan Dasar (Riskesdas). 2007. Jakarta, Indonesia: Badan Penelitian dan Pengembangan Kesehatan, Departemen Kesehatan, Republik Indonesia. Sabarella, K.W.B., Wahyuningsih, S., Saida, M.D.N. and Manurung, M. 2019. Buletin Konsumsi Pangan. Pusat Data dan Sistem Infromasi Pertanian, 1st ed Sekretariat Jenderal Kementerian Pertanian. 10 Shahib, M.N. 2005. Transpor glukosa pada usus halus. Dalam: Biologi Molekuler Medik I. Shao, L., Liu, K., Huang, F., Guo, X., Wang, M. and Liu, B. 2013. Opposite effects of quercetin, luteolin, and epigallocatechin gallate on insulin sensitivity under normal and inflammatory conditions in mice. Inflammation 36(1), 1–14. Thiruchelvi, R., Priyadharshini, S. and Rajakumari, K. 2021. Screening for Antidiabetic Peptides from Moringa oleifera leaves. Res. J. Pharm. Technol. 14(11), 5886–5890. Vargas-Sánchez, K., Garay-Jaramillo, E. and González-Reyes, R.E. 2019. Effects of Moringa oleifera on glycaemia and insulin levels: a review of animal and human studies. Nutrients. 11(12), 2907. Zwarts, I., van Zutphen, T., Kruit, J.K., Liu, W., Oosterveer, M.H., Verkade, H.J., Uhlenhaut, N.H. and Jonker, J.W. 2019. Identification of the fructose transporter GLUT5 (SLC2A5) as a novel target of nuclear receptor LXR. Sci. Rep. 9(1), 9299. | ||
| How to Cite this Article |
| Pubmed Style Cahyaningrum A, Rahayu M, Rudijanto A, Handayani D. Effects of Lombok Island’s local moringa (Moringa oleifera) leaf powder on the decrease of liver fructose levels and GLUT5 expression in albino rats (Rattus novergicus) fed a high fructose diet. Open Vet J. 2023; 13(5): 532-540. doi:10.5455/OVJ.2023.v13.i5.5 Web Style Cahyaningrum A, Rahayu M, Rudijanto A, Handayani D. Effects of Lombok Island’s local moringa (Moringa oleifera) leaf powder on the decrease of liver fructose levels and GLUT5 expression in albino rats (Rattus novergicus) fed a high fructose diet. https://www.openveterinaryjournal.com/?mno=143461 [Access: July 06, 2025]. doi:10.5455/OVJ.2023.v13.i5.5 AMA (American Medical Association) Style Cahyaningrum A, Rahayu M, Rudijanto A, Handayani D. Effects of Lombok Island’s local moringa (Moringa oleifera) leaf powder on the decrease of liver fructose levels and GLUT5 expression in albino rats (Rattus novergicus) fed a high fructose diet. Open Vet J. 2023; 13(5): 532-540. doi:10.5455/OVJ.2023.v13.i5.5 Vancouver/ICMJE Style Cahyaningrum A, Rahayu M, Rudijanto A, Handayani D. Effects of Lombok Island’s local moringa (Moringa oleifera) leaf powder on the decrease of liver fructose levels and GLUT5 expression in albino rats (Rattus novergicus) fed a high fructose diet. Open Vet J. (2023), [cited July 06, 2025]; 13(5): 532-540. doi:10.5455/OVJ.2023.v13.i5.5 Harvard Style Cahyaningrum, A., Rahayu, . M., Rudijanto, . A. & Handayani, . D. (2023) Effects of Lombok Island’s local moringa (Moringa oleifera) leaf powder on the decrease of liver fructose levels and GLUT5 expression in albino rats (Rattus novergicus) fed a high fructose diet. Open Vet J, 13 (5), 532-540. doi:10.5455/OVJ.2023.v13.i5.5 Turabian Style Cahyaningrum, Aladhiana, Masruroh Rahayu, Achmad Rudijanto, and Dian Handayani. 2023. Effects of Lombok Island’s local moringa (Moringa oleifera) leaf powder on the decrease of liver fructose levels and GLUT5 expression in albino rats (Rattus novergicus) fed a high fructose diet. Open Veterinary Journal, 13 (5), 532-540. doi:10.5455/OVJ.2023.v13.i5.5 Chicago Style Cahyaningrum, Aladhiana, Masruroh Rahayu, Achmad Rudijanto, and Dian Handayani. "Effects of Lombok Island’s local moringa (Moringa oleifera) leaf powder on the decrease of liver fructose levels and GLUT5 expression in albino rats (Rattus novergicus) fed a high fructose diet." Open Veterinary Journal 13 (2023), 532-540. doi:10.5455/OVJ.2023.v13.i5.5 MLA (The Modern Language Association) Style Cahyaningrum, Aladhiana, Masruroh Rahayu, Achmad Rudijanto, and Dian Handayani. "Effects of Lombok Island’s local moringa (Moringa oleifera) leaf powder on the decrease of liver fructose levels and GLUT5 expression in albino rats (Rattus novergicus) fed a high fructose diet." Open Veterinary Journal 13.5 (2023), 532-540. Print. doi:10.5455/OVJ.2023.v13.i5.5 APA (American Psychological Association) Style Cahyaningrum, A., Rahayu, . M., Rudijanto, . A. & Handayani, . D. (2023) Effects of Lombok Island’s local moringa (Moringa oleifera) leaf powder on the decrease of liver fructose levels and GLUT5 expression in albino rats (Rattus novergicus) fed a high fructose diet. Open Veterinary Journal, 13 (5), 532-540. doi:10.5455/OVJ.2023.v13.i5.5 |

