


| Research Article | ||
Open Vet. J.. 2024; 14(4): 1051-1058 Open Veterinary Journal, (2024), Vol. 14(4): 1051–1058 Original Research Detection of the chuA gene encoding the invasive enterohemorrhagic species Escherichia coli 0157:H7 using qPCR in horse feces samples on Sumbawa Island, IndonesiaKholik Kholik1*, Akhmad Sukri2, Katty Hendriana Priscilia Riwu1, Shendy Canadya Kurniawan3 and Aswin Rafif Khairullah41Department of Veterinary Public Health, Faculty of Veterinary Medicine, Universitas Pendidikan Mandalika, Mataram, Indonesia 2Departement of Biology Education, Universitas Pendidikan Mandalika, Mataram, Indonesia 3Master Program of Animal Sciences, Department of Animal Sciences, Specialisation in Molecule, Cell and Organ Functioning, Wageningen University and Research, Wageningen, The Netherlands 4Research Center for Veterinary Science, National Research and Innovation Agency (BRIN), Bogor, Indonesia *Corresponding Author: Kholik Kholik. Department of Veterinary Public Health, Faculty of Veterinary Medicine, Universitas Pendidikan Mandalika, Indonesia. Email: kholiqvet [at] gmail.com Submitted: 18/01/2024 Accepted: 30/03/2024 Published: 30/04/2024 © 2024 Open Veterinary Journal
AbstractBackground: Bacterial identification can be done using various testing techniques. Molecular techniques are often used to research dangerous diseases, an approach using genetic information on the pathogenic agent. The enterohemorrhagic invasive species Escherichia coli 0157:H7 was identified from the feces of working horses on the island of Sumbawa. Another advance in molecular technology is genome amplification with qPCR which is the gold standard for detecting E. coli. Aim: This study aims to detect and identify the invasive species E. coli 0157:H7 using the gene encoding chuA with the qPCR method sourced from horse feces. Methods: Fresh fecal samples from horses on Sumbawa Island were isolated and identified, then continued with molecular examination using the gene encoding chuA using the qPCR method. Results: qPCR testing in this study showed that six sample isolates that were positive for E. coli 0157:H7 were detected for the presence of the chuA gene, which is a gene coding for an invasive species of E. coli bacteria. The highest to lowest Cq values and Tm from the qPCR results of the sample isolates were 15.98 (4KJ), 14.90 (19KG), 14.6 (3KJ), 13.77 (20KG), 12.56 (5KGB), and 12.20 (6KJ). Tm values are 86.7 (4KJ), 86.69 (3KJ), 86.56 (5KGB), 85.88 (20KGB), 85.81 (19KG), and 85.74 (6KJ). Conclusion: Validation, standardization of the development, and modification of qPCR technology must be carried out to harmonize testing throughout to avoid wrong interpretation of the test results so that the determination of actions to eradicate and control diseases originating from animals in the field does not occur. Keywords: Escherichia coli 0157:H7, chuA, qPCR, Horse, Invasive. IntroductionThe majority of facultative organisms in the gastrointestinal system are Escherichia coli. Due to the presence of particular virulence factors and genes linked with pathogenicity that are typically absent in other E. coli, pathogenic strains of E. coli can cause a range of diarrheal illnesses in hosts. However, some strains of E. coli can also lead to further intestinal infections (Darvishi et al., 2020). E. coli is a common cause of meningitis, septicemia, diarrhea, and outpatient urinary tract infections (UTIs) in women worldwide (Pokharel et al., 2023). Various diseases found in animals and humans are caused by many pathogenic strains invasive enterohemorrhagic of E. coli, although most of them coexist in safe symbiosis (Hu et al., 2022). However, the majority of them coexist in safe symbioses. Community- and nosocomial-related UTIs are primarily caused by E. coli. The second most typical infectious presentation in general practice is UTI. There is growing concern over the emergence and dissemination of different antibiotic resistance mechanisms among prevalent human pathogenic Enterobacteriaceae members, reducing the number of treatment alternatives (Boucher et al., 2009). A significant clinical issue is the ongoing rise of antibiotic resistance among clinical bacterial strains. The most significant danger to managing infectious diseases is the rapid growth of antibiotic resistance among common pathogens (Adamus-Bialek et al., 2013). In addition to sepsis, newborn meningitis, gastroenteritis, and several infections, such as UTIs, pathogenic strains of E. coli can cause a wide range of intestinal and extra-intestinal disorders (Coura et al., 2015; Khan et al., 2017). The respiratory system is the second most common reported illness, while UTI is one of the most prevalent bacterial consequences. Escherichia coli is the most prevalent bacteria that can infect the urinary system. 80%–90% of UTIs are caused by E. coli, which is still the most common bacteria in the urinary tract worldwide (Lee et al., 2016). According to an in vitro genome analysis of E. coli strains belonging to various phylogenetic groups, particular genes or bacterial DNA fragments can be utilized as specific markers for the phylogenetic classification of the E. coli strain (Coura et al., 2017). The chuA gene, which is required for the transmission of invasive enterohemorrhagic species E. coli O157: H7, is present in three proposed particular markers. qPCR is employed as a straightforward and quick method with higher sensitivity and specificity because other techniques need more involved and time-consuming procedures needing a collection of model strains (Gordon et al., 2008). According to host niche, pathogenicity, antibiotic resistance, and most significantly certain virulence factors, bacteria exhibit distinct characteristics (Shaheen et al., 2013). Horses are non-ruminant herbivorous mammals with one-toed hooves that belong to the Equidae family. These animals are well-built and capable of covering lengths of up to 16 km per day, making them popular choices for usage as draft animals and riders (Wibisono et al., 2017). In Indonesia, riding horses and horse-drawn carriages are common forms of transportation for equines ( Equus caballus Linnaeus, 1758). This animal serves as a vital mode of transportation and a source of money for the neighborhood. Observations show that Sumbawa Island has many working horses, many of which are employed for transport and serve as a tourist draw in and of themselves. The upkeep of working horses necessitates consideration for the implementation of animal welfare based on upholding the five principles of animal freedom (the “five freedoms”), free from harm, illness, and disease, one of which is infection by microorganisms that cause disease in horses and reduce the performance and productivity of working horses (Scala et al., 2020). Materials and MethodsSample collectionA total of 52 samples of working horse feces from Sumbawa Island, the province of west Nusa Tenggara, Indonesia. Samples were collected and put into buffered peptone water media, and each sample was labeled and explained accordingly. In the sample transportation process, all sample specimens were put into a coolbox containing an ice pack and immediately transported to the laboratory. The tools used in testing E. coli 0157:H7 isolates and the chuA gene from workhorse feces samples, using the qPCR method, namely scales, rollers, scissors, cutting boards, water baths, incubators, micropipettes, tips, Schott Duran, pellets, centrifuges, vortex, PCR tube, stomacher bag, Laminar air flow, Spindown, real-time PCR machine, cutting board and ruler. Materials used include: pure culture E. coli isolate 0157:H7, buffered peptone water, Go Taq qPCR Master Mix (GoTaq® 1-Step RT-qPCR System) (Promega, 2023), Primer chuA R (1,000 μM Solution), Primer chuA F (1,000 μM Solution), internal amplification control (IAC) DNA template (0.75 pg/μl), 20% sucrose (0.22 μM filter-sterilized) and PCR grade water, lysis buffered. The primer sequences used in this study can be seen in Table 1. DNA isolation of E. coli 0157:H7 chuA geneThe preparation stage consists of isolating the culture of E. coli on eosin methylene blue agar (EMBA) and isolation of DNA genomes of E. coli all samples were weighed in a microtube, and then tissue lysis buffer and proteinase K solution were added. The mixture was vortexed and incubated at 57°C for 20 hours. The binding buffer solution was added to all the samples that had been incubated and after homogenization, they were re-incubated at a temperature of ±70°C for 10 minutes. Then the sample was added with absolute isopropanol and homogenized. The mixture is put into a filter tube, and then centrifuged. The liquid that passes through the filter is discarded, then the inhibitor removal buffer is added and centrifuged again. Next, washing buffer is added, and centrifuged, and then the solution is discarded. Finally, DNA was eluted by adding elution buffer at 70°C, then centrifuged. The microtubes contain DNA isolates. The DNA isolate obtained was analyzed for its presence using agarose electrophoresis and DNA concentration and purity were analyzed using ultraviolet (UV) spectrophotometry. In the screen system, the “nucleic acid” panel is selected for the sample to be cleaned with sterile tissue. An elution buffer was used as a blank. A total of 2 μl of sample DNA was placed on the sample holder. Then the “measure” button is clicked. DNA was analyzed at wavelengths of 260 and 280 nm. The results of the instrumentation will provide data on DNA concentration in ng/μl and DNA purity by comparing the ratio of A280 and A260 (BioDrop, 2015). DNA amplification using qPCRDNA amplification using the SYBR Green method is carried out in the following way. SYBR green mastermix was prepared with a total volume of 20 μl consisting of 5 μl of tested DNA; 3 μl aquabidest; 1 μl forward primer 10 μM; 1 μl reverse primer 10 μM; and 10 μl LightCycler® 480 SYBR Green. A total of 5 μl of DNA was to be tested and 15 μl of SYBR green Mastermix was put into the multiwell. The next mixture, real-time PCR is turned on, program settings are carried out, and the tool is run (Table 2) (Roche, 2012). Table 1. Target genes and DNA primers for bacterial identification of enterohemorrhagic invasive species E. coli 0157:H7.
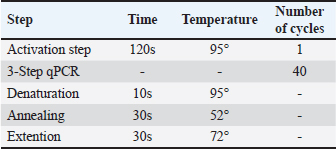
Table 2. Cycle stages in qPCR.
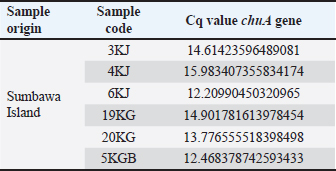
DNA amplification using a hydrolysis probe is carried out with the following procedure. Hydrolysis probe mastermix was prepared with a total volume of 20 μl consisting of 5 μl of tested DNA; 1.4 μl aquabidest; 1.6 μl forward primer 10 μM; 1.6 μl reverse primer 10 μM; 0.4 μl 10 μM probe; and 10 μl LightCycler® 480 Probe master (Taq DNA Polymerase enzyme, dNTP mix, and 6.4 mM MgCl2). A total of 5 μl of DNA was to be tested and 15 μl of mastermix was put into a multiwell plate. The mixture is homogenized. Next, real-time PCR is turned on, program settings are carried out, and the tool is run (Roche, 2008). Ethical approvalNot needed for this study. ResultsThe qPCR method is an accurate and efficient method used to detect the presence of DNA more specifically for the detection of the chuA gene as the gene encoding enterohaemorrhagic invasive species E. coli 0157:H7 in feces samples from working horses on the island of Sumbawa. The results of this test explain the general conditions of the research, DNA amplification of working horse feces samples using qPCR. Sample analysis is important to obtain data quality. This is related to the implementation of quality assurance (QA) and quality control (QC) systems to ensure that the working system can run correctly and appropriately so that the data obtained is of good quality. Apart from QA and QC, an important factor in obtaining data quality is to carry out validation analysis to determine the accuracy of the tests carried out, namely standardized and optimized correctly and appropriately (Hewajuli and Dharmayanti, 2014). The following are the results of the Cq (quantification cycle) values in horse feces samples on Sumbawa Island which experienced an increase in the amplification curve. DiscussionThe method for detecting the chuA gene of enterohaemorrhagic invasive species E. coli 0157:H7 using the qPCR method can be carried out using the pre-enrichment method and without the pre-enrichment method. In this research, pre-enrichment was used. The pre-enrichment stage aims to increase the number of bacteria because PCR protocols generally require very high concentrations of target microorganisms which are usually obtained only after sample enrichment (Garrido-Maestu et al., 2020). The pre-enrichment stage is important as an effort to reduce negative errors in testing (Nurjanah et al., 2021). qPCR is a reliable, effective, and reliable DNA-based analysis method (Zilhadia et al., 2017). This method has the advantages of being able to identify small samples, not having to visualize, the risk of contamination is small and can examine a large number of samples at once (Zhang et al., 2021). qPCR with SYBR Green fluorescent staining is a detection method and is also able to differentiate between fresh and processed products (Law et al., 2015). Analysis of DNA amplification from qPCR results based on the cycle threshold (Ct) value on the amplification curve. Ct is the number of cycles the sample begins to be read which indicates the beginning of the exponential growth phase. The lower the Ct value, the higher the amount of target DNA. Conversely, the higher the Ct value, the lower the amount of target DNA. The results of DNA amplification using qPCR on the E. coli 0157:H7 isolate sample carried out with SYBR green staining were seen through the increase in the curve and the Ct value on the amplification curve. The specificity of the amplification results can be seen through the Tm value on the melt curve (Zilhadia et al., 2017). Table 3. Results of Cq values in fecal samples from working horses on the island of Sumbawa.
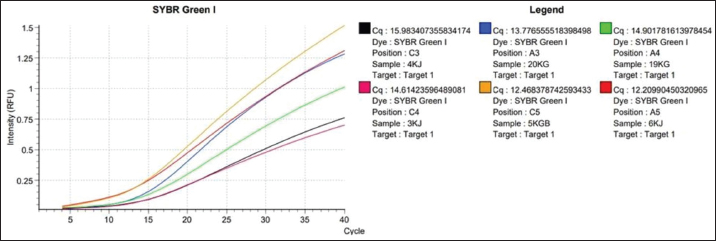
Fig. 1. Amplification curve using the SYBR Green method using the chuA primer. Color Description: Red: 3KJ, Black: 4KJ, Orange: 6KG, Green: 19KG, Blue: 20KG, Yellow: 5KGB. Amplification stages of the qPCR process using Go Tag qPCR Master Mix (Promega), PCR amplification usually uses 35–40 cycles (Maulani et al., 2020), but in this study, 40 cycles were used. This is because in cycle 40 there is amplification of the DNA sequence. Go Tag qPCR Master Mix (Promega), forward primer, reverse primer, nuclease-free water, and DNA (Promega, 2023). Next, the mixture is vortexed, which aims to help mix the solution perfectly (Nurhayati and Darmawati, 2017). The melting curve occurs at a temperature of 95oC for 5 seconds, at a temperature of 60oC, and at a temperature of 97oC, the melting curve aims to determine whether there are mutations or single changes in the DNA nucleotide bases (Tong and Giffard, 2012). In this study, the total number of qPCR cycles was 40 times. Based on data in Table 3, the qPCR results of the enterohaemorrhagic invasive species E. coli 0157:H7 chuA gene identified sample 3KJ with a Cq of 14.61, sample 4KJ with a value of Cq 15.98, sample 6KJ with a value of Cq 12.20, sample 19KG with a value of Cq 14.90, sample 20 KG with a value of Cq 13.77, and sample 5KGB with a Cq value of 12.46. The test results are in the form of an amplification graph which can be seen in Figure 1. showing the results of the test amplification curve. The blue curve of the E. coli 0157:H7 chuA gene indicates the presence of the chuA gene or E. coli 0157:H7 DNA. The curve will be active if the enterohemorrhagic invasive species E. coli 0157:H7 chuA gene DNA is detected during the amplification process. chuA functions to detect the target DNA that you want to read. The intersection point between the sigmoid graph and the baseline threshold when reflected on the x-axis (cycle) is the threshold cycle (Ct) for the amplified sample (Pestana et al., 2010). In the amplification curve for testing the enterohaemorrhagic invasive species E. coli 0157:H7 chuA gene, the sigmoid graph intersects with the baseline threshold in the cycle (14.61, 15.98, 12.20, 14.90, 13.77, 12.46). The results of the increase in fluorescence are depicted through an amplification curve which shows three phases, namely the initial phase, exponential or peak phase, and plateau or stable phase (Vaerman et al., 2004: Zilhadia et al., 2017). In real-time PCR testing produces around one billion DNA molecules. The data obtained is in the form of purity DNA and the graph shows the presence of DNA of the chuA gene as a gene encoding the enterohemorrhagic invasive species E. coli in fecal samples of working horses on Sumbawa Island using RT-PCR. All samples in this study were amplified with varying increases but were still in a small range. This increase shows and describes the number of products amplified in each sample. The 5KGB sample curve experienced the highest increase while the 3KJ sample curve experienced the lowest increase. This shows that the 5KGB sample has the highest number of amplified products, while the 3KJ has the lowest number of amplified products. The results of testing samples on working horse feces showed that there were amplified samples, indicated by the quantification cycle (Cq) value). From the test results of 52 working horse feces samples, six sample isolates showed an increase in the amplification curve. The amplified samples have Cq values that are different from each other. The sample with the highest Cq value in detecting the chuA gene of the invasive enterohemorrhagic species E. coli 0157:H7 is shown in sample code 4KJ with a Cq value reaching 15.98. Meanwhile, the lowest Cq value was shown in the 6KG code sample with a Cq value reaching 12.20. qPCR uses fluorescence dyes and fluorescence probes. In this study, a fluorescence dye was used, namely a hydrolysis probe (TaqMan probe) using specific oligonucleotides that are complementary to the DNA to be amplified. The fluorescent hydrolysis probe will glow when the reporter and quencher are separated through hydrolysis due to nuclease activity. The hydrolysis probe works specifically and can prevent the occurrence of primer-dimers and mispriming, thereby causing non-specific amplification products (Zilhadia et al., 2017).
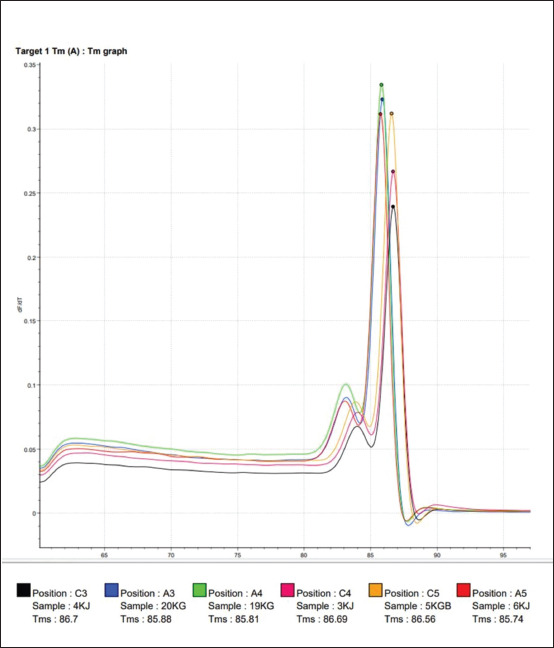
Fig. 2. Melting temperature (Tm) value from amplification using the SYBR Green method for working horse feces samples on Sumbawa Island using the E. coli 0157; H7 chuA gene primer. Color description: Red: 3KJ, Black: 4KJ, Orange: 6KG, Green: 19KG, Blue: 20KG, Yellow: 5KGB. The use of specific probes will help increase the specificity of the qPCR test; however, qPCR requires relatively expensive equipment and reagents, and requires good understanding and correct techniques to get accurate results. qPCR has the working principle of detecting and quantifying fluorescent reporters. The signal from the fluorescent will increase as the DNA amplification product increases in the reaction. Reactions during the exponential phase can be monitored by observing and recording the amount of fluorescent emission in each cycle. The increase in the amplification curve in the exponential phase is closely related to the number of target gene initiations. Therefore, the higher the expression level of the target gene, the faster the detection of fluorescent emissions will occur (Hewajuli and Dharmayanti, 2014). An amplification curve will appear and form during the amplification process. The function of the amplification curve itself is to determine whether amplification occurs in the thermal cycler used. This amplification is determined based on the intensity of the fluorescent, that is, if more amplification products are produced, the greater the accumulation of fluorescent that will be read (Pratama, 2015). qPCR has high sensitivity and has advantages compared to conventional PCR. qPCR is considered more dynamic, can be used for more testing, and has less risk of contamination. The results of amplification with the primer chuA gene of the invasive enterohemorrhagic species E. coli 0157:H7 using the Go Tag Master Mix protocol (GoTaq® 1-Step RT-qPCR System) and quantification kit will answer the core problem of this research, whether the chuA gene of invasive species is present and detected enterohaemorrhagic E. coli 0157:H7 in fecal samples of working horses on the island of Sumbawa. In addition, many molecular-based analysis methods can be used because of the fast process and results in research, one of which is the DNA-based method which has been widely developed, such as fingerprinting using PCR, multiplex PCR assay, and real-time PCR; this method has been widely used for several last decades (Manalu and Rohman, 2019). The results of DNA amplification of the chuA gene of the invasive enterohemorrhagic species E. coli 0157:H7 using qPCR can be used as an analysis to detect the presence of DNA other than in horse feces. This is because the use of hydrolysis probes can be used for multiplex qPCR using target DNA and more than one partner in a reaction. After all, the probe will bind specifically to several different target DNAs (Harisah, 2017). The increasing amplification curve shows an increase in the concentration of DNA paired with the primer being tested. The increase in this curve occurs due to an increase in fluorescent light when it binds to double-stranded DNA. The resulting fluorescence is appropriate and proportional to the amount of amplified template DNA (Rasyid, 2015). To test the specificity of the chuA primer using the SYBR green method, followed by analyzing the Tm value. The Tm value resulting from amplification using the SYBR Green method using the chuA primer can be seen in Figure 2. DNA isolates from workhorse feces samples with sample codes 3KJ and 4KJ have the same Tm value, namely at a temperature of 86.7°C. The Tm values of sample codes 6KJ (85.74), 19KG (85.81), and 20KG (85.88) have almost the same Tm values. Isolate with sample code 5KGB with a Tm value of 86.56. The highest Tm value was found in the isolate with sample code 4KJ (86.7) and the lowest Tm value was found in the isolate with sample code 6KJ (85.74). The Tm value is the Tm of the amplification target DNA. A good primer pair is that the two primers have a difference in Tm value of no more than 2°C. Thus, the bovine primers for analyzing bovine meat and gelatin DNA using the SYBR green method are specific primers (Smith and Osborn, 2008). Melt curve analysis is carried out by increasing the temperature until it reaches the melting temperature, 50% of double-stranded DNA will separate into single strands at this melting temperature (Nur’utami, 2011). Single-stranded DNA will bind to the specific primer chuA while non-specific double-stranded DNA will bind to SYBR green. Based on the melt curve in Figure 2, the six samples tested show that the melting temperature values are different and there are three melt peaks. Amplicons originating from the same target DNA will have almost the same Tm value. The qPCR method for this parameter was proven to identify the chuA gene as the coding gene for the invasive enterohemorrhagic species E. coli 0157:H7. This is following research that has been carried out previously using the same method (Septiani and Pandianto, 2018), which states that the qPCR method is fast and reliable so it is appropriate to use it as a method to detect the presence of the invasive enterohemorrhagic species E. coli 0157:H7 in the feces of working horses in Sumbawa Island. ConclusionIn conclusion, the qPCR method can amplify the DNA of the chuA gene as a gene encoding the invasive enterohaemorrhagic species E. coli 0157:H7 using specific primers, with a denaturation temperature of 95°C for 10 seconds, annealing of 52°C for 30 seconds, and a temperature of 72°C for 30 seconds. An increase in the amplification curve occurred in all samples tested, based on the DNA amplification curve with qPCR of horse feces samples on the island of Sumbawa, the invasive enterohemorrhagic species E. coli 0157:H7 was detected. This research confirms that there is an invasive species of enterohemorrhagic E. coli 0157:H7 originating from the feces of working horses on the island of Sumbawa. Working horses are an important reservoir for the clinical isolation of invasive species, which pose potential public health risks. This must not be ignored and monitoring must be provided in the environment to prevent cases of infection from originating from animals to humans. AcknowledgmentsThe authors would like to thank the Directorate of Research, Technology, and Community Service (DRTPM), Ministry of Education, Culture, Research, and Technology (Kemendikbudristek) of the Republic of Indonesia for funding this research through the Penelitian Fundamental Reguler (PFR) scheme in 2023. The authors would also like to thank the Institute of Tropical Disease Universitas Airlangga for helping and providing a place for biomolecular testing in this study. FundingThe study was funded by the Directorate of Research, Technology, and Community Service (DRTPM), Ministry of Education, Culture, Research, and Technology (Kemendikbudristek) of the Republic of Indonesia through the Penelitian Fundamental Reguler (PFR) scheme in 2023 (Contract Number: 184/E5/PG.02.00.PL/2023 and 3538/LL8/AL/04/2023). Conflict of interestThere is no conflict of interest in this study. Author’s contributionAll authors conceptualized the idea and design of the study. KK and AS performed material preparation, data collection, and analysis. KHPR, ARK, and SCK supervised the entire research process. All the authors read and approved the final manuscript. Data availabilityAll data are available in the manuscript. ReferencesAdamus-Bialek, W., Zajac, E., Parniewski, P. and Kaca, W. 2013. Comparison of antibiotic resistance patterns in collections of Escherichia coli and Proteus mirabilis uropathogenic strains. Mol. Biol. Rep. 40(4), 3429–3435. Biodrop, 2015. Quick Start Guide. Available at: http://www.biodrop.co.uk [Accessed on 05/01/2024]. Boucher, H.W., Talbot, G.H., Bradley, J.S., Edwards, J.E., Gilbert, D., Rice, L.B., Scheld, M., Spellberg, B. and Bartlett, J. 2009. Bad bugs, no drugs: no ESKAPE! An update from the Infectious Diseases Society of America. Clin. Infect. Dis. 48(1), 1–12. Coura, F.M., de Araújo Diniz, S., Mussi, J.M.S., Silva, M.X., Lage, A.P. and Heinemann, M.B. 2017. Characterization of virulence factors and phylogenetic group determination of Escherichia coli isolated from diarrheic and nondiarrheic calves from Brazil. Folia Microbiol. (Praha) 62(2), 139–144. Coura, M.F., Diniz, S.D.A., Silva, M.X., Mussi, J.M.S., Barbosa, S.M., Lage, A.P. and Heinemann, M.B. 2015. Phylogenetic group determination of Escherichia coli isolated from animals samples. Scientific World J. 2015(1), 258424. Darvishi, M., Forootan, M., Nazer, M.R., Karimi, E. and Noori, M. 2020. Nosocomial Infections, Challenges and Threats: A Review Article. Iran J. Med. Microbiol. 14(2), 162–181. Harisah, S.U. 2017. Analysis of pork contamination in beef sausages circulating at parung market using real-time polymerase chain reaction (PCR). Thesis, Syarif Hidayatullah State Islamic University, Jakarta, Indonesian. Hewajuli, D.A. and Dharmayanti, N.L.P.I. 2014. The advance of technology of reverse transcriptase-polymerase chain reaction in identifying the genome of avian influenza and newcastle diseases. Wartazoa 24(1), 6–29. Hu, J., Afayibo, D.J.A., Zhang, B., Zhu, H., Yao, L., Guo, W., Wang, X., Wang, Z., Wang, D., Peng, H., Tian, M., Qi, J. and Wang, S. 2022. Characteristics, pathogenic mechanism, zoonotic potential, drug resistance, and prevention of avian pathogenic Escherichia coli (APEC). Front. Microbiol. 13(1), 1049391. Garrido-Maestu, A., Azinheiro, S., Roumani, F., Carvalho, J. and Prado, M. 2020. Application of short pre-enrichment, and double chemistry real-time PCR, combining fluorescent probes and an intercalating dye, for same-day detection and confirmation of Salmonella spp. and Escherichia coli O157 in ground beef and chicken samples. Front. Microbiol. 11(1), 591041. Gordon, D.M., Clermont, O., Tolley, H. and Denamur, E. 2008. Assigning Escherichia coli strains to phylogenetic groups: multilocus sequence typing versus the PCR triplex method. Environmen. Microbiol. 10(10), 2484–2496. Khan, S.B., Zou, G., Cheng, Y.T., Xiao, R., Li, L., Wu, B. and Zhou, R. 2017. Phylogenetic grouping and distribution of virulence genes in Escherichia coli along the production and supply chain of pork around Hubei, China. J. Microbiol. Immunol. Infect. 50(3), 382–385. Law, J.W., Ab Mutalib, N.S., Chan, K.G. and Lee, L.H. 2015. Rapid methods for the detection of foodborne bacterial pathogens: principles, applications, advantages and limitations. Front. Microbiol. 5(1), 770. Lee, J.H., Subhadra, B., Son, Y.J., Kim, D.H., Park, H.S., Kim, J.M., Koo, S.H., Oh, M.H., Kim, H.J. and Choi, C.H. 2016. Phylogenetic group distributions, virulence factors and antimicrobial resistance properties of uropathogenic Escherichia coli strains isolated from patients with urinary tract infections in South Korea. Lett. Appl. Microbiol. 62(1), 84–90. Machado, E., Cantón, R., Baquero, F., Galán, J.C., Rollán, A., Peixe, L. and Coque, T.M. 2005. Integron content of extended-spectrum-beta-lactamase-producing Escherichia coli strains over 12 years in a single hospital in Madrid, Spain. Antimicrob. Agents Chemother. 49(5), 1823–1829. Manalu, H.Y. and Rohman, A. 2019. The use of primer-specific targeting on mitochondrial cytochrome b combined with real-time polymerase chain reaction for the analysis of dog meat in meatballs. Trop. Life Sci. Res. 30(3), 1–14. Maulani, R., Susilo, H., Indriati, M. and Suhaemi, A. 2020. Detection of pig DNA contamination with RT-PCR in sosis without halal labels from District Pandeglang. Gorontalo Agric. Technol. J. 3(2), 72–80. Nur’utami, D.A. 2011. Analysis method isolation and identification of Salmonella typhimurium in milk using thereal-time polymerase chain reaction (PCR) method. Thesis, Bogor Agricultural Ins., Bogor, Indonesian. Nurhayati, B. and Darmawati, S. 2017. Teaching Materials for Medical Laboratory Technology (TLM): cell and molecular biology. Kemenkes RI, Jakarta. Nurjanah, S., Rahayu, W.P., Dewanti, H.R., Asthiti, N.G.A.M.W. and Melati, R.P. 2021. Simplex and multiplex preenrichment-pcr for detection of Salmonella enteritidis and typhimurium in chicken carcasses. J. Food Technol. Ind. 32(2), 148–156. Pestana, E.A, Belak, S., Diallo, A., Crowther, J.R. and Viljoen, G.J. 2010. Early rapid and sensitive veterinary molecular diagnostics real-time PCR application. Dordrecht (DE), The Netherlands: Springer Science & Bussiness Media. Pokharel, P., Dhakal, S. and Dozois, C.M. 2023. The diversity of Escherichia coli pathotypes and vaccination strategies against this versatile bacterial pathogen. Microorganisms 11(2), 344. Pratama, P. 2015. Application of real-time PCR to detect Salmonella sp. on fishery products. Thesis, Department of Aquatic Products Technology, Faculty of Fisheries and Marine Sciences, Bogor Agricultural Ins., Bogor, Indonesian. Promega. GoTaq® 1-Step RT-qPCR System Technical Manual. 2023. Madison, WI: Promega Corporation. Rasyid, S. 2015. Analysis of pork contamination in beef meatball products circulating in the ciputat area using real-time polymerase chain reaction (PCR) with the hydrolysis probe method. Thesis, UIN Syarif Hdayatullah Jakarta, Jakarta, Indonesian. Roche. 2008. The LightCycler® 480 Instrument Operator’s Manual, pp: 9–293. Roche. 2012. The LightCycler® 480 System Unleash the Potential of Real-Time PCR, pp: 1-19. Scala, A., Cammack, J.A., Salvi, R., Scieuzo, C., Franco, A., Bufo, S.A., Tomberlin, J.K. and Falabella, P. 2020. Rearing substrate impacts growth and macronutrient composition of Hermetia illucens (L.) (Diptera: Stratiomyidae) larvae produced at an industrial scale. Sci. Rep. 10(1), 19448. Septiani. T. and Pendrianto, P. 2018. Detection of mice DNA in meatballs using real time-PCR. J. Environ. Sci. 2(2), 63–67. Shaheen, B.W., Nayak, R., Foley, S.L. and Boothe, D.M. 2013. Chromosomal and plasmid mediated fluoroquinolone resistance mechanisms among broad-spectrum cephalosporin-resistant Escherichia coli isolates recovered from companion animals in the USA. J. Antimicrob. Chemother. 68(5), 1019–1024. Smith, C.J. and Osborn, A.M. 2009. Advantages and limitations of quantitative PCR (Q-PCR) based approaches in microbial ecology. FEMS Microbiol. Ecol. 67(1), 6–20. Tong, S.Y. and Giffard, P.M. 2012. Microbiological applications of high-resolution melting analysis. J. Clin. Microbiol. 50(11), 3418–3421. Vaerman, J.L., Saussoy, P. and Ingargiola, I. 2004. Evaluation of real-time PCR data. J. Biol. Regul. Homeost. Agents. 18(2), 212–214. Wibisono, H.W., Wandia, I.N. and Suatha, I.K. 2017. Morphometry of adult male horses (Equus caballus) kept in East Lombok Regency, West Nusa Tenggara. Indones. Med. Vet. 6(1), 55–61. Zhang, Y., Li, H., Shang, S., Meng, S., Lin, T., Zhang, Y. and Liu, H. 2021. Evaluation validation of a qPCR curve analysis method and conventional approaches. BMC Genomics 22(Suppl 5), 680. Zilhadia, Z., Izzah, A.N. and Betha, O.S. 2017. Comparison of the SYBR green and hydrolysis probe methods in the analysis of cattle and pig gelatin DNA using real-time PCR. J. Pharm. Clin. Sci. 4(2), 16–23. | ||

| How to Cite this Article |
| Pubmed Style Kholik K, Sukri A, Riwu KHP, Kurniawan SC, Khairullah AR. Detection of the chuA gene encoding the invasive enterohemorrhagic species Escherichia coli 0157:H7 using qPCR in horse feces samples on Sumbawa Island, Indonesia. Open Vet. J.. 2024; 14(4): 1051-1058. doi:10.5455/OVJ.2024.v14.i4.12 Web Style Kholik K, Sukri A, Riwu KHP, Kurniawan SC, Khairullah AR. Detection of the chuA gene encoding the invasive enterohemorrhagic species Escherichia coli 0157:H7 using qPCR in horse feces samples on Sumbawa Island, Indonesia. https://www.openveterinaryjournal.com/?mno=186481 [Access: January 25, 2026]. doi:10.5455/OVJ.2024.v14.i4.12 AMA (American Medical Association) Style Kholik K, Sukri A, Riwu KHP, Kurniawan SC, Khairullah AR. Detection of the chuA gene encoding the invasive enterohemorrhagic species Escherichia coli 0157:H7 using qPCR in horse feces samples on Sumbawa Island, Indonesia. Open Vet. J.. 2024; 14(4): 1051-1058. doi:10.5455/OVJ.2024.v14.i4.12 Vancouver/ICMJE Style Kholik K, Sukri A, Riwu KHP, Kurniawan SC, Khairullah AR. Detection of the chuA gene encoding the invasive enterohemorrhagic species Escherichia coli 0157:H7 using qPCR in horse feces samples on Sumbawa Island, Indonesia. Open Vet. J.. (2024), [cited January 25, 2026]; 14(4): 1051-1058. doi:10.5455/OVJ.2024.v14.i4.12 Harvard Style Kholik, K., Sukri, . A., Riwu, . K. H. P., Kurniawan, . S. C. & Khairullah, . A. R. (2024) Detection of the chuA gene encoding the invasive enterohemorrhagic species Escherichia coli 0157:H7 using qPCR in horse feces samples on Sumbawa Island, Indonesia. Open Vet. J., 14 (4), 1051-1058. doi:10.5455/OVJ.2024.v14.i4.12 Turabian Style Kholik, Kholik, Akhmad Sukri, Katty Hendriana Priscilia Riwu, Shendy Canadya Kurniawan, and Aswin Rafif Khairullah. 2024. Detection of the chuA gene encoding the invasive enterohemorrhagic species Escherichia coli 0157:H7 using qPCR in horse feces samples on Sumbawa Island, Indonesia. Open Veterinary Journal, 14 (4), 1051-1058. doi:10.5455/OVJ.2024.v14.i4.12 Chicago Style Kholik, Kholik, Akhmad Sukri, Katty Hendriana Priscilia Riwu, Shendy Canadya Kurniawan, and Aswin Rafif Khairullah. "Detection of the chuA gene encoding the invasive enterohemorrhagic species Escherichia coli 0157:H7 using qPCR in horse feces samples on Sumbawa Island, Indonesia." Open Veterinary Journal 14 (2024), 1051-1058. doi:10.5455/OVJ.2024.v14.i4.12 MLA (The Modern Language Association) Style Kholik, Kholik, Akhmad Sukri, Katty Hendriana Priscilia Riwu, Shendy Canadya Kurniawan, and Aswin Rafif Khairullah. "Detection of the chuA gene encoding the invasive enterohemorrhagic species Escherichia coli 0157:H7 using qPCR in horse feces samples on Sumbawa Island, Indonesia." Open Veterinary Journal 14.4 (2024), 1051-1058. Print. doi:10.5455/OVJ.2024.v14.i4.12 APA (American Psychological Association) Style Kholik, K., Sukri, . A., Riwu, . K. H. P., Kurniawan, . S. C. & Khairullah, . A. R. (2024) Detection of the chuA gene encoding the invasive enterohemorrhagic species Escherichia coli 0157:H7 using qPCR in horse feces samples on Sumbawa Island, Indonesia. Open Veterinary Journal, 14 (4), 1051-1058. doi:10.5455/OVJ.2024.v14.i4.12 |

