


| Original Article | ||
Open Vet J. 2021; 11(4): 587-597 Open Veterinary Journal, (2021), Vol. 11(4): 587–597 Original Research Insulin resistance indexes of grazing cows and mineral or vitamin supplementation under tropical conditionsKatherine García Alegría1, Rómulo Campos Gaona2*, Mauricio Vélez Terranova3 and Erika Andrea Hernández31Servicio Nacional de Aprendizaje, Buga, Colombia 2Departamento de Ciencia Animal, Facultad de Ciencias Agropecuarias, Universidad Nacional de Colombia, sede Palmira, Colombia 3Carrera de Agronomía, Instituto Tecnológico Superior de Tantoyuca, Tantoyuca, México *Corresponding Author: Rómulo Campos Gaona. Departamento de Ciencia Animal, Facultad de Ciencias Agropecuarias, Universidad Nacional de Colombia, sede Palmira, Colombia. Email: rcamposg [at] unal.edu.co Submitted: 02/08/2021 Accepted: 15/10/2021 Published: 02/11/2021 © 2021 Open Veterinary Journal
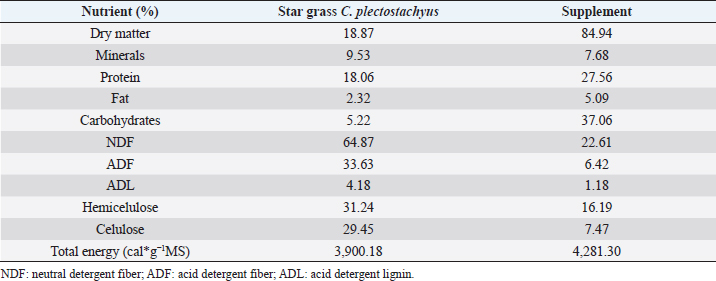
AbstractBackground: During the transition period in dairy cows, metabolic changes occur, many of which are related to energy metabolism, which causes metabolic diseases or productive alterations. Aim: The objective of the present work was to evaluate two mineral and vitamin supplementations related to metabolic regulation mechanisms associated with insulin during the transition period and the first phase of lactation in grazing cows under tropical conditions through metabolic indicators and insulin resistance indexes. Methods: Twenty-one animals were distributed in three groups: control (CTR), iodine supplementation (SUPP-1), and mixed mineral and vitamin supplementation (SUPP-2). The experimental period was from day 30 prepartum to day 45 postpartum. Evaluation of the body condition score and the blood samples’ collection by coccygeal venipuncture was carried out for serum analysis of metabolites, such as beta-hydroxybutyrate (BHB), glucose, and non-esterified fatty acids (NEFA), and hormones, such as insulin, thyroxine, triiodothyronine, and cortisol. Variables related to energy and hormone metabolism were analyzed. Four proposed indexes were calculated to identify insulin resistance: Homeostasis Model Assessment (HOMA), Quantitative Insulin Sensitivity Check Index (QUICKI), Revised Quantitative Insulin Sensitivity Check Index, and QUICKI–BHB. Through linear regression, the effect of metabolites and hormones on the indexes of insulin resistance studied was estimated. Results: The groups with supplementation did not show significant changes in the mobilization of body reserves, NEFA, or triiodothyronine for interaction between treatments and periods. HOMA and QUICKI indexes used to estimate insulin resistance showed an inverse correlation (−0.97; p<0.001), and a greater capacity of linear adjustment to estimate the evaluated metabolites. Conclusion: The indexes’ values of insulin sensitivity in the present work constitute a starting point in tropical dairy cows to characterize insulin resistance and metabolic alterations. Vitamins and mineral supplementation did not show a positive effect on the metabolism of dairy cows during the transition period and the first phase of lactation in the study. Keywords: Insulin resistance, Transition period, Dairy cows, Metabolism, Nutrition factors. IntroductionThe transition period and the first phase of lactation in dairy cows are characterized by physiological changes that allow the animals to modify the homeostatic conditions in search of a rapid homeorhesis and ensure the metabolic adequacy to finalize gestation, facilitate partum, begin milk synthesis, and develop uterine involution (Martens, 2020a). At the same time, depression of dry matter consumption and development of mammary tissue occur. These complex alterations have constituted a wide research area in which diverse hypotheses have been studied to understand homeostatic processes in animals with high selection for milk production (Gross and Bruckmaier, 2019). Dry matter consumption depression and high nutrient requirements for lactose synthesis (direct lactogenesis regulator) lead early postpartum cows towards a negative energy balance (Gobikrushanth et al., 2019). Several approaches to its origin and consequences have led to postulate insulin resistance as an important factor in energy regulation (Youssef et al., 2017). The direct relationship of insulin with physiological processes, such as glycolysis and synthesis, and catabolism of fat tissue (Abuelo et al., 2014) generates multiple theories about metabolic alterations during dairy cows peripartum; one of these has been the use of indexes derived from the glucose and insulin ratio (De Koster and Opsomer, 2013) and some indexes have been used in dairy cows and constitute an important resource to validate metabolic syndromes (Cincović et al., 2017). In addition to metabolic problems, grazing dairy cows under tropical conditions affects their feed intake due to thermal stress. The chemical composition of consumed forage does not always guarantee a complete supply of nutrients, especially in rapidly fermentable carbohydrates and minerals (Macmillan et al., 2020). On the other hand, iodine is a mineral deficient in some areas of the tropics since this mineral affects metabolism and climate adaptation and has been used in some works, showing effects on productive indexes (Raun, 2019). The role of minerals and vitamins during the transition period and the first phase of lactation presents information gaps, especially for grazing cows (Spears and Weiss, 2014). These possible deficiencies require mineral and vitamin supplementation to improve the supply of minerals that regulate metabolic functions. The objective of this work was to analyze the effect of two types of supplementation (mineral and vitamin) on the energetic metabolism determinate from the analysis of energy metabolites and four insulin resistance indexes in grazing cows during the transition period of grazing dairy cows under tropical conditions. Materials and MethodsLocationThe research was carried out in a semi-intensive dairy production system, located at 3°57 N and 76°15 W, at an altitude of 973 meters above sea level, and an average temperature of 25°C, corresponding to the tropical dry forest (BS-T) according to Holdridge’s classification (García et al., 2016). Experimental animals and treatmentsThe evaluated animals were Holstein dairy cows managed under grazing systems with star grass (Cynodon plectostachyus) and basic supplementation with commercial balanced feed (Table 1), which was supplied twice a day (morning and afternoon) during milking. For the study, 21 cows were selected whose expected calving date was between 30 and 45 days before the beginning of the experiment. The animals were selected according to individual milk production (herd average 20 l/day) and calving numbers (> 2). Subsequently, three groups of animals were established (seven cows/group), and in each group, one of the following treatments was randomly assigned: CTR=Control; No supplementation was assigned. SUPP-1=Iodine supplementation; it was administered by intramuscular parenteral route in doses of 3 ml / 100 kg body weight (BW) (620.4 mg / application / cow) every 15 days. SUPP-2=Mixed supplementation; it was administered by the intramuscular parenteral route every 15 days, a polymineral supplement (calcium, phosphorus, selenium, iodine, and zinc), besides a polyvitaminic supplement (complex B vitamins: B1, B2, B3, B6, and B12). The supplied dose was 1 ml / 20 kg of BW (vitamins and minerals net concentration application per cow was calcium 100 mg, phosphorus 2,000 mg, iodine 400 mg, zinc 400 mg, selenium 4.4 mg, vitamins B1 200 mg, B2 60 mg, B3 2,000 mg, B6 100 mg, and B12 2,000 mg). The experimental period was 75 days, with an interval between sample collections of 15 days. Samples were distributed as follows: two in the prepartum (30 and 15 days before partum), one sample at partum, and three subsequent samples, until day 45 postpartum. Studied variablesBody condition score (BCS) was evaluated during each sampling, on a scale of 1–5, where values close to 1 or 5 corresponded to thin or obese cows, respectively. The collection of blood samples by coccygeal venipuncture using vacuum tubes without anticoagulant and specific treatments were applied. Blood samples were centrifuged at 2,500 rpm for 25 minutes to obtain blood serum and stored in aliquots at −20°C for subsequent analysis of metabolites and hormones. Table 1. Bromatological analysis of star grass (C. plectostachyus) and supplements used in the experimental animals (grazing dairy cows) in tropical conditions.
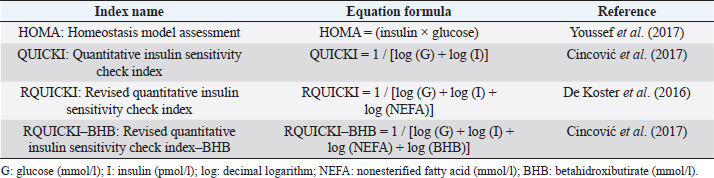
Table 2. Insulin resistance indexes used in the study for grazing dairy cows under tropical conditions.
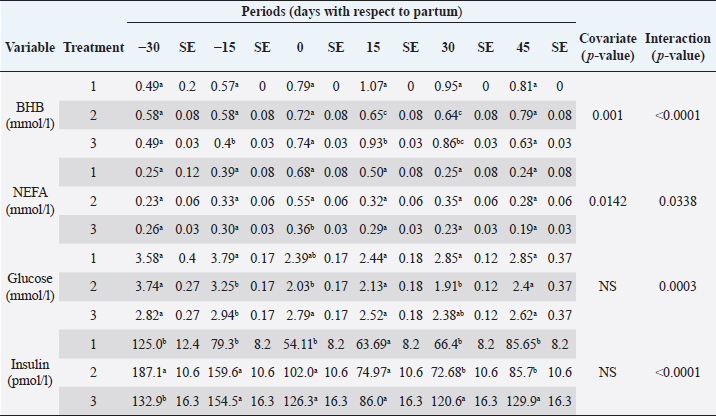
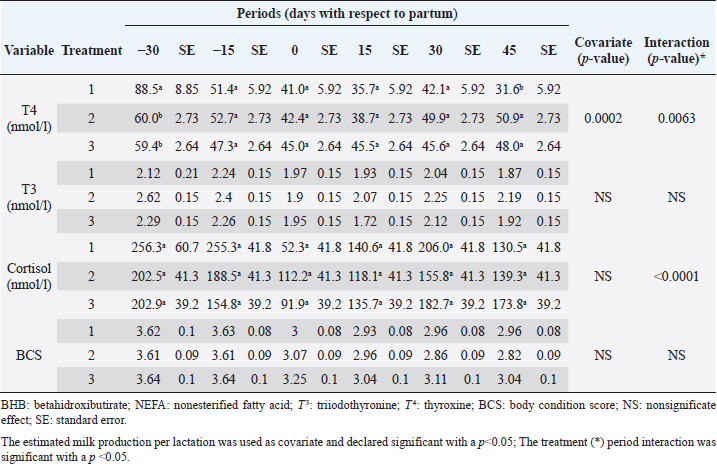
The analyzed metabolites like glucose, nonesterified fatty acids (NEFA), and beta-hydroxybutyrate (BHB) were analyzed through colorimetric enzymatic tests with commercial reagents (Randox®, Ireland). A standardized bovine serum level 2 was used in each test as an intra-assay control of which 1 control was used for every 15 samples, and semiautomatic equipment of wet chemistry and optical reading Rayto® (Shenzhen, China) was used for the analyses. Likewise, serum concentrations of insulin, thyroxine, triiodothyronine, and cortisol were determined through commercial kits, using the enzyme-linked immunosorbent assay (ELISA) technique in a Rayto® ELISA equipment. To estimate insulin resistance, several mathematical models were previously used in animals, as presented in Table 2. Statistical analysisIn the first place, data were subjected to one-dimensional descriptive statistics, including central tendency and dispersion measures of central tendency and dispersion. Later, the evaluated variables (metabolites, hormones, and insulin resistance) were analyzed through a mixed model of repeated measurements using SAS 9.1 statistical package. Treatments (n=3), periods (n=6), and their interaction constituted the fixed effects, while the animal within each treatment represented the random effect. The model included the estimated milk production by lactation as a covariate. Symmetric component, unstructured component, and first-order autoregressive analysis covariance structures were evaluated to control for correlation between close measurements over time. The model’s adjustment capacity was assessed, taking into account the Bayesian information criteria and the Akaike information criteria (Di Rienzo et al., 2017). The least-squared difference test was used for mean differentiation. Pearson’s moment correlation analysis was used to analyze the relationship between metabolites, hormones, and insulin resistance indexes. Likewise, equally linear regression analysis between metabolites and insulin resistance indexes was carried out, and the adjustment capacity was evaluated through the coefficient of determination (R2). All analyses were considered significant at p < 0.05. Ethical approvalThe experiment was endorsed by the Research Ethics Committee of the National University of Colombia, Palmira campus. ResultsMetabolites, hormones, and body conditionThe mean values and the standard error of the metabolites related to the insulin resistance indexes were determined for each treatment during the studied period (Table 3). Treatments generated variations in BHB, NEFA, glucose, insulin, thyroxine (T 4), and cortisol variables over time. On the other hand, triiodothyronine (T 3) and BCS behaved in a stable way throughout the experimental period. Comparison of treatments in each period showed that in Table 3 BHB levels were similar between treatments during prepartum and partum (0.4–0.79 mmol/l). BHB levels were higher in CTR for postpartum, with statistical differences found at days 15 and 30. BHB was similar for all 3 treatments at 45 days postpartum NEFA ranged from 0.19 to 0.68 mmol/l. Among treatments, differences were found at partum day, with CTR and SUPP-1 being higher than SUPP-2 (p < 0.05) with values above 0.50 mmol/l. Glucose showed low serum concentrations in all periods and treatments. Statistical differences were found between treatments at 15 days prepartum (CTR presented the highest value of 3.79 mmol/l), partum (CTR and SUPP-2 presented the highest values of 2.39–2.79 mmol/l), and at 30 days postpartum (CTR and SUPP-2 showed the highest values of 2.38–2.85 mmol/l). According to the established comparisons within the present study, similar cortisol levels were found between treatments. It should be noted that this variable was highly variable during the evaluated periods. In general, treatments’ behavior showed a tendency with high cortisol concentrations (t) 30 days prepartum (202.5–256.3 nmol/l), lower concentrations during partum (52.3–112.2 nmol/l), and then increased until it stabilized in the postpartum period (118.1–206.0 nmol/l). Thyroxine (T 4) levels were similar among treatments and differences were found at 30 days prepartum (CTR presented the highest concentration of 88.5 nmol/l) and at 45 days postpartum, with SUPP-1 and SUPP-2 treatments having high values (48–50.9 nmol/l). Table 3. Treatments’ mean values associated to analyzed metabolites through the experimental periods for grazing dairy cows under tropical conditions.
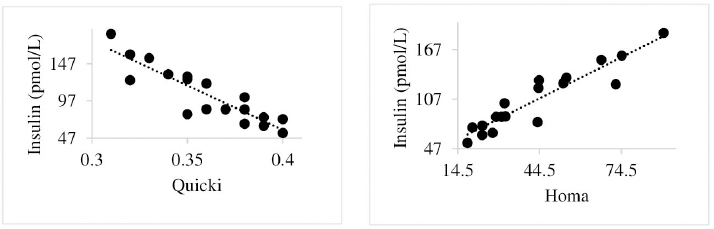
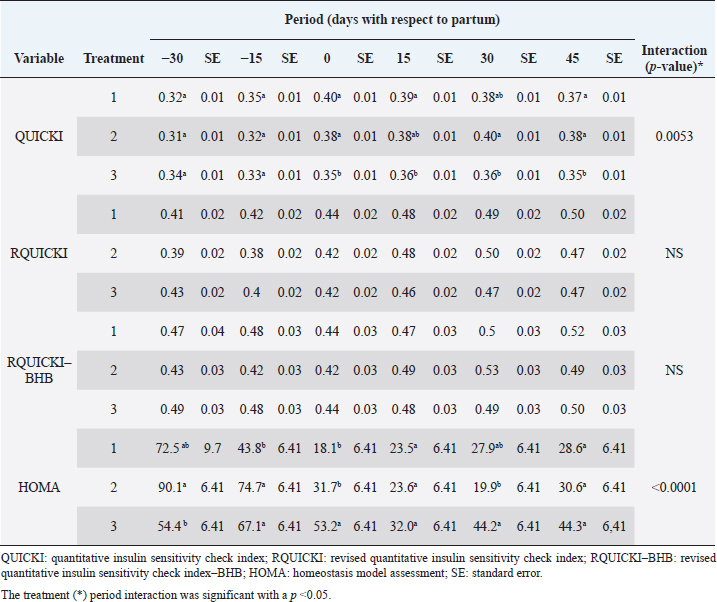
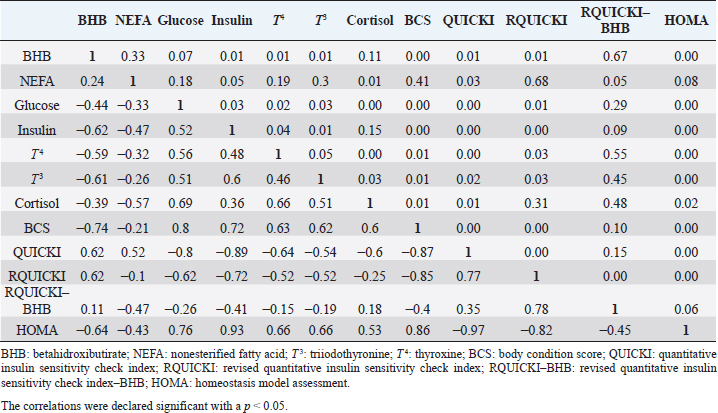
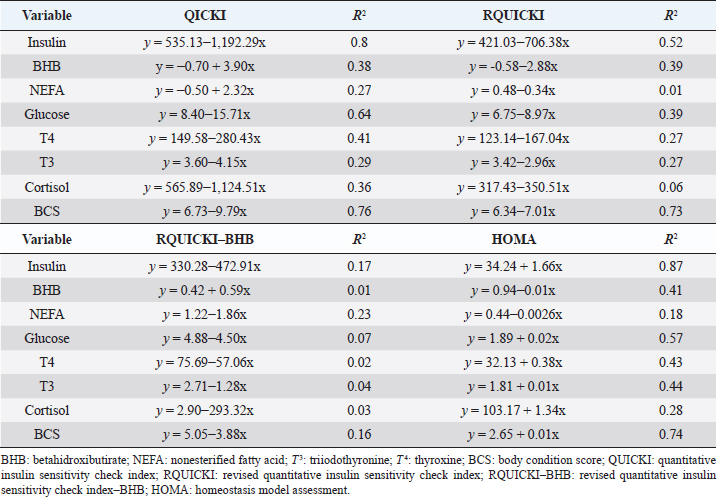
Insulin showed variations during the evaluated periods. At 15 days of antepartum and during partum, insulin concentrations were higher for SUPP-1 and SUPP-2 (102–159.6 pmol/l). On days 30 and 45 postpartum, SUPP-2 continued to show the highest concentrations (120.6–129.9 pmol/l). Triiodothyronine (T 3) levels and animals’ BCSs did not change during the evaluation period. T 3 values ranged between 1.72 and 2.62 nmol/l, while BCS averaged at 3.2. Insulin resistance indexesThe behavior of four different insulin resistance indexes was analyzed in six peripartum periods (Table 5). The homeostasis model assessment (HOMA) values varied through time in the evaluated treatments ranging between 18.1 and 90.1. SUPP-2 treatment showed the highest HOMA values during 15 days prepartum, partum, and 30 days postpartum (p < 0.05). The quantitative insulin sensitivity check index (QUICKI) also varied during the analyzed periods, determining that CTR and SUPP-1 treatments presented the highest values since partum to 45 days postpartum (p < 0.05), ranging from 0.31 to 0.40. The revised quantitative insulin sensitivity check index (RQUICKI) and RQUICKI–BHB indexes did not present variations throughout the experimental periods (p > 0.05). RQUICKI showed values between 0.38 and 0.50, while RQUICKI–BHB was between 0.42 and 0.53. The correlation between insulin indexes and associated metabolites is presented in Table 6. HOMA correlated negatively with QUICKI ( r=−0.97; p < 0.0001), RQUICKI ( r=−0.82; p < 0.0001), and RQUICKI–BHB ( r=−0.45; p < 0.0001). QUICKI showed a positive correlation with RQUICKI ( r=0.77; p < 0.0001) and RQUICKI–BHB ( r=0.35; p < 0.0026), and the same response was observed between RQUICKI and RQUICKI–BHB ( r=0.78; p < 0.0001). To study the behavior of the insulin resistance indexes with respect to the analyzed metabolites in the present study, linear regression analyses were used, which are shown in Table 7. For the construction of the linear equations, the metabolites were used as dependent variables and the resistance indexes as regressor variables. The results show that HOMA and QUICKI indexes adjust the behavior of a greater quantity of the studied metabolites. The linear adjustment capacity of these indexes was high for variables such as insulin, glucose, and BCS (R2=0.57–0.87). Similarly, the RQUICKI index was adjusted adequately for variables such as insulin and BCS (R2=0.52 and 0.73, respectively), while the RQUICKI–BHB index showed the lowest adjustment capacity (R2 < 0.25). Figure 1 shows the relationship between insulin and QUICKI and insulin and HOMA indexes. The inverse relationship in insulin behavior when it is related to these indexes is evident. Table 4. Treatments’ mean values associated to analyzed metabolites through the experimental periods for grazing dairy cows under tropical conditions.
DiscussionMetabolites, hormones, and body conditionSome metabolites and hormones indicate the homeostasis loss degree during the transition period and allow to predict the effects of the negative energetic balance (NEB), which is studied through high BHB and NEFA values (Martens, 2020a), originated by high lipid mobilization at the beginning of the lactation period to supply energy requirements. This tendency was also observed in the present work. The CTR treatment showed the highest BHB levels, especially in the peripartum period (0.79–1.07 mmol/l). These values are below 1.20–1.40 mmol/l, which have been established as critical points in the first two postpartum weeks, given that BHB concentrations above this range are related to clinical ketosis, abomasal displacement, metritis, and a lower rate of pregnancy, being a potential biomarker of metabolic diseases (Benedet et al., 2019; Leblanc, 2020).
Fig. 1. Linear regression between insulin and the quantitative insulin sensitivity check index and between insulin and the homeostasis model assessment. Table 5. Insulin resistance indexes’ mean values estimated during six periods in the peripartum of grazing cows under tropical conditions.
NEFAs are considered a safe way to evaluate changes in the animal’s energy reserves. It has been reported that at the end of lactation and beginning of the dry period, NEFA values are lesser than 0.2 mmol/l. During the last 2 weeks of prepartum (late gestation phase), they increase gradually to reach a peak between days 0 and 10 postpartum with values around 0.75 mmol/l (Contreras and Sordillo, 2011). Other authors propose that an NEFA value of 0.25 mmol/l indicates stabilization in the energy balance, while concentrations higher than 0.4 mmol/l reveal intense lipo-mobilization, and values higher than 0.7 mmol/l are associated with risk of ketosis (Dar et al., 2018); in the present experiment, concentrations higher than 0.4 mmol/l were found for CTR (partum and day 15 postpartum) and, SUPP-1 (partum day) treatments, indicating the beginning of adipose tissue mobilization. The effect of supplementation treatments is evident since SUPP-2 treatment did not show an elevation in NEFA concentrations, while with SUPP-1 treatment only occurred during partum. These results agree with the BCS evaluation, where animals receiving SUPP-1 and 2 treatments suffered a less severe BCS loss through postpartum period. This was also observed when evaluating the BCS of the animals, which started the experimental period with a BCS of 3.5, and its fall in the postpartum was less severe for the CTR and SUPP-1 (Table 4). During peripartum, the cows showed a decrease in serum glucose concentration, with physiological values among 2.50 and 4.16 mmol/l (Russell and Roussel, 2007). The results found in the present work showed higher glucose concentrations in the antepartum period and a remarkable decrease at calving, which is consistent with the results of other studies (Baldacim et al., 2018). Glucose had its highest concentration in CTR treatment, at both the antepartum and postpartum periods, which may have been a behavioral response to the handling of these animals during the samples collection and associated stress in animal management. With SUPP-2, a stable glucose behavior was evidenced during the experiment, which could be explained by animal supplementation with phosphorus and vitamin B12 since these micronutrients participate in gluconeogenic processes regulation (Campos et al., 2018). As the postpartum time was longer in all treatments, glucose concentration also increased, showing the impact of calving and the beginning of lactation on its concentration, followed by a subsequent stabilization. Table 6. Pearson’s correlations between metabolites and insulin resistance indexes (estimated values and their significance are below and above the diagonal, respectively) for dairy cows under tropical conditions.
Cortisol concentrations found during the transition period were similar to other reports (Wankhade et al., 2017), but in the present work, the highest values were not associated with the day of partum. Cortisol showed high values in the antepartum period, a decrease in partum, and an increase until stabilizing in the postpartum period (Baldacim et al., 2018). All three treatments behaved similarly, suggesting an association with NEB, where glucocorticoids such as cortisol affect carbohydrate metabolism, stimulating gluconeogenesis to provide energy. Cortisol showed normal physiological behavior during the experiment, with temporal variations, similar to other reported cows in the tropics (Campos et al., 2009). T 3 showed no variation in the experimental period, and its values were between 1.72 and 2.62 nmol/l. T 4 showed differences at 30 days antepartum (CTR was higher) and 45 days postpartum (SUPP-1 and SUPP-2 were higher than CTR with values between 48 and 50.9 nmol/l). T 3 and T 4 values were higher than those reported by Fiore et al. (2017) but similar to those found by Campos and Giraldo (2008) for cows in tropical conditions. It has been proposed that animals with NEB present low T 3 and T 4 concentrations. On the contrary, animals in advanced lactation show positive energy balance and higher concentrations of these hormones (Fiore et al., 2017), a situation that was also found in the present work. Still, that positive effect was only seen with iodine mineral supplementation SUPP-1 around 45 days postpartum. Insulin concentration during the transition period decreases. Thus, to select fatty acids mobilization from adipose tissue, glucose absorption and oxidation in insulin-sensitive tissues are reduced to ensure this metabolite’s greater more significant contribution to the mammary gland for milk production (Gross and Bruckmaier, 2019). During the transition period, insulin values between 184 and 73 pmol/l were reported (Mann et al., 2016). In the present work, insulin levels were low during partum and postpartum periods. This behavior pattern could be related to the high glucose requirements by the mammary gland at the beginning of lactation, which causes a reduction in the insulin synthesis in the pancreas, decreasing the response to insulin in muscle and fat tissue. This behavior agrees with the designation of insulin resistance (Martens, 2020b), although the exact pancreas function cannot be determined. The higher values found in supplemented groups could be explained by the presence of iodine in the animals’ treatments since this mineral favors the synthesis of thyroid hormones, which stimulates insulin secretion (Fiore et al., 2017). In addition, SUPP-2 treatment (multivitamin and mineral supplementation) included other minerals such as zinc, which stabilizes the insulin molecule, enhances its action, and prolongs the lifetime; calcium was also included, which participates in insulin secretion from the β-cells in the islets of Langerhans (Jing et al., 2005). Table 7. Linear regression between metabolites and insulin resistance indexes for dairy cows under tropical conditions.
In general, hormonal behavior during the transition period and the beginning of lactation followed expected physiological patterns and, except for insulin, no significant relationships were found between hormones and energy metabolism indicators (Table 7), which is in agreement with Schuh et al. (2019). Insulin resistance indexesThe reported values are similar to other studies where comparisons between experimental groups and different treatments were made (Cincović et al., 2017; Youssef et al., 2017; Vranković et al., 2019). Insulin resistance is associated with high values of HOMA index and low values of QUICKI, RQUICKI, and RQUICKI–BHB (De Koster and Opsomer, 2013), a situation that is evidenced in the present work (Table 5). Similar values were evidenced among indexes. They were low in prepartum, partum, and the beginning of lactation. These results could be related to a lower capacity insensitive estimation of peripheral tissues to the insulin levels where it acts on processes that involve nutrients absorption by the mammary gland and the cortisol hyperglycemic function during peripartum (Martens, 2020b). Values’ variation around partum period is associated with the beginning of colostrum, and milk synthesis and their relationship with high lipids mobilization from the corporal reserves, which affects animals in NEB; RQUICKI coefficients are similar to other reports (Holtenius and Holtenius, 2007; Cincović et al., 2017) where a value of 0.48 pmol/l for the first 3 weeks postpartum and 0.50–0.52 pmol/ between 4 and 15 weeks postpartum was found. They suggest that 3 weeks before partum, RQUICKI values start a gradual decline that reaches its lowest point around the second week postpartum to increase again after that time. For RQUICKI–BHB, it has been established that the lowest values occur between days 10 and 15 postpartum (Vranković et al., 2019). On the other hand, Abuelo et al. (2014) found a similar behavior to the present work, with values of 0.46 in the antepartum period and 0.53 in the early postpartum period. The HOMA index directly reflects the insulin concentration with higher values in SUPP-2, followed by SUPP-1 and CTR, and this could be explained by insulin participation in the index construction and vitamin or mineral supplementation effect on the hormone. This showed higher and lower values in the antepartum and postpartum periods, respectively. These results are aligned with those obtained by Abuelo et al. (2014), who showed index values of 63.38 between days 29 and 3 before partum; 39.87 for days 3–30 postpartum, and 69.51 from day 31 to 90 postpartum; similar values in the peripartum of meat-type cows were reported by Vranković et al. (2019). Although the HOMA index has been extrapolated from human medicine, especially associated with type 2 diabetes identification and metabolic syndrome, it has also been used in animals. However, its use is questioned by some authors who claim that this is not an adequate model in herd health because B-cells functionality cannot be determined, and therefore it could not be a reliable estimator in insulin resistance diagnosis (Muniyappa et al., 2008; Zachut et al., 2013). On the other hand, it is necessary to consider that an assessment of insulin resistance should be linked to energy balance, since the glucose : insulin ratio depends on it, and without this balance, it is questionable to determine the existence of insulin resistance only using the index, as has been discussed by Zachut et al. (2013). QUICKI was similar between treatments during the antepartum period. This behavior is related to the inverse correlation between the associated metabolites and the index (−0.8 for glucose and −0.89 for insulin, and 0.36 for lactation initiation). According to the analysis, HOMA and QUICKI values between 0.32 and 0.52 were found for transition cows (Cincović et al., 2017), while Abuelo et al. (2014) reported values for antepartum and peak lactation of 0.33 and 0.36 for initiation of lactation; values that coincide with those are found in this research. Only HOMA and QUICKI presented statistical significance in the interaction between periods and treatments. These two indexes glucose and insulin were used as the bases for their calculations and allowed a fast interpretation of insulin resistance. However, these values cannot be directly related to hormones or metabolite concentrations or with dairy cow’s production levels where animals with higher production would be expected to present insulin resistance with lower QUICKI values (Rodriguez et al., 2018). A negative correlation between HOMA and QUICKI indexes (Table 6) is reasonable from the logarithm mathematical concept used in the QUICKIindex. A direct relationship between insulin and glucose concentration was found for the HOMA model. Meanwhile, an inverse relationship of these metabolites was observed for QUICKI, RQUICKI, and RQUICKI–BHB indexes, which is attributed to the mathematical transformation of glucose, insulin, NEFA, and BHB concentrations (Muniyappa et al., 2008). A similar association between QUICKI, RQUICKI, and RQUICKI–BHB indexes were reported by Abuelo et al. (2014). RQUICKI and RQUICKI–BHB indexes presented a significant correlation (0.78) evidencing similar behavior. However, the highest relationship was found among HOMA and QUICKI indexes. These behaviors were reflected with the adjustment capacity of linear regression analysis. HOMA and QUICKI indexes adjust to insulin, glucose, and BCS (R2 was between 0.57 and 0.87). The HOMA regression analysis indicated that insulin increased to 1.66 pmol/l for a unit increase of the index, resulting in a better prediction of the biological hormone response. For QUICKI, a negative value was found. However, its interpretation was difficult according to its magnitude that is affected by the logarithm transformation. HOMA and QUICKI models showed coherent results derived from insulin concentration. Periods with high insulin values were reflected with high and low HOMA and QUICKI values, respectively. These results suggest that HOMA and QUICKI indexes were modulated by insulin concentration with a direct relationship between insulin and the HOMA index and an inverse association between insulin and QUICKI, as shown in Figure 1. Insulin resistance estimation indexes have not been defined for grazing cows in tropical conditions. The values presented here allow us to determine indexes behavior and to identify animals with insulin resistance. Endocrine and metabolic changes that occur in late pregnancy and early lactation in cows as a homeorhetic function against the new physiological state (Martens, 2020b) modifying glucose, insulin, NEFA, and BHB concentrations; therefore, during this homeostatic alteration stage the validity of estimation indexes as a diagnostic method of insulin resistance decreases and their use should be considered carefully (De Koster and Opsomer, 2013). Although the use of the indexes to estimate insulin sensitivity has increased in veterinary medicine (Rodriguez et al., 2018), for applicability in herd health, further research in this area is necessary. The main inconveniences associated with its use in the veterinary practice is the moment of blood samples collection; in humans, these are obtained during the pre- and postprandial periods, which could not be carried out in bovines, since these animals, even with a long fasting period, they have ruminal content that acts as a long duration food deposit, with permanent volatile fatty acids production by fermentation. Besides, cattle have a higher percentage of fat reserves than humans’ metabolic weight, so the same metabolic situation between these two species is not comparable (Muniyappa et al., 2008; Esposito et al., 2014). Currently, there are no analytical limitations for a correct application of the indexes to estimate insulin sensitivity in cattle (Lacasse et al., 2018); likewise, the use of these indexes presents advantages because they are less invasive than techniques such as glycemic-insulin clamps or glucose tolerance tests carried out on grazing cattle. ConclusionVitamins and mineral supplementation did not show a positive effect on the metabolism of dairy cows during the transition period and the first phase of lactation. Cows showed stable glucose, higher insulin, thyroid hormones concentrations, and fewer lipid reserves mobilization. The indexes’ values of insulin sensitivity in the present work constitute a starting point in tropical dairy cows to characterize insulin resistance and metabolic alterations that require further studies during the transition period. The difference in human and animal insulin resistance indexes interpretation must be taken into account, specifically in bovines, where the nutritional and productive challenges in high producing dairy cows, where dietary requirements are not always fulfilled, and affect the basal hormones and metabolites concentration used to obtained insulin resistance indexes suggesting that insulin resistance occurs by nutrient demands and not by excess, as it is the case of the metabolic syndrome in humans. Conflict of interestThe authors declare that there is no conflict of interest. Author’s contributionKatherine García Alegria collected the required samples, performed different experimental treatments and laboratory analyzes, collected the data, interpreted, and statistically analyzed the results obtained, and wrote the manuscript. Rómulo Campos Gaona planned and supervised the study, wrote, and revised the final version of the manuscript before its submission. Mauricio Vélez Terranova participated in the statistical analysis of the data, in the implementation of the model’s statistics, and in the writing of the manuscript. Erika A. Hernández participated in the data collection, laboratory analysis, and final edition of the paper. ReferencesAbuelo, A., Hernández, J., Benedito, J.L. and Castillo, C. 2014. A comparative study of the metabolic profile, insulin sensitivity and inflammatory response between organically and conventionally managed dairy cattle during the periparturient period. Animal 8, 1516–1525. Baldacim, V.A.P., Madureira, K.M., Ramos, J.S., Silva, C.P.D.C.E., Mori, C.S., Dias, M.R.B. and Gomes, V. 2018. Dynamic of metabolic indicators, insulin like-growth factor I (IGF-I) and cortisol in Holstein cows during the transition period. Acta. Sci. Vet. 46, 1–8. Benedet, A., Manuelian, C.L., Zidi, A., Penasa, M. and De Marchi, M. 2019. Invited review: β-hydroxybutyrate concentration in blood and milk and its associations with cow performance. Animal 13, 1676–1689. Campos, R., Correa, O.A., Zambrano, B.G.L. and Ospina, C.A. 2018. Alteraciones bioquímicas y metabólicas en el periodo de transición en vacas lecheras. RIAA 9, 1–16. Campos, R., Hernández, E.A., Giraldo, L. and González, F. 2009. Cortisol e sua relação com a regulação endócrina no período de transição em vacas leiteiras sob condições do trópico colombiano. Ciência. Anim. Bra. Suppl. 1, 790–794. Campos, G.R. and Giraldo, L. 2008. Efecto de la raza y la edad sobre las concentraciones de hormonas tiroideas T3 y T4 de bovinos en condiciones tropicales. Acta. Agro. 57, 137–141. Cincović, M., Kirovski, D., Vujanac, I., Belić, B. and Djoković, R. 2017. Relationship between the indexes of insulin resistance and metabolic status in dairy cows during early lactation. Acta. Vet. 67, 57–70. Contreras, G.A. and Sordillo, L.M. 2011. Lipid mobilization and inflammatory responses during the transition period of dairy cows. Comp. Immunol. Microbiol. Infect. Dis. 34, 281–289. Dar, A.M., Malik, H.U., Beigh, S.A., Hussain, S.A., Nabi, S.U., Dar, A.A., Dar, P.A. and Bhat, A.M. 2018. Clinico-biochemical alternation in bovine ketosis. J. Entomol. Zool. Stu. 6, 1146–1150. De Koster, J., Hostens, M., Hermans, K., Van Den Broeck, W. and Opsomer, G. 2016. Validation of different measures of insulin sensitivity of glucose metabolism in dairy cows using the hyperinsulinemic euglycemic clamp test as the gold standard. Domest. Anim. Endocrinol. 57, 117-126. De Koster, J.D. and Opsomer, G. 2013. Insulin resistance in dairy cows. Vet. Clin. Food. Anim. 29, 299–322. Di Rienzo, J., Machiavelli, R. and Casanoves, F. 2017. Linear mixed models applications in InfoStat, 1st ed., Córdoba, Argentina. Esposito, G., Irons, P.C., Webb, E.C. and Chapwanya, A. 2014. Interactions between negative energy balance, metabolic diseases, uterine health and immune response in transition dairy cows. Ani. Repro. Sci. 144, 60–71. Fiore, E., Giambelluca, S., Morgante, M., Piccione, G., Vazzana, I., Contiero, B., Orefice, T., Arfuso, F. and Gianesella, M. 2017. Changes in thyroid hormones levels and metabolism in dairy cows around calving. Acta. Vet. 673, 318–330. García A.K., Campos, R. and Giraldo P.L. 2016. Suplementación vitamínica y mineral como estrategia para reducir la incidencia de cetosis bovina en el trópico bajo. RECIA 8, 204–213. Gobikrushanth, M., Macmillan, K., Behrouzi, A., Hoff, B. and Colazo, M.G. 2019. The factors associated with postpartum body condition score change and its relationship with serum analytes, milk production and reproductive performance in dairy cows. Liv. Sci. 228, 151–160. Gross, J.J. and Bruckmaier, R.M. 2019. Invited review: metabolic challenges and adaptation during different functional stages of the mammary gland in dairy cows: perspectives for sustainable milk production. J. Dairy. Sci. 102, 2828–2843. Holtenius, P. and Holtenius, K. 2007. A model to estimate insulin sensitivity in dairy cows. Acta. Vet. Scand. 49, 3–5. Jing, X., Li, D.Q., Olofsson, C.S., Salehi, A., Surve, V.V., Caballero, J., Ivarsson, R., Lundquist, I., Pereverzev, A., Schneider, T., Rorsman, P. and Renström, E. 2005. Cav2.3 calcium channels control second-phase insulin release. J. Clin. Invest. 115, 146–154. Lacasse, P., Vanacker, N., Ollier, S. and Ster, C. 2018. Innovative dairy cow management to improve resistance to metabolic and infectious diseases during the transition period. Res. Vet. Sci. 116, 40–46. Leblanc, S.J. 2020. Review: relationships between metabolism and neutrophil function in dairy cows in the peripartum period. Animal 14, S44–S54. Macmillan, K., Gobikrushanth, M., Behrouzi, A., López-Helguera, I., Cook, N., Hoff, B. and Colazo, M.G. 2020. The association of circulating prepartum metabolites, minerals, cytokines and hormones with postpartum health status in dairy cattle. Res. Vet. Sci. 130, 126–132. Mann, S., Yepes, F.L., Duplessis, M., Wakshlag, J.J., Overton, T.R., Cummings, B.P. and Nydam, D.V. 2016. Dry period plane of energy: effects on glucose tolerance in transition dairy cows. J. Dairy. Sci. 99, 701–717. Martens, H. 2020a. Transition period of the dairy cow revisited: I. Homeorhesis and is changes by selection and management. J. Agri. Sci. 12, 1–24. Martens, H. 2020b. Transition period of the dairy cow revisited: II. Homeorhetic stimulus and ketosis with implication for fertility. J. Agri. Sci. 12, 25–54. Muniyappa, R., Lee, S., Chen, H. and Quon, M.J. 2008. Current approaches for assessing insulin sensitivity and resistance in vivo: advantages, limitations, and appropriate usage. Am. J. Physiol. Endocrinol. Metab. 294, E15–E26. Rodriguez, J.S., Haerr, K.J., Trevisi, E., Loor, J.J., Cardoso, F.C. and Osorio, J.S. 2018. Prepartal standing behavior as a parameter for early detection of postpartal subclinical ketosis associated with inflammation and liver function biomarkers in peripartal dairy cows. J. Dairy. Sci. 101, 8224–8235. Raun, N.S. 2019. Mineral nutrition of beef cattle on acid infertile soils of tropical regions in Latin America. In Beef cattle science handbook, Boca Raton, FL: Edited By: Frank H. Baker, Mason E. Miller. CRC Press, pp: 672–679. Russell, K.E. and Roussel, A.J. 2007. Evaluation of the ruminant serum chemistry profile. Vet. Clin. Food. Anim. 23, 403–426. Schuh, K., Sadri, H., Häussler, S., Webb, L.A., Urh, C., Wagner, M., Koch, C., Frahm, J., Dänicke, S., Dusel, G. and Sauerwein, H. 2019. Comparison of performance and metabolism from late pregnancy to early lactation in dairy cows with elevated v. normal body condition at dry-off. Animal 13, 1478–1488. Spears, J.W. and Weiss, W.P. 2014. Invited review: mineral and vitamin nutrition in ruminants. In the American Registry of Professional Animal Scientists (ARPAS) symposium: applied nutrition of ruminants—current status and future, Indianapolis, Indiana, pp: 180–191. Vranković, L., Aladrović, J., Pipal, I., Beer, L.B., Prvanović, B.N. and Stojević, Z. 2019. Quantitative insulin sensitivity checks indexes in early postpartum cows and calves kept in a beef suckler system. Bìol. Tvarin. 21, 73--76. Wankhade, P.R., Manimaran, A., Kumaresan, A., Jeyakumar, S., Ramesha, K.P., Sejian, V., Rajendran, D. and Varghese, M.R. 2017. Metabolic and immunological changes in transition dairy cows: a review. Vet. World. 10, 1367–1377. Youssef, M.A., El-Ashker, M.R. and Younis, M.S. 2017. The effect of subclinical ketosis on indexes of insulin sensitivity and selected metabolic variables in transition dairy cattle. Comp. Clin. Pathol. 26, 329–334. Zachut, M., Honig, H., Striem, S., Zick, Y., Boura-Halfon, S. and Moallem, U. 2013. Periparturient dairy cows do not exhibit hepatic insulin resistance, yet adipose-specific insulin resistance occurs in cows prone to high weight loss. J. Dairy. Sci. 96, 5656–5669. | ||
| How to Cite this Article |
| Pubmed Style KGA, RCG, MVT, Hernandez EA. Insulin Resistance Indexes of grazing cows and mineral or vitamin supplementation under tropical conditions. Open Vet J. 2021; 11(4): 587-597. doi:10.5455/OVJ.2021.v11.i4.8 Web Style KGA, RCG, MVT, Hernandez EA. Insulin Resistance Indexes of grazing cows and mineral or vitamin supplementation under tropical conditions. https://www.openveterinaryjournal.com/?mno=104417 [Access: April 20, 2024]. doi:10.5455/OVJ.2021.v11.i4.8 AMA (American Medical Association) Style KGA, RCG, MVT, Hernandez EA. Insulin Resistance Indexes of grazing cows and mineral or vitamin supplementation under tropical conditions. Open Vet J. 2021; 11(4): 587-597. doi:10.5455/OVJ.2021.v11.i4.8 Vancouver/ICMJE Style KGA, RCG, MVT, Hernandez EA. Insulin Resistance Indexes of grazing cows and mineral or vitamin supplementation under tropical conditions. Open Vet J. (2021), [cited April 20, 2024]; 11(4): 587-597. doi:10.5455/OVJ.2021.v11.i4.8 Harvard Style , K. G. A., , . R. C. G., , . M. V. T. & Hernandez, . E. A. (2021) Insulin Resistance Indexes of grazing cows and mineral or vitamin supplementation under tropical conditions. Open Vet J, 11 (4), 587-597. doi:10.5455/OVJ.2021.v11.i4.8 Turabian Style , Katherine Garcia Alegria, Romulo Campos Gaona, Maurico Velez Terranova, and Erika Andrea Hernandez. 2021. Insulin Resistance Indexes of grazing cows and mineral or vitamin supplementation under tropical conditions. Open Veterinary Journal, 11 (4), 587-597. doi:10.5455/OVJ.2021.v11.i4.8 Chicago Style , Katherine Garcia Alegria, Romulo Campos Gaona, Maurico Velez Terranova, and Erika Andrea Hernandez. "Insulin Resistance Indexes of grazing cows and mineral or vitamin supplementation under tropical conditions." Open Veterinary Journal 11 (2021), 587-597. doi:10.5455/OVJ.2021.v11.i4.8 MLA (The Modern Language Association) Style , Katherine Garcia Alegria, Romulo Campos Gaona, Maurico Velez Terranova, and Erika Andrea Hernandez. "Insulin Resistance Indexes of grazing cows and mineral or vitamin supplementation under tropical conditions." Open Veterinary Journal 11.4 (2021), 587-597. Print. doi:10.5455/OVJ.2021.v11.i4.8 APA (American Psychological Association) Style , K. G. A., , . R. C. G., , . M. V. T. & Hernandez, . E. A. (2021) Insulin Resistance Indexes of grazing cows and mineral or vitamin supplementation under tropical conditions. Open Veterinary Journal, 11 (4), 587-597. doi:10.5455/OVJ.2021.v11.i4.8 |

